

Only 21% of startup employer firms operated at a profit in 2022, even though startups were more likely than older firms to report revenue growth, according to the Federal Reserve's report on startup firms. That puts a founder's real question into focus: Are we building a more profitable business, or just doing more work?
Good profit & loss analysis answers that question without stopping at net income. It shows what remains after delivery costs, which jobs and customers deserve your capacity, and whether the earnings you've reported are turning into cash you can use.
Table of Contents
- Read the Profit and Loss Stack in One Pass
- Why One Period of Net Income Is Not Enough
- Three Margin Views Beneath Company Profit
- When Reported Profit and Cash Disagree
- Worked Examples for Three Owner-Led Industries
- Pitfalls That Make a Healthy P&L Misleading
- Run This Month's Profit Review
Read the Profit and Loss Stack in One Pass
After sales and the costs to deliver and run the company, did the period produce a profit, break even, or generate a loss? A profit and loss statement, also called an income statement, organizes the answer by reporting period.
The FDIC's financial management guide describes a P&L as a report of revenue and expenses over a month, quarter, or year. Read its basic calculation in layers: sales minus cost of goods sold equals gross profit; gross profit minus overhead equals pretax net profit; subtract income taxes to arrive at net profit.
Separate delivery costs from running costs
Cost of goods sold, or direct cost, means the costs tied to delivering your product or service. Materials, direct labor, subcontractors, and freight belong in this discussion, with consistent accounting policies determining their classification.
Overhead means the ongoing costs of running the company, such as administrative payroll, rent, insurance, and marketing. Separating these categories matters because the corrective actions differ. A purchasing problem won't disappear because you cancel an office subscription.
Consider this simplified distributor scenario, using the FDIC's reporting structure.
How a $1 million distributor P&L breaks into layers
| Line | Amount | Percent of sales | What a weak result means |
|---|---|---|---|
| Sales | $1,000,000 | 100% | Volume without margin is not success |
| Cost of goods sold | $700,000 | 70% | Price, purchasing, or delivery cost is the issue |
| Gross profit | $300,000 | 30% | Contribution before overhead is too thin |
| Overhead | $220,000 | 22% | Operating cost is outrunning sales |
| Pretax net profit | $80,000 | 8% | Bottom line is what remains after both layers |
These are illustrative amounts, not industry benchmarks. Gross margin is gross profit divided by sales. The overhead ratio is overhead divided by sales, and pretax margin is pretax profit divided by sales.
Let the weak layer determine the decision
A thin gross margin calls for questions about price, purchasing, production, or delivery. Check discounting, supplier increases, labor efficiency, and whether estimates reflect the work your team performs.
A healthy gross margin with a disappointing pretax result calls for a different conversation. Review administrative staffing, occupancy, software, marketing commitments, and whether the business has enough profitable volume to support its operating structure.
Practical rule: Don't tell every manager to cut costs. Identify which layer weakened, then give the responsible manager a specific problem to solve.
Channel economics also deserve their own review. For established brands selling through marketplaces, Online Brand Growth's guide to assessing Amazon profitability for established brands offers a relevant channel-level resource alongside the company P&L.
Use the table as the first pass on this month's statement. Keep interest and non-operating items visible when they apply, rather than assuming operating profit and pretax profit are always identical. Most of all, don't treat pretax profit as an authorization to distribute money.
Why One Period of Net Income Is Not Enough
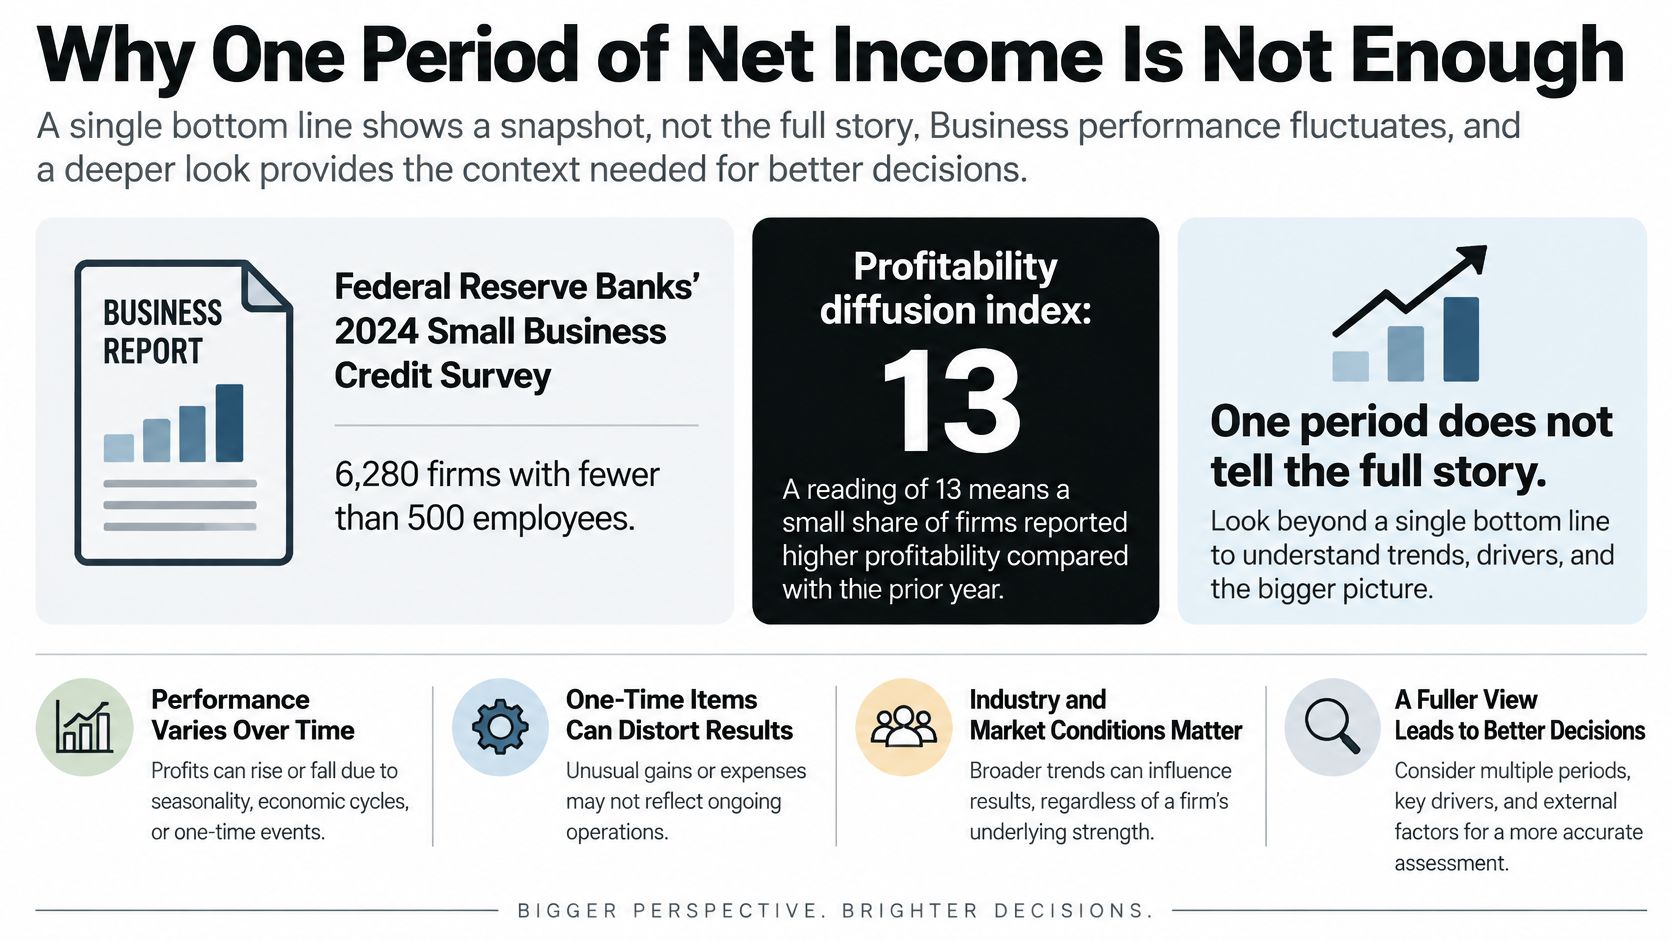
The profitability differential fell from 46 percentage points in December 2019 to 13 percentage points in December 2024, according to the Federal Reserve Banks' small-business indicators. The latter measure draws on the 2024 Small Business Credit Survey, which collected responses from 6,280 firms with fewer than 500 employees.
That differential isn't a profit margin. It subtracts the percentage of firms operating at a loss from the percentage operating at a profit. A positive result means profitable firms outnumbered loss-making firms, but the comparison shows why direction matters.
The visual summarizes the distinction between a positive result and a strong trend.
Compare performance on a consistent basis
Your company needs that same discipline. A good month can reflect seasonal demand, delayed expenses, or an unusually favorable contract rather than durable improvement.
Build a monthly and quarterly comparison that includes:
- Revenue and direct costs: Identify whether higher sales produced proportionately more gross profit.
- Overhead and operating margin: Check whether added infrastructure is earning its keep.
- Prior-period and prior-year results: Separate recent changes from recurring seasonal patterns.
- Planned investment: Give growth spending an owner, an expected payoff, and a review date.
Rising sales can coexist with higher labor, materials, customer-acquisition, or financing costs. The useful question isn't whether revenue grew. It's whether the next increment of revenue improves operating earnings.
Use earnings quality analysis to distinguish repeatable performance from temporary boosts. Before approving a hire, equipment purchase, or new contract, write down how the decision should change both dollars of profit and the margin trend.
Three Margin Views Beneath Company Profit
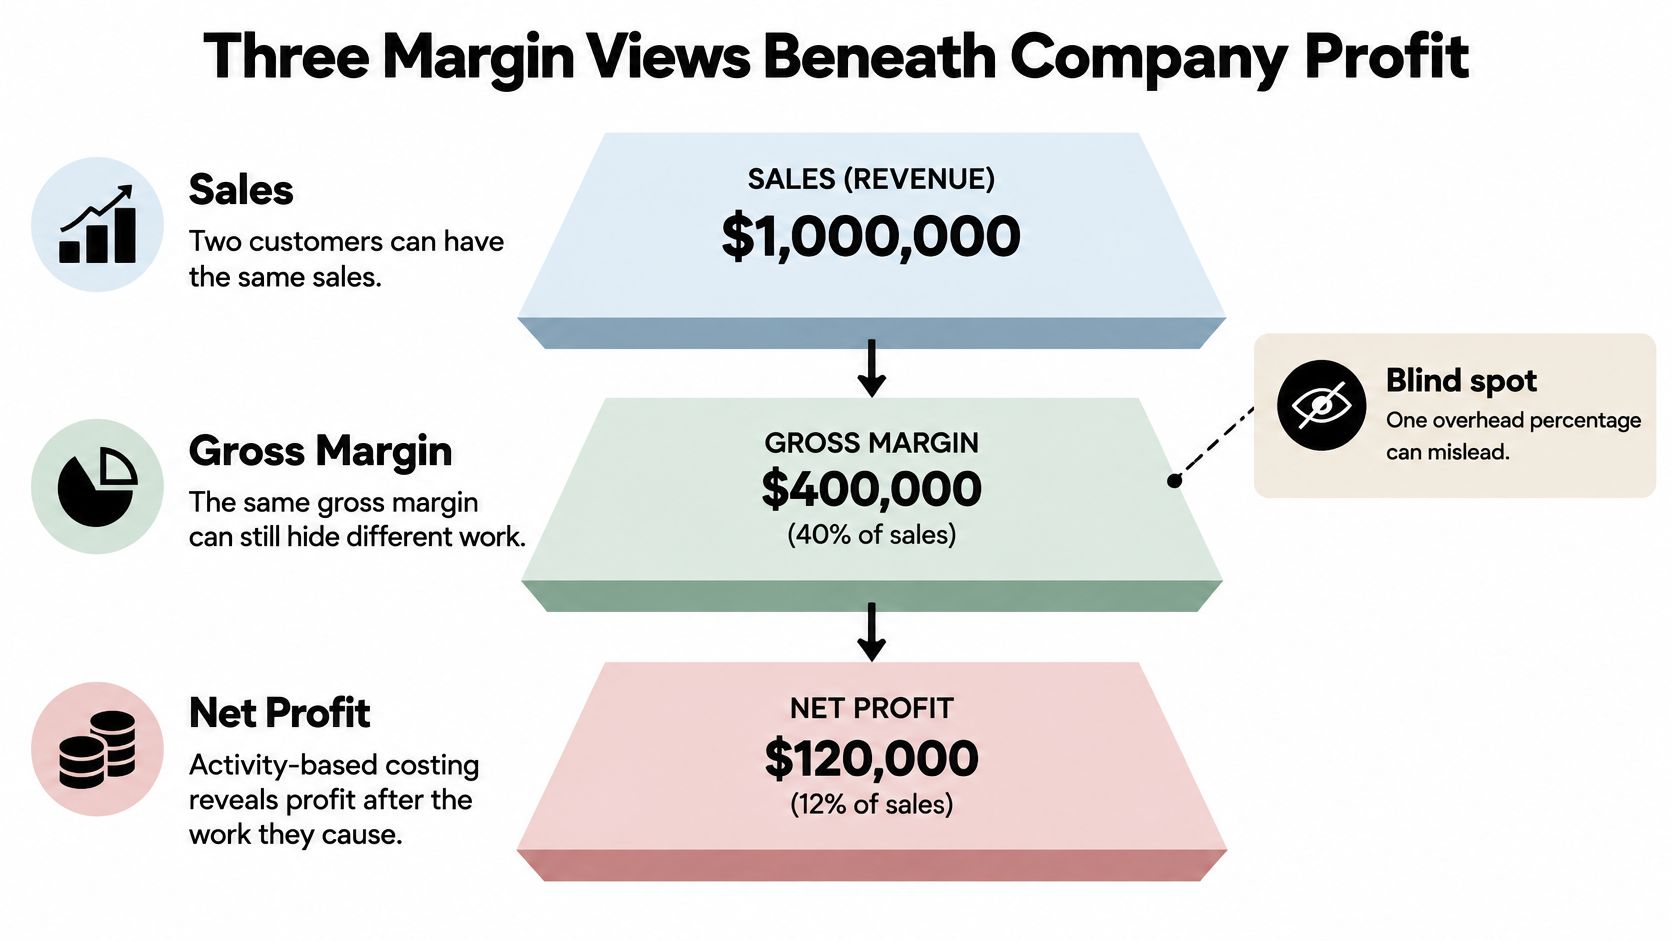
Two customers can buy the same amount and show the same gross margin while leaving very different amounts behind. One places predictable orders and pays promptly. The other requires expedited deliveries, repeated revisions, returns, and extensive collections work.
Activity-based costing assigns costs according to the activities that consume resources. The activity-based profitability analysis framework distinguishes unit-level costs from batch, product-sustaining, segment, and customer-level costs, rather than spreading everything through a broad overhead percentage.
This diagram highlights why a company-wide margin can conceal customer-level differences.
Follow the work a customer causes
Consider a hypothetical client or project with $100,000 of revenue and a 30% gross margin. That leaves $30,000 before activity-specific costs. Another $8,000 of delivery, rework, service, and administrative effort reduces attributable contribution to $22,000, or 22%.
The initial gross margin wasn't necessarily wrong. It was incomplete for the pricing decision.
Three margin views on a $100,000 client or project
| Margin view | Costs included | Dollars left | Rate |
|---|---|---|---|
| Direct contribution margin | Unit-level direct costs only | $30,000 | 30% |
| Controllable segment margin | Plus delivery, rework, service, and admin effort of $8,000 | $22,000 | 22% |
| Fully loaded operating margin | Plus remaining segment and customer-level overhead | $22,000 less remaining allocated overhead | Remaining profit divided by $100,000 |
Treat these as defined management views, not universal accounting labels. Document what each includes, and don't deduct an expense again if it's already included in direct costs. The segment margin formula can help structure the middle view consistently.
Use each view for a different conversation
Direct contribution helps you assess delivery economics. Controllable segment margin shows what remains after the additional work attributable to an account or business segment. Fully loaded operating margin tests whether the work also supports the company's broader operating structure.
Trace activities that your team can explain and measure:
- Construction: Estimating, supervision, mobilization, rework, and change-order administration by job.
- Distribution: Warehouse touches, delivery stops, returns, and credit exposure by account.
- Professional services: Nonbillable management, scope creep, and realization losses by client.
For another explanation of profitability analysis, use the video alongside your account worksheet.
Revenue volume is not a verdict on customer value.
Use activity-adjusted margins when setting prices, renewing contracts, assigning staff, or deciding which customers to retain. Don't reject an otherwise useful customer solely because an arbitrary overhead allocation looks unfavorable. Separate costs you can change from shared costs that will remain.
Before your next pricing conversation, pick a large account and complete all three views. Ask operations to validate the effort assumptions before you negotiate.
When Reported Profit and Cash Disagree
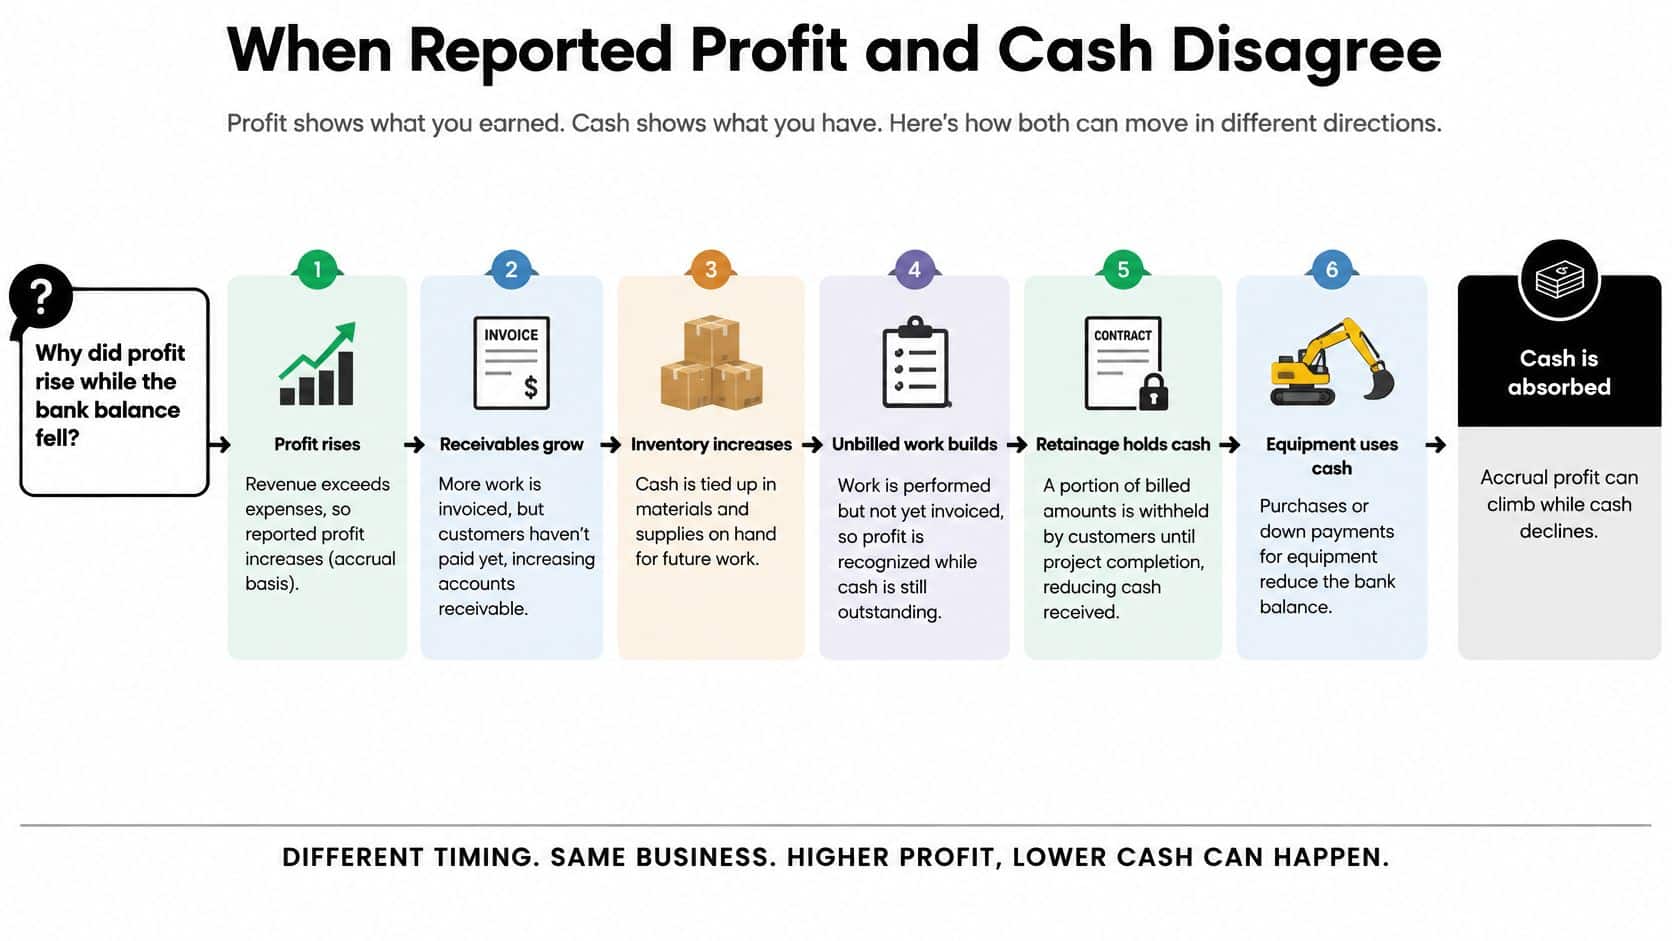
Why did profit rise while the bank balance fell? Under accrual accounting, you record revenue when earned and expenses when incurred, not when money changes hands. Receivables, inventory, unbilled work, retainage, and capital spending can absorb cash while reported earnings improve.
Build the profit-to-cash bridge
Use this sequence with your finance lead:
- Start with net income for the reporting period.
- Add back non-cash charges, such as depreciation.
- Subtract increases in operating assets, including receivables, inventory, unbilled work, and retainage.
- Add increases in payables, accounting for other operating liabilities as needed.
- Subtract equipment purchases, debt principal, and owner distributions.
- Reconcile to the actual change in cash, including borrowing, capital contributions, or other movements needed to explain the difference.
Reverse the adjustment when a working-capital balance decreases. Keep retainage and unbilled work separate only when they aren't already included in another balance.
This flow illustrates common places where cash gets tied up.
A meta-analysis of working capital and profitability, covering 43 studies, almost 62,000 enterprises, and 35 countries, using data from 1992–2017, found a statistically significant negative relationship between profitability and the cash-conversion cycle. That's an association, not proof that every reduction improves profit.
As an illustrative sales-based calculation, a $20 million business shortening its cycle by 10 days represents approximately $548,000, using a 365-day year, before tax or financing effects. Your actual release depends on which balances change and their relevant sales or cost base.
Assign responsibility for cash timing
Use converting accrual to cash to support the reconciliation, then assign ownership rather than merely reporting ratios.
Cash dashboard with owners and warning signs
| Metric | Definition | Owner | Warning sign |
|---|---|---|---|
| Revenue | Sales booked in the month | Sales lead | Growth without margin gain |
| Gross margin | Gross profit divided by sales | Operations lead | Falls two months in a row |
| Operating expenses | Overhead as a percent of sales | Finance lead | Rising faster than sales |
| EBITDA | Earnings before interest, taxes, depreciation, and amortization | Finance lead | Gap to cash widens |
| Receivable days | Average days to collect invoices | Credit owner | Rising on flat sales |
| Inventory days | Days of stock on hand | Purchasing lead | Stock rising faster than sales |
| Payable days | Average days to pay suppliers | Finance lead | Stretched near supplier limits |
| Cash-conversion cycle | Receivable days plus inventory days minus payable days | Owner | Lengthening cycle |
These warning signs are suggested management triggers, not universal thresholds. Optimize working capital without starving inventory or imposing terms that undermine service.
Construction teams should inspect billing and change-order timing; distributors should inspect stock and collections; service firms should inspect unbilled work. For an education-services example, Tutorbase's resource on how to get paid faster as a tutoring business provides a focused billing-workflow reference.
Worked Examples for Three Owner-Led Industries
Construction and the disappearing job margin
A contract can look attractive when signed and disappointing before completion. A 2024 critical review of construction cost control reports an estimated 86% likelihood of cost overrun for international building projects, reinforcing the need to monitor estimated versus actual costs.
Consider this hypothetical contract:
| Job position | Direct costs | Gross profit | Gross margin |
|---|---|---|---|
| $2,000,000 contract as budgeted | $1,600,000 | $400,000 | 20% |
| After a 5% direct-cost overrun | $1,680,000 | $320,000 | 16% |
| After a 10% direct-cost overrun | $1,760,000 | $240,000 | 12% |
The overruns reduce the dollars available for overhead and profit. Waiting until the final invoice removes your chance to adjust purchasing, staffing, or change-order recovery while work is underway.
Build a monthly job-cost worksheet with contract revenue, approved change orders, labor, materials, equipment, subcontractors, committed costs, costs incurred, estimated cost to complete, and forecast final margin. Use job costing to connect those fields to the project rather than relying on the company-wide result.
Distribution and the expensive account
Start with account gross profit, then deduct the cost of serving the account. Use order records, warehouse activity, delivery routes, returns, and credit records to identify where your team spends time.
A busy account may need a delivery minimum, consolidated ordering, or revised return terms rather than a blanket price increase. Give the account manager a worksheet showing revenue, product cost, service activity, attributable cost, and contribution after service.
Professional services and unused capacity
Utilization means billable hours divided by available hours. Realization measures how much standard billable value ultimately becomes invoiced or collected revenue, so define your chosen version consistently.
Using the utilization figures discussed in MinuteDock's professional-services time-tracking guide, consider a hypothetical team of 10 consultants with 2,000 available hours each. At 68.9% utilization, they produce 13,780 billable hours; at 75%, they produce 15,000, an additional 1,220 hours, worth $183,000 at $150 an hour before delivery costs.
The same guide cites realization of 99% for accounting practices under $2 million in net fees, compared with 87.1% for practices over $20 million. Those are accounting-practice comparisons, not targets for every service firm.
Weak utilization prompts a pipeline, scheduling, and internal-time review. Weak realization prompts a review of write-offs, scope creep, discounts, and collections. Track both before concluding that hiring more people will improve earnings.
Pitfalls That Make a Healthy P&L Misleading
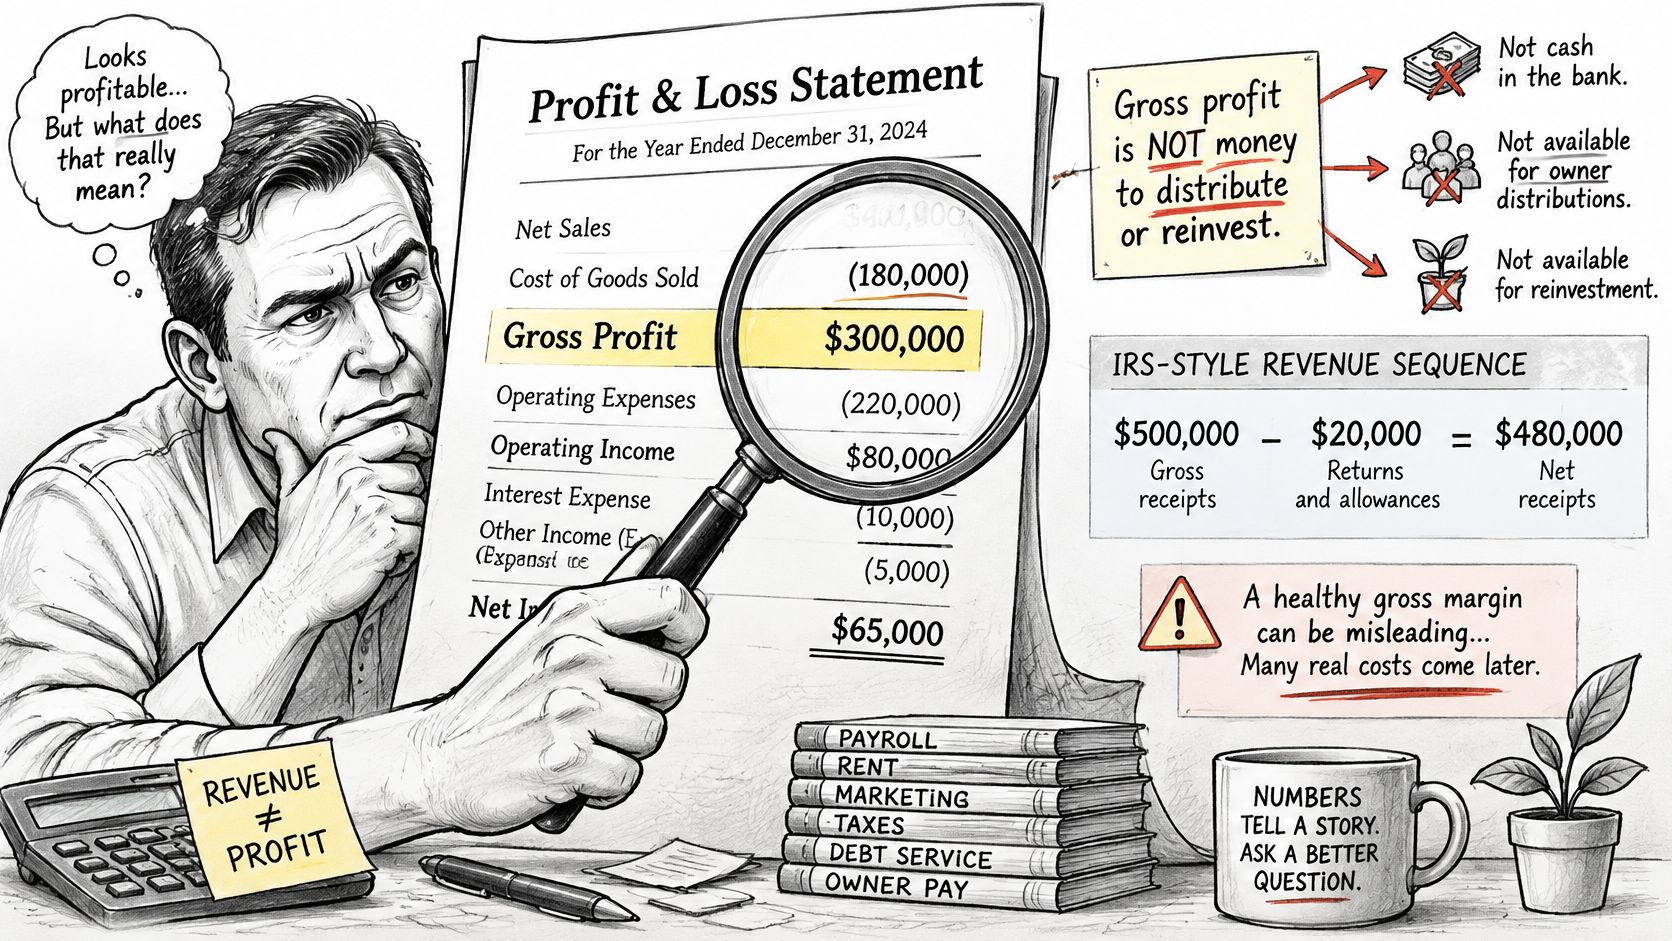
Gross profit isn't money you can freely distribute or reinvest. The IRS guide for small businesses separates gross receipts, returns and allowances, cost of goods sold, and business expenses when explaining the path to net profit.
Consider a hypothetical company with $500,000 in gross receipts and $20,000 in returns and allowances. Net receipts are $480,000; subtracting $300,000 of direct costs leaves $180,000 of gross profit, a 37.5% margin. After $140,000 in operating expenses, pretax profit is $40,000, or approximately 8.3% of net receipts.
Decision check: A strong-looking subtotal doesn't authorize spending. Confirm what still has to be deducted and whether the result is repeatable.
Separate tax treatment from management judgment
The IRS generally requires deductible business expenses to be ordinary and necessary. That tax test doesn't tell you whether a customer is worth retaining or a department should expand.
Keep a management P&L beside your tax reporting. Show unusual gains separately, challenge owner add-backs, and explain adjustments rather than removing inconvenient expenses without explanation.
A closer inspection should reach the underlying transactions, not just the totals.
Make automated analysis earn your trust
A faster dashboard won't fix inconsistent job codes or unsupported revenue recognition. An AI-generated explanation can sound confident while comparing costs classified differently across clients or periods.
Before a pricing, hiring, equipment, or acquisition decision, run a short trust check:
- Standard definitions: Document the chart of accounts, revenue-recognition policy, job-cost codes, and allocation rules.
- Traceable inputs: Retain source records, report versions, and the calculation behind each adjustment.
- Human review: Name the person who approves classifications and investigates exceptions.
- Confidence flags: Mark margins provisional when costs are missing, estimates are stale, or allocations need validation.
- Reconciliation: Tie the management report back to the accounting P&L and explain every difference.
Test exceptions deliberately. Look for uncoded labor, costs posted after job completion, duplicate deductions, and unusually favorable margins.
These checks matter most where you assign costs to individual customers and reconcile earnings to cash. Don't let a polished report turn an unresolved accounting issue into a confident operating decision.
Run This Month's Profit Review
You don't need a perfect reporting system to make a better decision this week. You need a reconciled statement, a focused account review, and someone accountable for the next action.
Bring a decision to the leadership meeting
- Print the monthly P&L. Mark gross margin and the overhead ratio, then use actual versus budgeted analysis to identify the largest meaningful deviation.
- Choose a large job, customer, or client. Separate direct contribution from the contribution remaining after the extra work it causes.
- Bridge net income to cash. Name the biggest absorber, such as receivables, inventory, retainage, or distributions.
- Assign owners. Give every worsening margin or cycle measure a responsible person, corrective action, and review date.
- Write the decision. Reprice, re-estimate, remove a cost, change terms, or stop accepting work that doesn't meet your requirements.
Save the three tables as a compact worksheet. Review the completed version with your leadership team before the next bid, hire, or equipment purchase.
Use financial leadership alongside your accounting team
For founder-led construction, distribution, and professional-services businesses with roughly $10 million to $100 million in revenue, we work alongside your bookkeeper and CPA rather than replacing them. Our strategy session identifies where profit is leaking, where cash is trapped, which metrics deserve executive attention, and the highest-ROI improvements available today.
One client describes the outcome this way:
“AmbitionCFO came in, rebuilt our project costing from the ground up, and within six months we went from a trailing loss to clearing $317K in net profit.”
CEO, $22M Service Company
That's an individual client result, not a forecast for your company. Bring your completed worksheet so the conversation starts with your economics and the decisions you're facing.
AmbitionCFO offers margin analysis and rolling cash flow forecasts that account for collections, retainage, payroll, equipment purchases, and project timing. Visit AmbitionCFO to book a strategy session, and bring your latest P&L and completed worksheet so we can identify where profit is earned, where cash is tied up, and what to address first.