

Stop chasing higher profit. That's the popular advice, and it's incomplete. Profit growth means nothing if the profit won't repeat, won't collect, or disappears when one client leaves.
Earnings quality analysis answers a better question: How much of your reported profit is real, repeatable, and backed by cash? Run that test before you hire, buy equipment, accept a major contract, take a distribution, or price your company for sale. You'll make those decisions on the profit you can defend, not the profit that looks best in a monthly report.
Table of Contents
- Why Profit Alone Misleads Business Owners
- Seven Indicators and Their Red Flags
- Recurring Items Hiding Behind One-Time Labels
- Revenue Timing and Accruals in Plain Terms
- How to Run an Earnings Quality Review Step by Step
- Job and Client Margins That Reveal Fragile Profit
- Forecasting and Exit Value Depend on Repeatable Earnings
- Confirm Your Earnings Before Your Next Big Decision
Why Profit Alone Misleads Business Owners
A restaurant receipt says what was sold. The cash in the drawer pays suppliers. Your income statement works the same way. It can show a record month while payroll still feels tight, because profit records work when it's earned, not when the money arrives.
Say a contractor books strong profit on several jobs. Invoices sit unpaid, retainage builds, and estimated costs to complete prove optimistic. The statement says the business is thriving. The bank account says it needs the credit line.
Earnings quality means how well reported earnings reflect repeatable, cash backed performance. High quality earnings come from core work, convert into cash inside the normal operating cycle, and don't depend on one time gains or generous estimates.
Three terms make the test practical:
- Accruals: Timing entries for revenue and costs recorded before cash moves, including unpaid invoices, unbilled work, inventory, and estimated job costs.
- Operating cash flow: Often called CFO, this is cash generated by operations after customers pay and the business pays employees, suppliers, and other operating costs.
- Persistence: How much of this year's profit is likely to show up again next year.
Accruals aren't wrong. They're necessary. A growing distributor must buy inventory before it sells it, and a contractor must recognize work before final payment. The problem starts when accruals grow faster than cash for reasons nobody can name.
Lenders, buyers, and bonding partners already test private companies this way. They don't stop at asking whether profit rose. They ask where it came from, how quickly it collects, and whether it survives normal owner pay and the loss of a major customer.
Use the scorecard first. Then inspect the accounts behind it, normalize the add backs, test profit by job and client, and carry only repeatable earnings into your forecast and exit value.
Seven Indicators and Their Red Flags
Start with direction, not perfection. These thresholds are practitioner rules of thumb, not audit standards. A trend over three to five years matters more than one unusual year.
Earnings Quality Scorecard Formulas and Thresholds
| Indicator | Formula | Healthy signal | Red flag |
|---|---|---|---|
| Cash conversion | CFO / net income | At or above 1.0 over three to five years | Below 0.8 for two or more years |
| Accrual ratio | (Net income – CFO) / average total assets | Near zero or negative | Above 10% and rising |
| Days sales outstanding | (Accounts receivable / revenue) x 365 | Within 5 days of stated terms | Up 10 or more days with no change in terms |
| Add backs | Non recurring add backs / adjusted EBITDA | Under 10%, each documented | Above 10%, or the same item recurs |
| Top client concentration | Largest client's share of revenue or gross profit | Under 15% | Above 25%, or one client drives most growth |
| Forecast error | Absolute value of (actual – forecast) / forecast | Under 10% per month | Above 20% in three or more months |
| Job margin variance | Actual gross margin minus bid margin | Within 2 points of bid | Overruns of 5 or more points across several jobs |
A healthy result usually shows CFO at or above net income in most periods. When there's a gap, you should name the working capital movement that caused it. "Growth" isn't an explanation. Receivables, inventory, contract assets, deposits, and payables are explanations.
The accrual ratio makes that gap comparable across years. Say net income is $1.5M, CFO is $1.7M, and average total assets are $12M. The calculation is (1.5 – 1.7) / 12 = -1.7%. The negative result means cash supports the reported profit.
Don't celebrate too quickly. A cash to profit ratio above 1.0 isn't automatically high quality. If that $1.7M of CFO came from stretching payables by 18 days, you've shifted timing, not improved operations. The cash will leave when suppliers demand normal terms.
For every flag, ask three questions. Is the gap repeatable? Will it reverse? What specifically caused it?
Weak reporting carries a real cost when corrections arrive. In a study of 719 publicly traded companies that announced earnings restatements between 1997 and 2004, 97 auditor attributed restatements produced an average negative return of 10.4%, while 357 management attributed restatements produced an average negative return of 4.9%. Your company may not trade publicly, but the same loss of confidence affects lending terms, bonding capacity, and buyer price.
Owners who want an outside view can compare this scorecard with earnings reviews for service business owners and then strengthen the review process through a disciplined internal controls assessment. The goal isn't bureaucracy. It's making sure billing, approvals, estimates, and period end entries support the number you're using.
Recurring Items Hiding Behind One-Time Labels
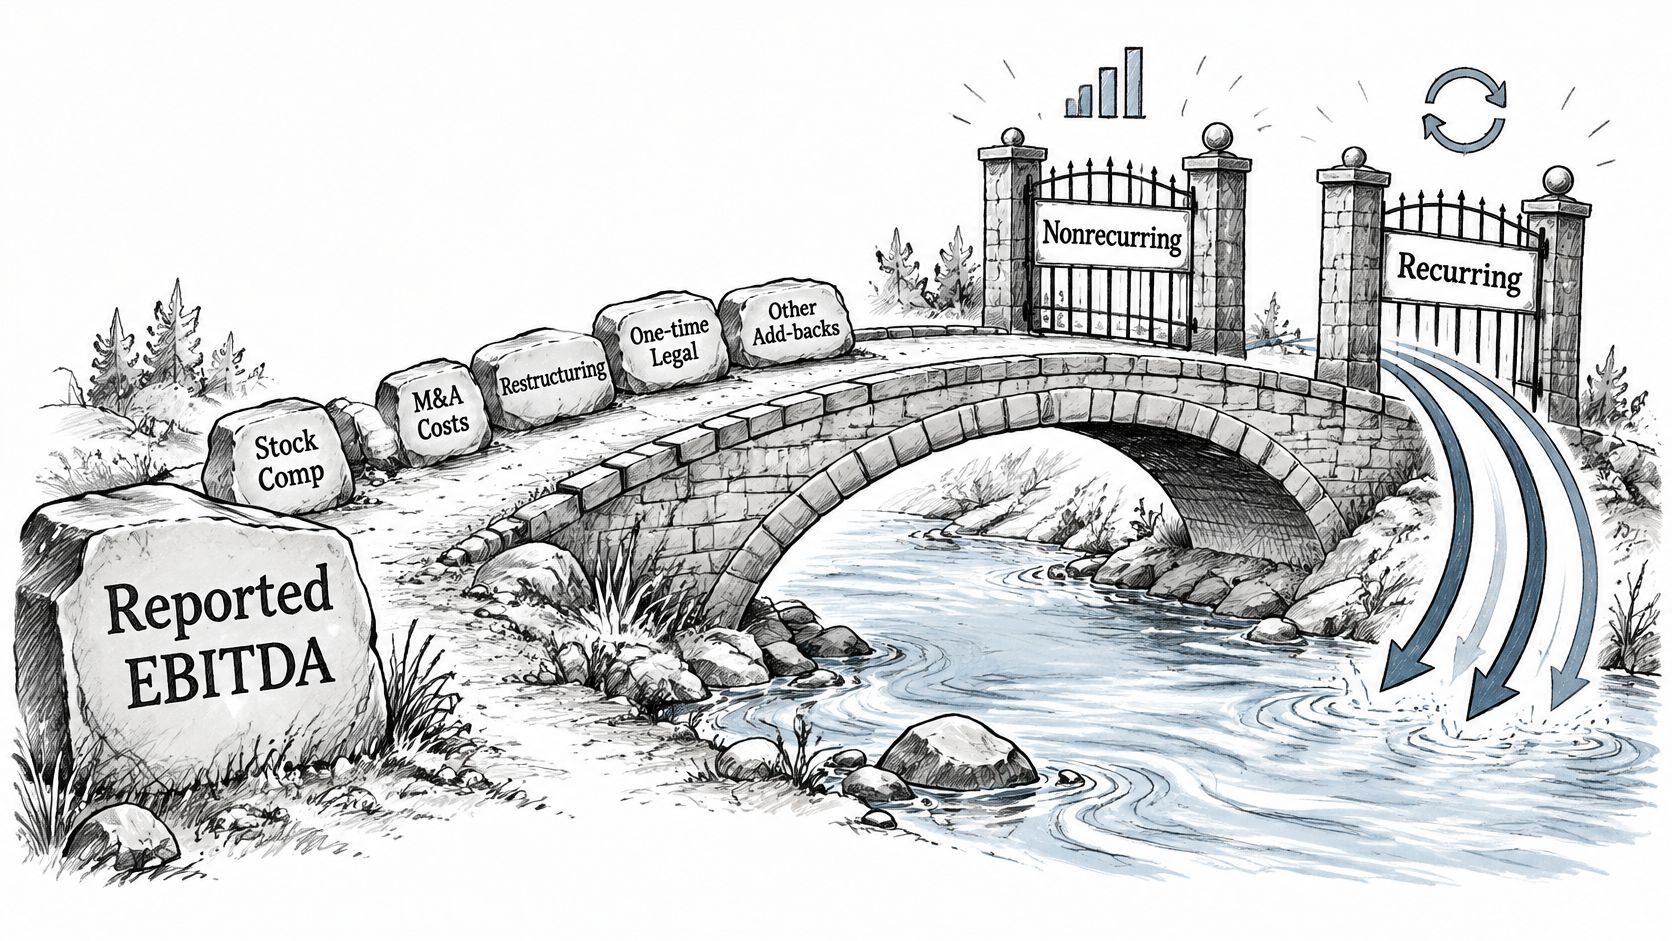
Your adjusted EBITDA is only credible if the add backs are credible. Build a normalized earnings bridge that starts with reported EBITDA, lists every adjustment, and classifies each item as genuinely nonrecurring or part of running the business.
The usual suspects wear one time labels for years:
- Repeated restructuring: Severance, system changes, and facility moves that keep returning under new project names.
- Owner related costs: Vehicles, family payroll, club expenses, and compensation above or below a replacement salary.
- Operating claims: Warranty work, customer concessions, litigation, and settlement costs tied to normal delivery risk.
- Growth costs: Acquisition expenses, recruiting, and "extraordinary" bonuses paid every year.
Apply a hard rule. An item appearing in three of the last four years is recurring until proven otherwise. The label doesn't control. Frequency does.
A Worked Bridge You Can Copy
Say reported EBITDA is $1.6M and management adds back $400K, producing adjusted EBITDA of $2.0M. Add backs equal 20% of that adjusted figure, so the bridge needs scrutiny.
Inside the $400K, legal settlements account for $180K and occurred in 2022, 2023 and 2025. Those aren't one time under the frequency test. Move them back into ongoing cost. Normalized EBITDA becomes $1.82M. The remaining $220K of add backs is now about 12% of normalized EBITDA.
That one classification changes the conversation. Don't defend $2.0M to a lender or buyer if $180K of it depends on pretending a recurring legal cost won't happen again. Defend $1.82M, document the remaining adjustments, and explain what you've changed to reduce future claims.
A Columbia Business School earnings quality paper describes high quality earnings through sustainability, predictability, absence of one time items, and support from actual cash flows. That's why normalization can't stand alone. It must sit beside persistence, concentration, and forecast tests.
For every add back, write down four answers:
- Documentation: Which invoice, agreement, payroll record, or settlement proves the amount?
- Timing: When did the cost occur, and does it belong in this period?
- Frequency: In which prior years did the same economic cost appear?
- Beneficiary: Who benefits from the spending, the company, the owner, or a departing owner?
Practical rule: If you can't document it, date it, and prove it won't recur, don't add it back.
This discipline improves more than credibility. It shows you which costs management must reduce, price into bids, insure against, or eliminate before a sale. A recurring "one time" warranty cost is a pricing and quality problem. A repeated legal cost may point to weak contracts. The bridge turns accounting cleanup into operating decisions.
Revenue Timing and Accruals in Plain Terms
Revenue recognition is the moment revenue enters the books. That moment may differ from billing and collection. Construction often records revenue as work is completed, distribution commonly records it at shipment, and professional services record it as time is delivered.
Those rules create balance sheet accounts that carry timing. Read them together with profit, not after a cash problem appears.
Balance Sheet Accounts That Carry Earnings Timing
| Account | What it represents | Rising balance may mean | Test to run |
|---|---|---|---|
| Accounts receivable | Revenue billed but not yet collected | Customers paying slower or revenue booked early | Age invoices past 60 days and confirm balances with customers |
| Contract assets (underbillings) | Work performed but not yet billed | Estimates running ahead of billing or unbilled change orders | Compare percentage complete to billings job by job |
| Billings in excess (overbillings) | Cash billed ahead of work performed | Cash pulled forward; profit may be recognized early if this shrinks while profit rises | Confirm the work schedule supports the billings |
| Retainage receivable | Portion of contract value (commonly 5-10%) held until closeout | Closed jobs not being finalized or paid | Test release dates and closeout status |
| Inventory | Materials and goods purchased but not sold | Slowing turns, rising obsolescence exposure | Count a sample and test the reserve for slow moving stock |
| Accounts payable | Bills owed to suppliers | Payment days stretched past terms to lift operating cash flow | Compare payable days to supplier terms |
| Deferred revenue and customer deposits | Cash received before the work is delivered | Spikes near period end that flatter cash flow | Confirm revenue release follows delivery |
The evidence behind this test is clear. In Richard Sloan's 1996 study drawing on 40,679 firm year observations covering publicly traded U.S. companies from 1962 through 1991, earnings supported by operating cash flow continued into the following year more often than earnings generated primarily through accruals, and high accrual firms later earned lower stock returns.
That doesn't make every accrual suspect. Legitimate growth consumes cash, especially when a contractor staffs new work or a distributor stocks a larger warehouse. The decisive test is reversal. Does the balance convert into cash within the normal operating cycle?
Say contract assets rise while billings stay flat. Estimates may be running ahead of invoicing, or crews may be performing change orders without signed approval. Compare percentage complete with billings job by job, then restrict revenue on unsigned work until the customer approves it.
A practical guide to converting accrual results to cash can help your team trace those timing differences into expected receipts and payments. Use that schedule weekly. Once you know which balances will collect and when, you can decide whether reported growth deserves more labor, inventory, and debt, or tighter billing discipline first.
How to Run an Earnings Quality Review Step by Step
You can finish a useful first review in one week with your own statements. Don't wait for a transaction to force the work.
The process below gives you the sequence at a glance.
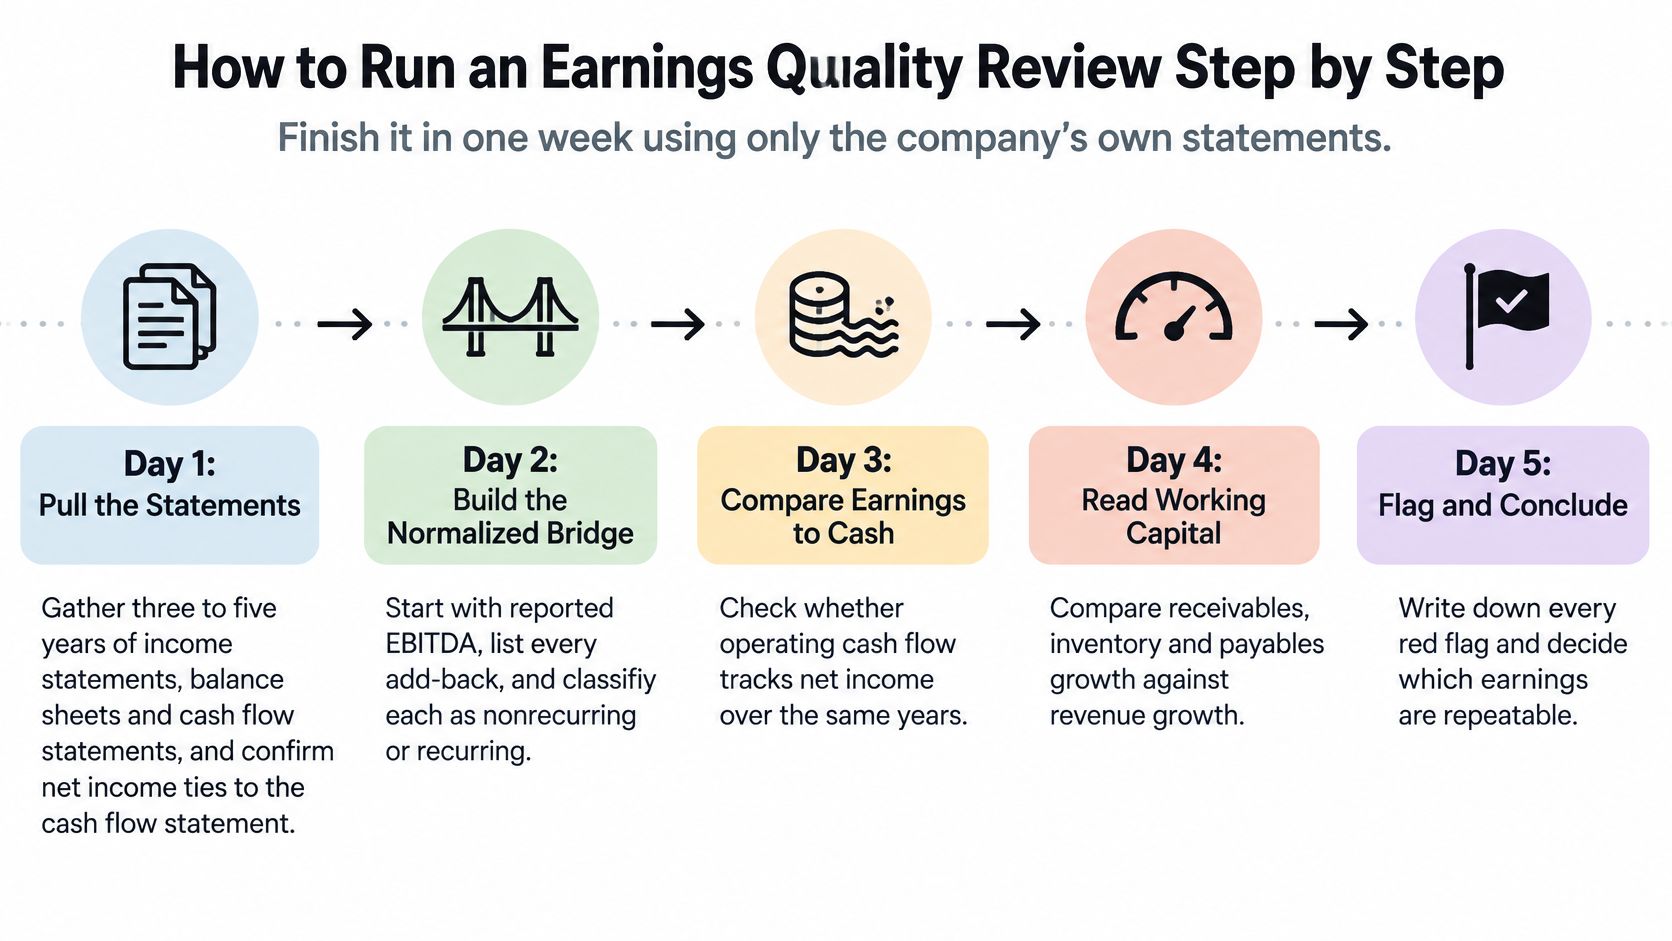
- Pull three to five years of statements. Gather income statements, balance sheets, and cash flow statements because net income must tie to the cash flow statement before any ratio means anything.
- Calculate cash conversion and the accrual ratio each year. Direction exposes whether profit quality is improving or slowly weakening.
- Build the normalized earnings bridge. List every add back with documentation and frequency so recurring costs return to operating earnings.
- Decompose working capital. Compare receivables, contract assets, retainage, inventory, payables, deposits, and deferred revenue against revenue growth to find balances moving too fast.
- Measure concentration. Rank clients, jobs, and service lines by revenue and gross profit because a stable company total can hide fragile sources.
- Test eight quarters of forecasts. Compare budget with actual and calculate forecast error so you know whether management can predict the business it runs.
- Sample the transactions behind divergences. Pull 20 to 25 invoices, job cost reports, customer approvals, and vendor accruals around period end to verify cutoff and support.
- Classify each profit stream. Mark it repeatable, timing, or at risk, then assign an owner and action to every timing or at risk item.
- Write a one page verdict. State the adjusted EBITDA you'd defend to a lender, the evidence behind it, and the decisions that change because of it.
The mechanics matter. An earnings persistence paper hosted by the University of Amsterdam frames the simple split as Accruals = Net Income – CFO. Use that split over multiple periods, then investigate material changes account by account instead of debating one annual gap.
Ratios show direction. Decomposition shows cause. Transaction tests show whether the cause is real. For example, rising profit with falling CFO may lead you to receivables, then to extended terms for two customers, then to invoices that lack acceptance documents. Now you have an action, not an opinion.
Watch this walkthrough after you've gathered the statements, then pause it as you complete each test with your own numbers.
Reconcile all three statements. The cash flow statement is a recurring source of corrections, so treat it as a control over reported profit, not an afterthought. By Friday, you should know which earnings fund growth, which earnings reverse, and which earnings need evidence before you rely on them.
Job and Client Margins That Reveal Fragile Profit
Company level profit can hide a bad portfolio. One strong job may subsidize weak estimating, rework, or slow paying clients elsewhere. Normalize margin at the level where managers make decisions.
Use this formula:
Normalized job margin = (reported gross profit – unbilled change orders – rework – unrecovered overtime – warranty reserves) / revenue
Illustrative Job Margins Reported Versus Normalized
| Job | Revenue | Reported gross margin | Normalized gross margin | Cash collected to date |
|---|---|---|---|---|
| Job A, warehouse fit out | $1.20M | 28% | 24% | 85% |
| Job B, distribution racking | $0.80M | 26% | 12% | 40% |
| Job C, professional services retainer | $0.60M | 31% | 30% | 95% |
Job A loses 4 points because about $48,000 of change orders remain unbilled on $1.2M of revenue. The work may still be good, but management shouldn't price the next warehouse fit out from 28% until those changes are approved and billed.
Job B is the warning. Reported gross profit is about $208,000 at 26% of $800,000. Rework and unrecovered overtime of roughly $112,000 reduce normalized gross profit to about $96,000, or 12%. Only 40% of billing has been collected. That isn't a slightly disappointing job. It's a margin problem and a cash problem sharing the same cause.
Job C holds up. It moves from 31% to 30% and has collected 95%, so its gross profit is both measurable and funded. That's the kind of work that earns more sales attention and estimator time.
A disciplined job costing system gives you actual labor, material, equipment, rework, and change order status while there's still time to act. Review it weekly on active work and monthly by client. Don't let accounting close become the first honest job meeting.
Distribution and service firms should also charge slow paying clients for the capital they consume. Holding $1M of billings an extra 30 days at an 8% cost of capital costs about $6,600 a year. Add that financing cost to the client view. Some apparently profitable accounts stop looking attractive.
Then decide. Reprice Job B type work, require deposits, cap unsigned change orders, tighten overtime approval, or stop pursuing it. Move scarce estimators and project managers toward Job C economics. Earnings quality improves when the portfolio changes, not when the spreadsheet gets prettier.
Forecasting and Exit Value Depend on Repeatable Earnings
Build your forecast from repeatable earnings only. Start with recurring revenue, contracted backlog converting at historical rates, proven job margins, and working capital patterns the business has actually sustained.
Treat stretched payables, one off deposits, inventory liquidation, and delayed vendor accruals as one time cash, not permanent inflows. Feed only repeatable collections into your 13 week cash forecast. Otherwise, you'll hire against cash that reverses next month.
Track forecast error by driver. Separate volume, price, labor efficiency, and overhead variances. A miss caused by weak volume needs a sales response. A miss caused by labor productivity needs scheduling, training, or estimating changes. One blended variance hides the fix.
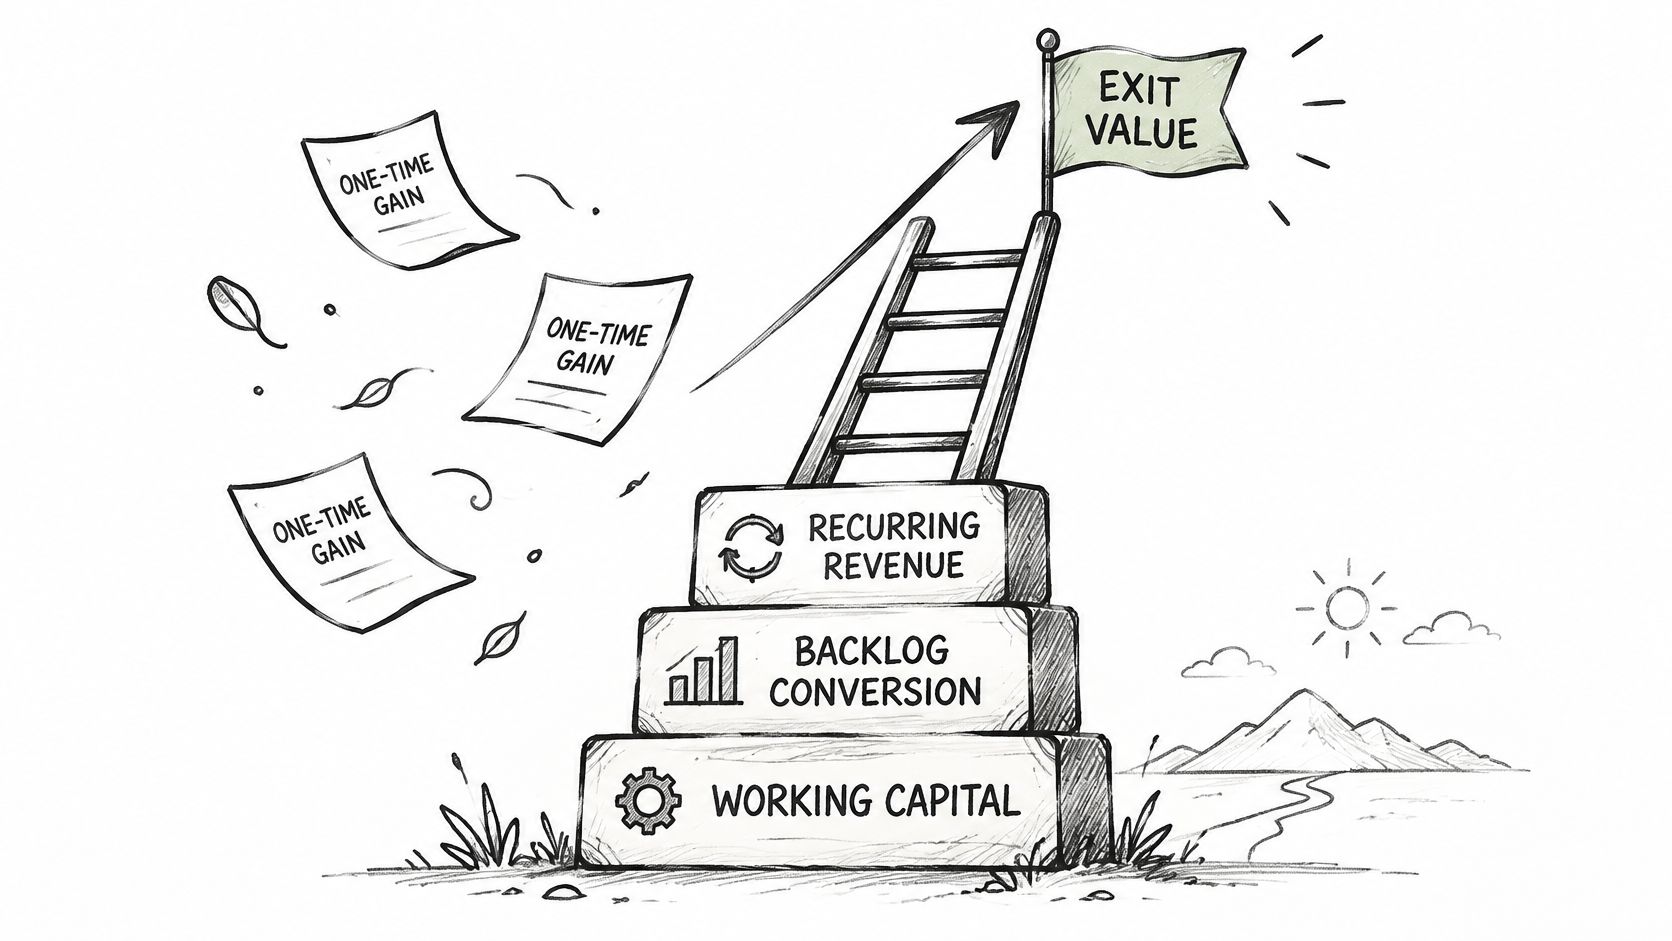
Exit planning uses the same evidence, but asks a harder question: Which profit transfers to a buyer?
Say a company reports $20M in revenue and $3.0M in adjusted EBITDA. One client provides 22% of revenue, or $4.4M, at a 25% contribution margin. That relationship contributes about $1.1M before overhead considerations. A buyer will stress test what happens if it leaves, renews at lower volume, or depends personally on the owner.
Next, test pricing. A 3% reset on the remaining $15.6M of revenue equals about $468,000. If costs don't fall with price, the buyer won't underwrite the full $3.0M just because it appeared last year.
Then normalize owner pay. If the owner receives $600,000 and a replacement leader costs $350,000, the adjustment adds $250,000. That can raise transferable EBITDA, but only if the replacement can actually perform the owner's sales, estimating, and client roles.
The broader cash context explains why buyers stay strict. A 2025 Ledger Enquirer report on small business survey evidence found that 43% of small businesses viewed cash flow as a problem, and 74% said their cash flow challenges had stayed the same or worsened over the prior year. Buyers reward earnings that don't need optimistic collection or pricing assumptions to survive.
Understanding what value drivers buyers underwrite helps you fix weak spots early. Reduce concentration, document renewals, convert backlog at normalized margins, and prove growth doesn't consume unlimited working capital.
Only profit that survives customer loss, pricing pressure, and management transition is transferable value.
That's the standard for your forecast and your exit number. Anything else belongs in an upside case, not the base case.
Confirm Your Earnings Before Your Next Big Decision
Produce three outputs this week:
- Seven indicator scorecard: Calculate it for the last three years and name the cause behind every flag.
- Normalized EBITDA bridge: Classify every add back as nonrecurring or recurring, with documentation and frequency.
- Job or client margin view: Recalculate margin after unbilled work, rework, unrecovered overtime, warranty exposure, and slow payment cost.
A clean result shows cash conversion near or above 1.0 with named causes, add backs under 10%, and no client above 25% of revenue without a reduction plan.
AmbitionCFO embeds with owners and leadership to build 13 week cash flow models, margin analysis by job or client, KPI dashboards, and forecasts. The firm also works with owners three to ten years from transition on exit planning led by John Myklusch, CPA, CEPA. It doesn't provide bookkeeping, tax preparation, audit, or valuation, so pair the operating review with your CPA's statements and a formal financial due diligence review when a transaction is close.
Visit the firm online and book a review of your scorecard, bridge, and margin view before you commit capital or set a price.
AmbitionCFO helps founder led companies turn reported profit into a defensible plan through cash flow modeling, job and client margin analysis, KPI reporting, forecasts, and exit planning. Bring your three earnings quality outputs, identify which profit is repeatable, and decide what to fix before your next hire, contract, equipment purchase, or transition. Start by visiting AmbitionCFO and booking a review.