

A cost model is the repeatable mechanism that turns labor, materials, equipment, and overhead assumptions into cost, while the estimate is the number that comes out after those inputs are applied.
If your spreadsheet says a contract is profitable, can you also tell whether you'll have enough cash to finish it? That's the gap between knowing an estimated margin and having a model you can use to make a commitment.
Table of Contents
- What a Cost Model Decides Before You Spend
- The Fixed and Variable Cost Formula
- Activity-Based Job and Standard Costing
- How to Build a Cost Model You Can Trust
- Cost Model Examples for Three Industries
- When Cost Swings Should Trigger a Reforecast
- Run One Decision Through the Model This Week
What a Cost Model Decides Before You Spend
Will this bid, hire, truck, or new client still make money after the costs that change? Say you're considering a larger construction contract. The selling price looks attractive, but the decision depends on crew hours, wage rates, equipment availability, and when the customer will pay.
A cost model is a structured picture of how resources become the cost of a product, service, project, or program. It connects labor, materials, equipment, overhead, and other inputs through assumptions and formulas. The Department of Defense cost-estimating guidance distinguishes the analytical model from the resulting estimate and describes the GAO approach of using historical information and quantitative methods to predict future costs.
Move from reporting to testing
Think of historical reporting as a thermometer: it tells you what happened. A useful model is more like testing a thermostat setting before changing the room's temperature. You change an assumption and examine the result before committing resources.
The decision map keeps that purpose visible.
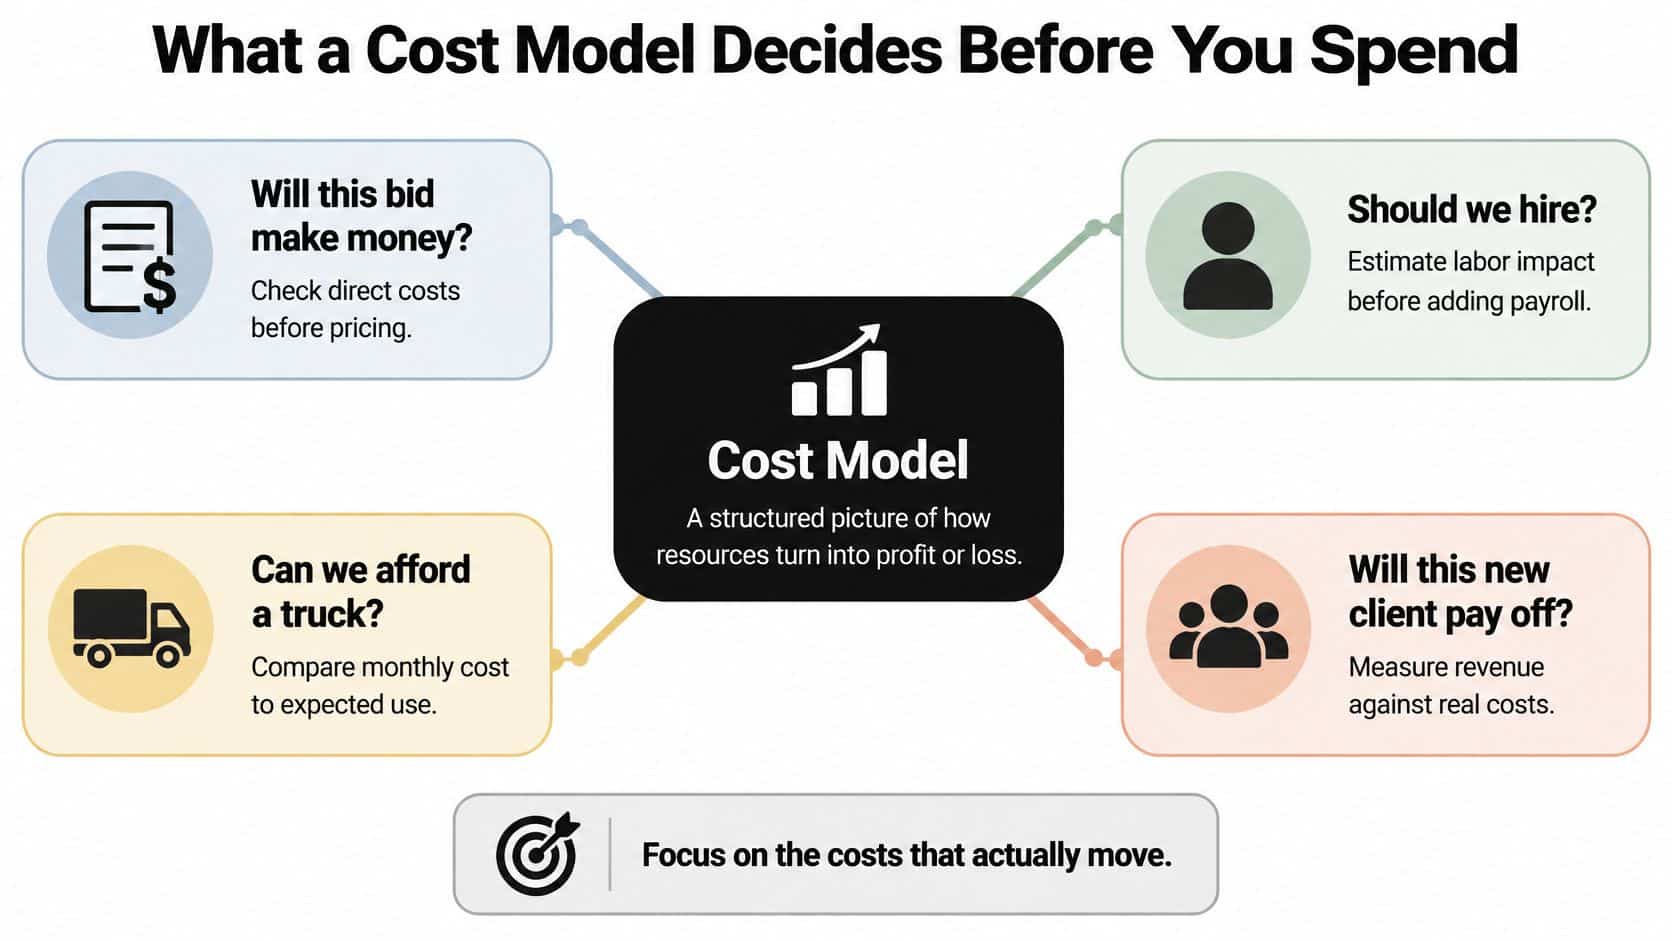
An owner can test several practical questions:
- Construction labor: Does the bid meet your margin target if wage rates increase?
- Distribution freight: Can the account absorb a carrier increase, or should delivery terms change?
- Professional-services staffing: Will another professional generate enough billable contribution to justify payroll?
These tests require you to separate costs that stay fixed from costs that move with activity. Otherwise, you can't tell whether additional work improves profitability or only creates more expense.
Decision rule: Model the costs your decision changes, but keep the full cost structure visible.
You don't need an elaborate forecasting platform to begin. A worksheet with documented drivers can support a better decision than a polished spreadsheet built around an unexplained overhead percentage. Start with the cost relationship, choose the appropriate costing method, and use it on a live commitment.
The Fixed and Variable Cost Formula
Start by separating fixed costs from variable costs. Profit doesn't necessarily change in the same proportion as sales because some expenses remain in place while others rise with activity.
The Food and Agriculture Organization's cost guidance distinguishes costs that change with output from costs that remain fixed during the relevant period. The hypothetical worksheet below applies that relationship using $120,000 in monthly fixed overhead and $60 in variable cost per unit.
Total cost = Fixed cost + (Variable cost per unit × Output)
Unit cost = (Fixed cost ÷ Output) + Variable cost per unit
Build the simplest useful worksheet
Enter monthly fixed overhead, variable cost per unit, and expected volume. Keep the unit consistent: it might be a product, delivery, service visit, or another measurable output.
Unit cost at two volumes
| Volume | Fixed cost | Variable cost per unit | Total cost | Unit cost |
|---|---|---|---|---|
| 4,000 units | $120,000 | $60 | $360,000 | $90 |
| 5,000 units | $120,000 | $60 | $420,000 | $84 |
Producing more units increases total spending, but it reduces the fixed-cost share attached to each unit. That's why a lower unit cost doesn't automatically mean you need less cash.
The calculation also assumes you can deliver the additional output with existing capacity. If higher volume requires another supervisor, warehouse, or machine, add that capacity change explicitly. Don't keep spreading the original overhead across work your current operation can't perform.
Classify the ledger before adding complexity
Review each general-ledger account and assign a cost behavior:
- Fixed: Rent, salaried management, insurance, and many software contracts remain largely unchanged within the planning period and capacity range.
- Variable: Materials, sales commissions, and activity-linked freight change with the work performed.
- Mixed: A vehicle arrangement might include a fixed lease payment plus mileage-related fuel and maintenance.
Write the operating assumption beside every classification. For freight, identify whether shipments, weight, distance, or another driver explains spending. For labor, distinguish guaranteed payroll from hours you can adjust.
Our explanation of fixed versus variable costs can help you make those classifications. For manufacturing operations, you can also explore machining cost components through Uptool to identify the production inputs that belong in the worksheet.
Avoid expressing every expense as a percentage of revenue. A selling-price increase doesn't necessarily raise rent, and a sales decline doesn't automatically reduce management salaries.
Keep classification separate from allocation. Whether a cost changes with output is a different question from which job or customer should carry it. Your costing method determines how those costs enter the model.
Activity-Based Job and Standard Costing
| Method | Use it when | Cost object | Main output | Watch-out |
|---|---|---|---|---|
| Activity-based costing | Customers or jobs consume overhead differently | Customer, product, or job | Activity rate times driver use | Modeling every small activity |
| Job costing | Each contract has its own scope and timeline | Job or project | Budget, committed cost, actual, forecast final | Margin that ignores indirect project cost |
| Standard costing | Units repeat and expected cost is knowable | Unit or batch | Price and quantity variances | Standards left stale when inputs swing |
Choose job costing for unique contracts, activity-based costing for uneven resource consumption, and standard costing for repeatable units. The cost object is what you're measuring: a customer, project, product, or batch.
When overhead needs a better explanation
Activity-based costing rests on a straightforward relationship: products and services require activities, and those activities consume resources. Washington State University's accounting explanation.pdf) describes assigning expenses to activity pools, then allocating those pools using measurable cost drivers.
Consider a hypothetical distributor with $100,000 of monthly purchasing overhead across 100 purchase orders. The activity rate is $1,000 per order: a customer generating 80 orders receives $80,000 of allocated purchasing cost, while a customer generating 20 orders receives $20,000.
If those customers generate the same gross margin before purchasing overhead, the order-intensive customer leaves less profit after allocation. Revenue alone wouldn't show that difference.
To implement the method, group related expenses into activity pools, choose a driver for each pool, and multiply its rate by actual usage. Start with the largest overhead pools rather than recording every minor administrative task.
Before using the result to reprice an account, check whether the driver reasonably reflects effort. A routine replenishment order and a complex custom order may require different treatment.
When work is unique or repeatable
Job costing follows a distinct scope through its delivery lifecycle. Assign direct labor, materials, and equipment to the project, then include appropriate indirect engineering, fees, and contingencies. Our job-costing guide explains how to organize that project view.
Standard costing takes a different approach. Set an expected material, labor, and overhead cost per unit, then compare actual results against the standard. The overview of standard cost accounting explains this use of variances, the differences between expected and actual costs.
Investigate whether a variance came from price, quantity, productivity, or an outdated assumption. Don't treat every unfavorable result as an employee-performance problem.
You can combine these methods. A project business might track each contract through job costing, allocate purchasing support by activity, and use standard labor expectations for repeatable tasks. Choose the combination that explains the decision without creating unnecessary maintenance.
How to Build a Cost Model You Can Trust
Build the first version around a decision you need to make. A worksheet becomes useful when someone can explain where its assumptions came from and what would change the answer.
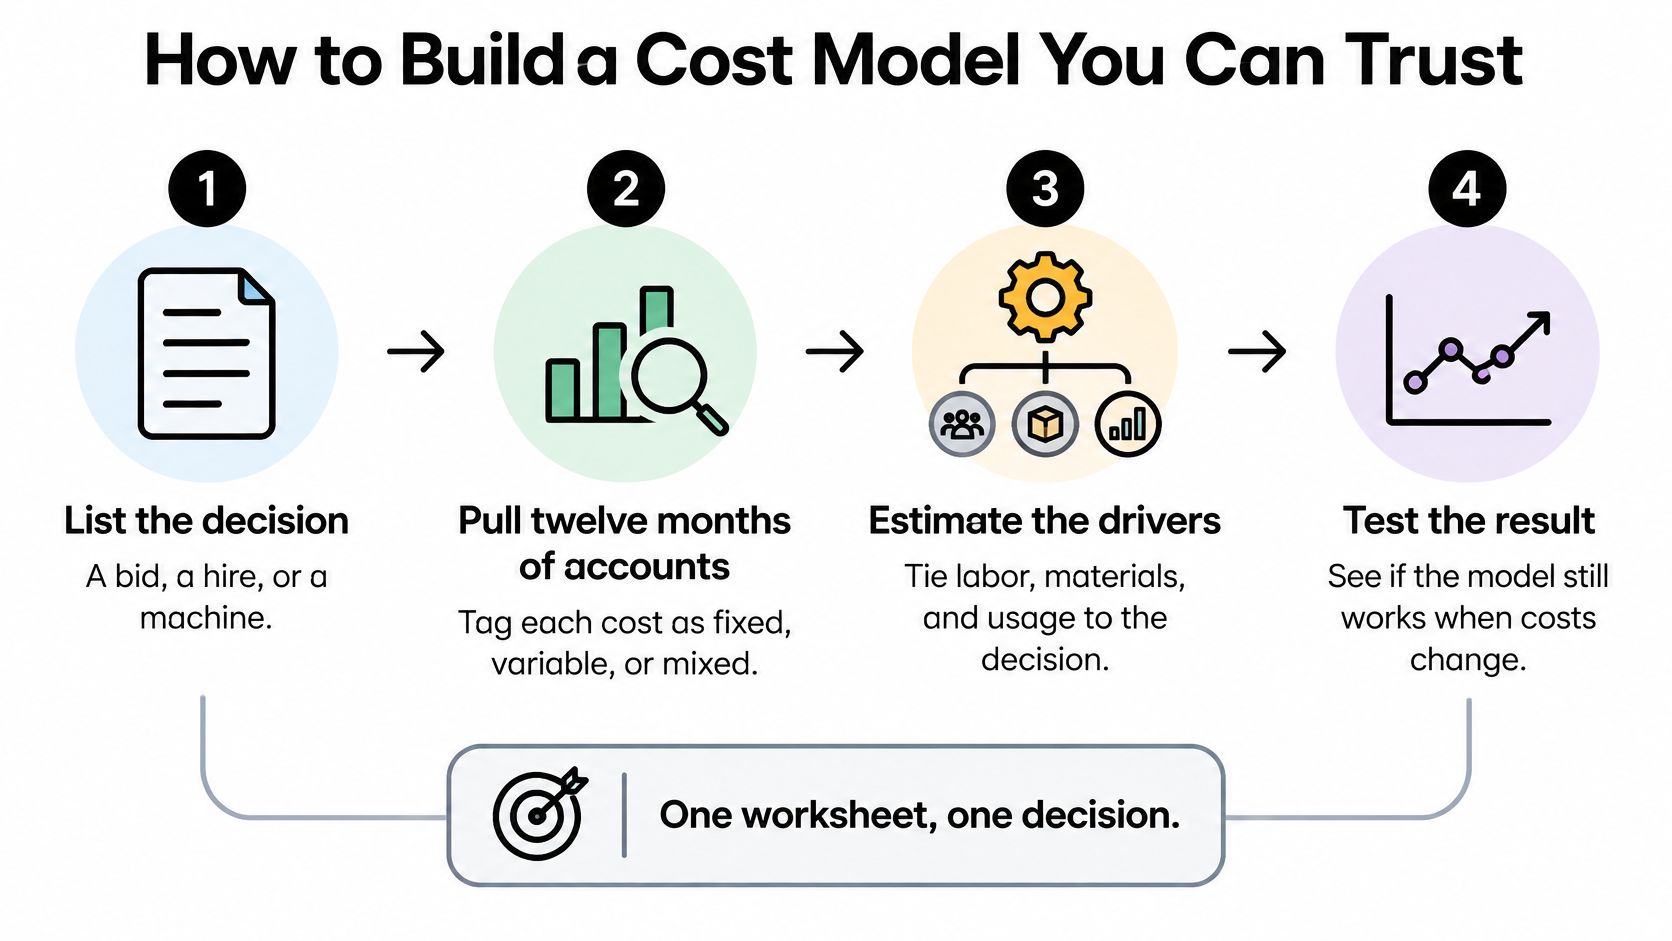
Use this process map to keep the build focused.
Assemble the inputs and separate the timing
List the decision. Name the bid, hire, or machine and the condition for approval. Specify your margin target before adjusting assumptions.
Pull twelve months of accounts. Tag expenses as fixed, variable, or mixed. Remove unusual items only when you can explain why they won't recur.
Name the operating drivers. Use hours, units, orders, miles, or billing milestones. Give each important assumption an owner who can verify it.
Load direct costs first. Then add the largest overhead pools. Reconcile the starting totals to your accounting records so missing expenses don't become apparent profit.
Separate cash timing from expense. Record when you pay employees and vendors, when you invoice, and when customers are expected to pay. Include construction retainage rather than assuming the full invoice becomes available cash.
Keep profit and cash in separate schedules connected to the same operational assumptions. An expense belongs to the period when the work consumes the resource; the related payment may occur earlier or later.
Calculate the decision threshold
- Compute contribution margin and break-even. The U.S. Small Business Administration defines break-even as revenue equaling total cost; applying its formula to the hypothetical case below, with $120,000 fixed costs and $90 variable cost per unit, shows how a price concession changes the required volume.
Break-even when price drops
| Selling price | Contribution margin | Break-even units | Result at 2,500 units | Volume cushion |
|---|---|---|---|---|
| $150 | $60 | 2,000 | $30,000 profit | 500 units |
| $135 | $45 | 2,667 | $7,500 loss | 167-unit shortfall |
Contribution margin is selling price minus variable cost per unit. Divide fixed costs by that contribution to calculate break-even units, rounding up to a whole unit.
The discounted case requires about 33.4% more break-even volume, as calculated from these worksheet assumptions. A concession that looks modest at the sales line can therefore change an acceptable contract into a loss.
Add a safety margin. Subtract break-even units from expected units. Treat a negative result as a shortfall, not a cushion.
Run base, downside, and upside cases. Change plausible combinations of volume, productivity, cost, and collection timing before signing.
Don't approve a commitment merely because the base case works. Identify what you'll do if the downside case occurs.
At AmbitionCFO, we help owners evaluate adding crews, hiring project managers, taking larger projects, and buying or leasing equipment before committing resources. We assess major choices against a specific margin target and long-term value creation goal.
For a broader workbook structure, use our guide to building financial models. Keep these columns visible: fixed cost, price, variable cost, contribution margin, break-even units, expected units, and profit.
This video provides an additional learning resource.
Cost Model Examples for Three Industries
Construction and the missing project costs
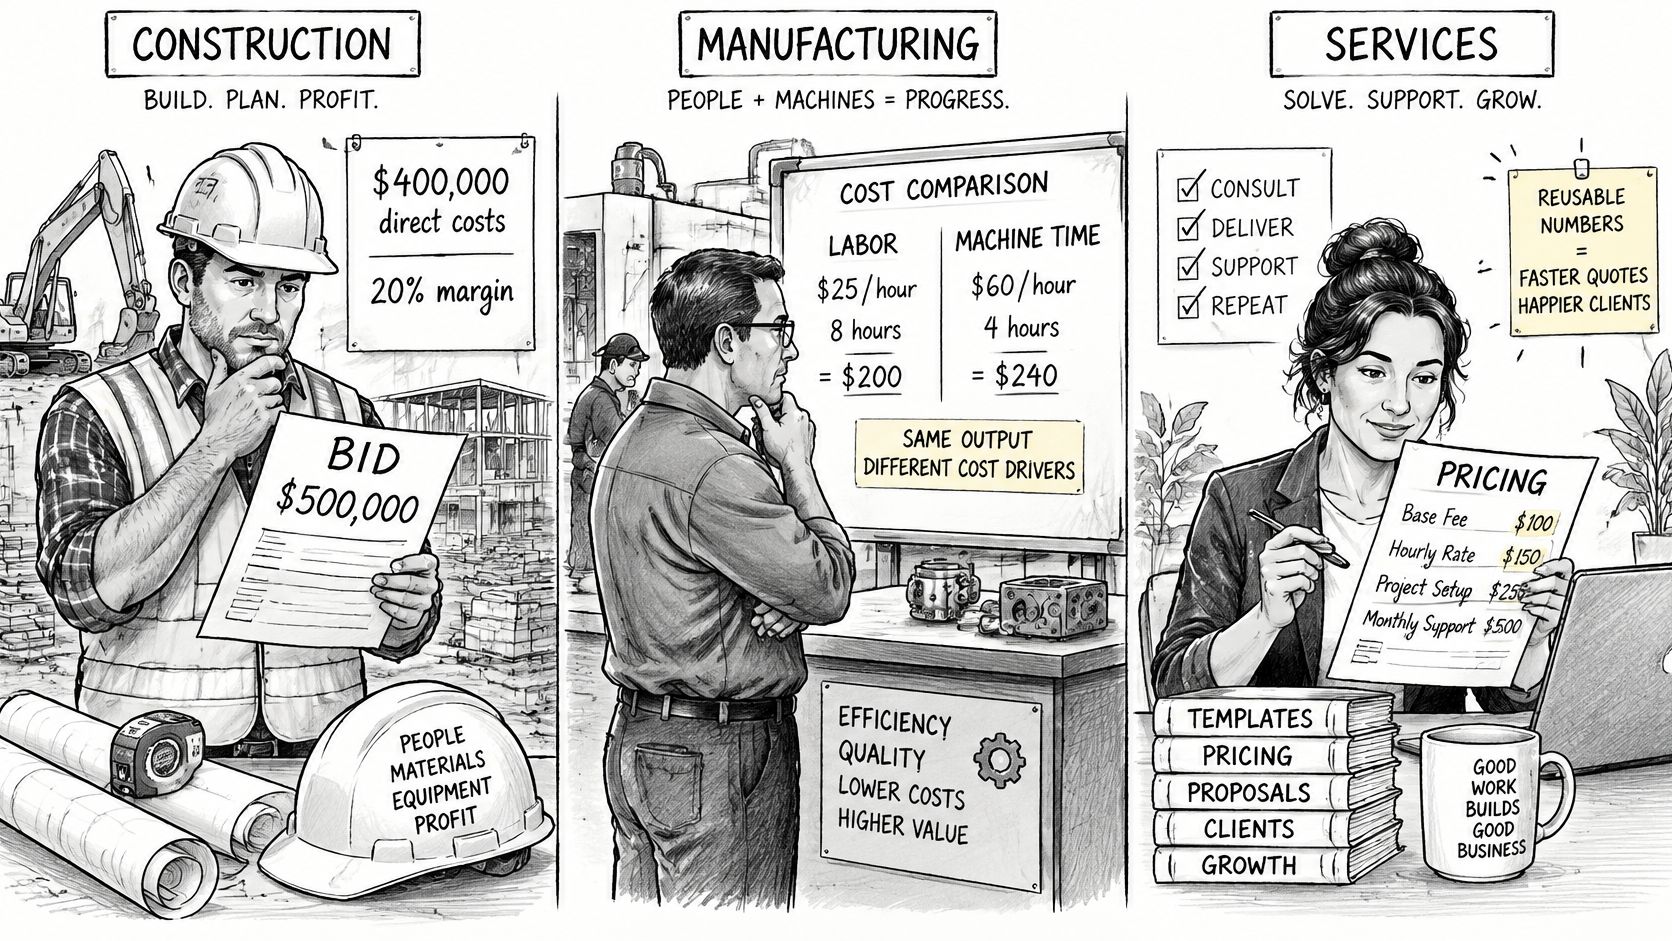
Say a contractor prices a job using only field expenses. The Associated Wall and Ceiling Industries' discussion of job costs distinguishes direct construction costs from necessary indirect expenses; in this hypothetical example, a $500,000 contract with $400,000 of direct costs appears to deliver a 20% margin, but adding $40,000 of engineering and fees reduces that margin to 12%.
The calculations are straightforward: direct-only margin is contract revenue minus direct costs, divided by revenue. The fuller calculation also deducts engineering and fees before dividing by revenue.
That difference matters when the project manager considers overtime or an unpriced scope change. Spending that appears affordable against the direct-only margin may consume the actual profit allowance.
Track budget, committed cost, actual cost, estimate to complete, and forecast final cost by category. Review the job weekly so the team can price change orders before completing extra work.
Retainage, the portion of payment withheld until contractual release conditions are met, requires separate attention. A profitable job can still need funding while the contractor waits to collect it. For construction and specialty trades, we help improve job profitability, strengthen cash flow, increase bonding capacity, and prepare for sustainable growth.
The industry comparison illustrates why the operating inputs need to match the business.
Distribution and the expensive account
A distributor's high-revenue customer may also require frequent purchasing, special deliveries, and slow-moving inventory. Apply the order-based allocation to that account, then decide whether minimum order quantities, consolidated shipments, or revised pricing would improve its economics.
Judge the customer using gross margin percentage, operating margin, inventory turns, and GMROI, not revenue rank alone. GMROI means gross margin divided by average inventory at cost. It helps you assess the margin generated by the inventory investment.
In our distribution engagements and exit-planning conversations, we track those measures alongside cash conversion cycle, working capital, EBITDA, current ratio, debt service coverage, and accounts-receivable aging. Together, they help owners distinguish profitable sales from growth that ties up cash.
Professional services and the busy client
A services client can fill the calendar while consuming excessive senior attention. Model labor cost, project delivery expenses, partner involvement, and overhead before assuming the relationship justifies another hire.
Track utilization, billable hours divided by available hours, and realization, collected fees divided by the standard value of the work. High utilization won't protect margin if substantial work is written off or never collected.
We measure client, project, and service-line profitability for professional-services firms. That allows hiring decisions to reflect delivery economics rather than workload alone.
Use the factors affecting cost as a review checklist when selecting your operating inputs. The practical outcomes differ by industry: earlier change-order pricing, fewer underpriced complex accounts, and hiring supported by utilization and margin.
When Cost Swings Should Trigger a Reforecast
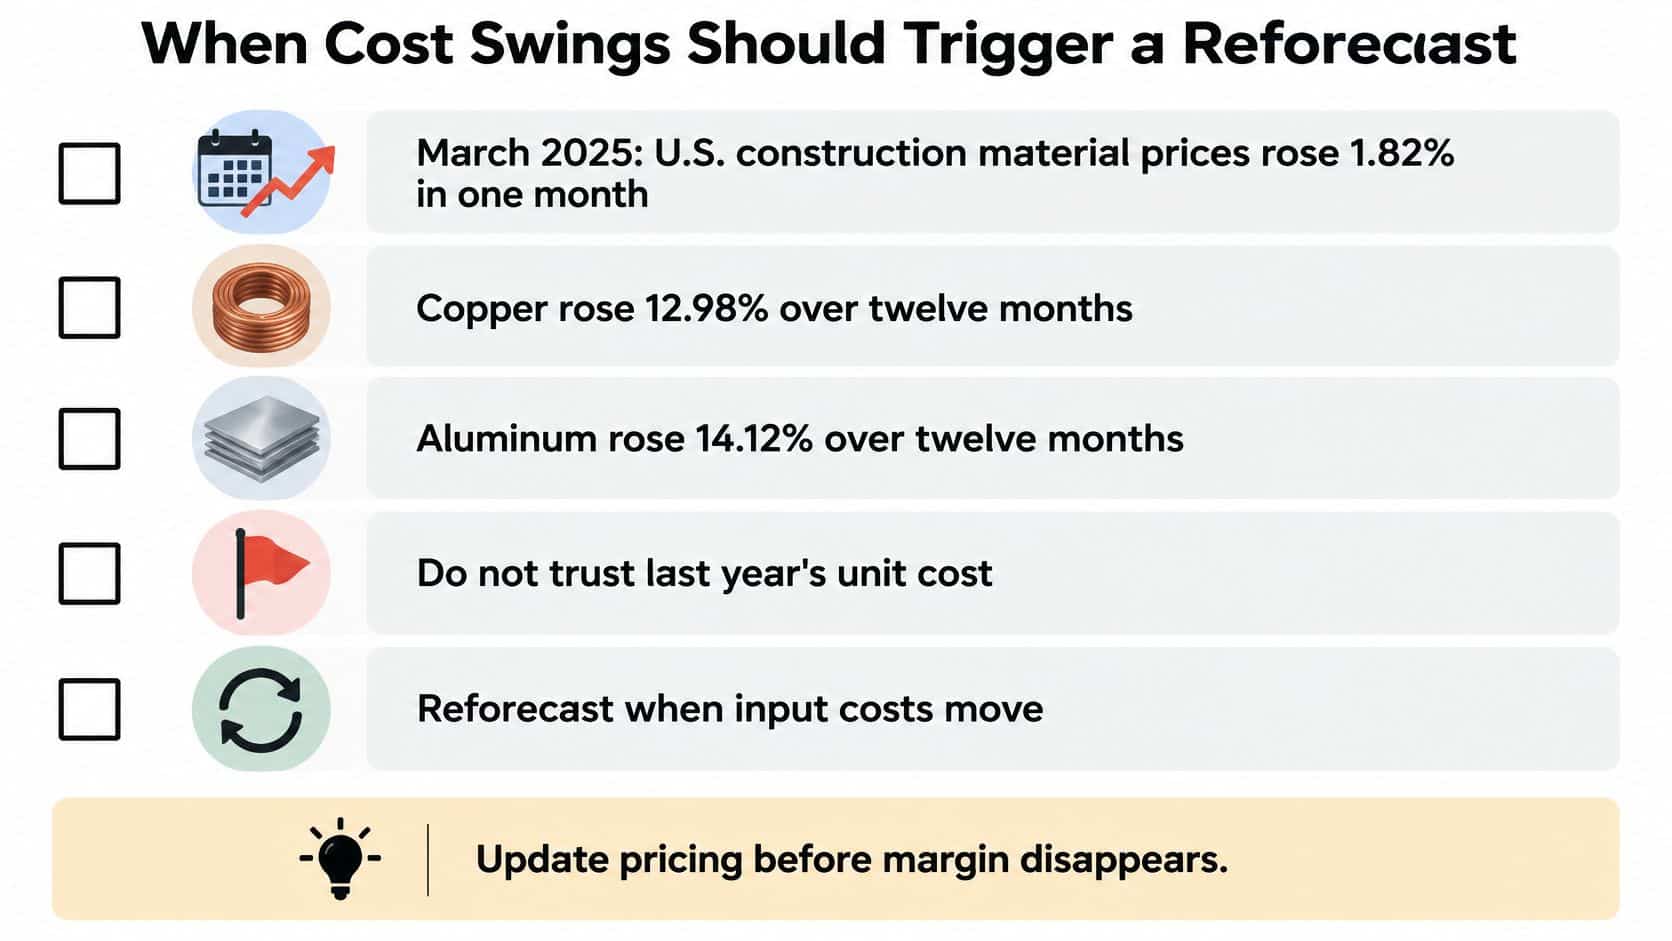
Copper rose 12.98% and aluminum 14.12% over twelve months while steel fell 5.08%, according to the AtkinsRéalis U.S. construction report. The report also records U.S. construction material prices rising 1.82% in March 2025 alone, with labor and trade-partner costs still rising by Q3 2025 even as some material categories stabilized.
A blended materials average can hide the input that determines your job's result. Last year's unit cost isn't a safe purchasing assumption because it reconciles to last year's accounts.
The checklist highlights the need to revisit exposed inputs.
Refresh when the decision changes
In PwC's 2025 survey of 678 executives and board members from Fortune 1000 and private companies, 65% of CFO respondents said their organizations were adjusting financial forecasts and budgets in response to business volatility.
You don't need to rebuild the model whenever an invoice arrives. You do need to identify the drivers that could change an approval decision and set explicit review thresholds.
Post these triggers beside the worksheet:
- A key input crosses its threshold: Refresh exposed material, freight, or labor assumptions when a quote change would breach your margin target.
- A subcontractor reprices: Update uncommitted work and determine whether the contract permits recovery.
- Backlog mix shifts: Reassess capacity and overhead recovery when incoming work requires different skills, equipment, or delivery effort.
- Collections deteriorate: Move expected receipts to realistic dates and recalculate funding needs before approving additional spending.
Use a rolling model without false precision
A monthly refresh can be too slow for tariff exposure, scarce labor, or long project cycles. A daily rebuild can be equally unhelpful if the underlying assumptions remain uncertain.
Maintain base, downside, and upside cases. Use sensitivity testing, changing an important assumption while holding others constant, to identify which input deserves management attention.
Review actual-versus-modeled results by job, client, service line, or branch. A company-wide total can conceal an overrun in one area behind favorable performance elsewhere.
Our guide to flexible budgeting explains how to adjust expected costs for actual activity. Pair that comparison with trigger-based reforecasting so you can distinguish spending caused by higher volume from spending caused by worse economics.
Run One Decision Through the Model This Week
Choose a discounted contract, planned hire, equipment purchase, or complex customer account. Put the decision on a worksheet and compare the result with your existing percentage-of-revenue markup.
Write down which assumption changes the answer most. It might be crew productivity, shipment frequency, collection timing, or billable utilization rather than the expense leadership usually debates.
Before approving: Require an acceptable margin and a workable funding plan. Neither substitutes for the other.
For a vehicle-dependent operation, identify fuel consumption and purchasing controls rather than burying them in overhead. Rally's a fuel spending guide for operations teams is a useful companion when organizing that input.
If the worksheet shows profit but a cash gap, change billing milestones, deposits, supplier terms, or commitment timing before saying yes. Pair the decision model with a 13-week cash forecast so hiring, inventory purchases, and project starts follow realistic collections.
Give the worksheet an owner
Assign someone to maintain the assumptions and record what management approves. Keep the version used for the decision so you can compare actual results with what you expected.
For founder-led businesses that need ongoing financial leadership, our forecasting work includes rolling cash forecasts, annual budgets, and scenario modeling. It complements your bookkeeper and tax advisor rather than replacing them.
Start with a manageable commitment:
- Classify this month's accounts: Document cost behavior and the driver behind each material expense.
- Run the price cases: Compare expected profit with the volume required to support it.
- Approve the bid only when both work: Put profit and cash on the same decision page.
AmbitionCFO helps owners connect cost assumptions to margin targets, cash requirements, forecasts, budgets, and KPI reporting. Bring a live hiring, pricing, or equipment decision to AmbitionCFO to discuss how fractional CFO support can turn your worksheet into a rolling decision system.