
Most owners are taught to classify every expense as either fixed or variable. That advice is useful for an exam and dangerous in a growing company. A construction business can carry labor that behaves like a variable cost on one project, then becomes fixed payroll after a hiring decision. A distribution company can treat warehouse capacity as fixed until a volume threshold forces another facility. A professional services firm can call software fixed until user-based pricing substantially raises the bill.
The question you're really trying to answer is practical: How much does the next sale, project, crew, or customer contribute to profit, and what happens to cash when volume changes? The answer requires more than a tidy chart of accounts. You need a model that captures operating leverage, step changes, repricing risk, and the decisions that change your cost base.
Table of Contents
- The Myth of the Binary Cost Structure
- How Fixed and Variable Costs Behave at Scale
- Calculating Contribution Margin and Break-Even
- Rules for Classifying Messy Real-World Expenses
- Adjusting Models for Inflation and Repricing Risk
- Strategic Moves to Optimize Your Cost Structure
- Your Action Plan for Cost Structure Modeling
The Myth of the Binary Cost Structure
Fixed costs are expenses that don't change with activity in the short term. Variable costs change directly with output. That definition remains sound, but it's incomplete for a founder-led business that's adding contracts, employees, locations, or equipment.
The common mistake is treating the classification as permanent. Owners label rent, salaries, software, and insurance “fixed,” then assume those lines will remain stable throughout the forecast. They won't. Contracts renew, headcount crosses capacity limits, software moves into a higher tier, and insurers reprice coverage.
The thresholds hidden in your P&L
A step-fixed cost stays flat within a range, then jumps when the business reaches a threshold. One warehouse can support current distribution volume. A second warehouse creates a new rent, management, utilities, and equipment commitment. One service manager can oversee a group of crews. Additional crews may require another supervisor before revenue fully supports the role.
A semi-variable cost combines a baseline charge with an activity-based component. Utilities, equipment maintenance, delivery, and some technology contracts often behave this way. The business pays something even at low activity, then pays more as usage rises.
This is why the simple fixed-vs-variable split often breaks down in real businesses, with many expenses jumping in steps rather than moving smoothly with revenue, as described in guidance on semi-variable and step-fixed costs.
Practical rule: Classify costs by the decision that changes the cash payment, not by the account name in the general ledger.
If you want a broader diagnostic, review the factors affecting business costs alongside your P&L. Your objective is to locate the thresholds that can distort pricing, hiring, and cash planning.
Why a binary model creates bad decisions
Suppose an owner bids a large contract using a model that treats project supervision as fixed. The bid may look profitable because the supervisor's salary is spread across existing work. But if the contract requires another supervisor, the incremental economics are weaker than the model suggests.
The same issue appears in distribution and professional services. A customer win may require another delivery route, a support hire, or additional software seats. If the forecast misses that step, revenue grows while cash conversion deteriorates.
For a $10M to $100M business, these errors are material even without a precise percentage attached. The larger the operation, the more likely it is to encounter capacity limits where a smooth forecast becomes fiction. Build the thresholds into the model before you approve the contract.
How Fixed and Variable Costs Behave at Scale
A fixed cost remains unchanged with activity over a defined short-term operating range. Factory rent, property taxes, executive salaries, depreciation, and insurance are standard examples in manufacturing. A variable cost rises or falls with production or sales volume. Raw materials, direct labor, electricity, and maintenance can behave this way, as outlined in BDC's manufacturing cost glossary.
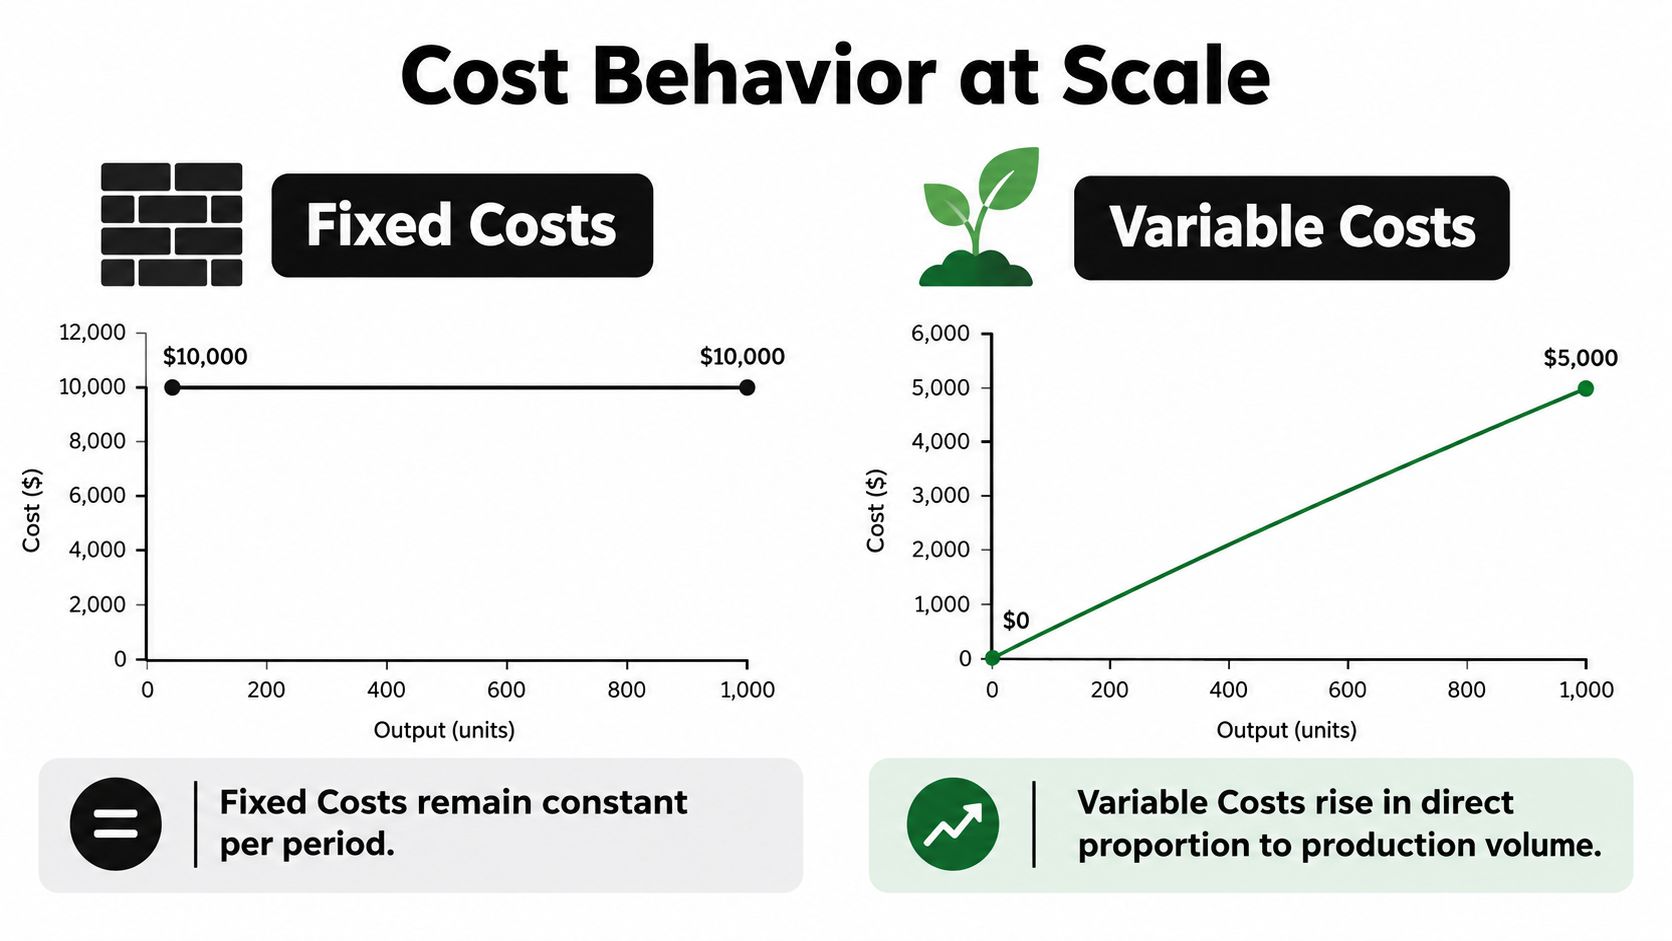
The financial trade-off is straightforward. Fixed costs create operating advantages. Once capacity is in place, additional volume can carry a lower share of overhead. Variable costs protect the downside because they contract when activity slows, but they can limit margin expansion.
The scale effect in numbers
If annual fixed overhead is $500,000, producing 10,000 units assigns $50 of fixed cost per unit. Producing 20,000 units assigns $25 per unit, while total fixed cost remains unchanged, according to OpenStax's explanation of cost behavior.
| Volume (Units) | Total Fixed Cost | Fixed Cost Per Unit | Total Variable Cost | Variable Cost Per Unit |
|---|---|---|---|---|
| 10,000 | $500,000 | $50 | Activity-dependent | Activity-dependent |
| 20,000 | $500,000 | $25 | Activity-dependent | Activity-dependent |
At low utilization, fixed-cost businesses carry a heavy burden. At medium utilization, overhead begins to spread across more output. At high utilization, the model can produce strong incremental profit, provided pricing and variable cost control hold.
A variable-heavy model behaves differently. Materials, commissions, subcontractors, and delivery charges rise with each job or unit. That structure is safer when demand is uncertain, because the company doesn't carry the full expense when revenue falls. The cost is flexibility, since each sale brings its own expense.
Use the model by industry
A construction company should separate project labor, subcontractors, equipment usage, branch overhead, and corporate leadership. A distributor should isolate product cost, freight, warehouse labor, facility costs, and route capacity. A professional services firm should distinguish delivery staff, project contractors, recurring leadership, software by user, and office commitments.
At each utilization level, ask three questions:
- Low volume: Which obligations continue even if new work slows?
- Expected volume: Which costs rise when the current team or facility reaches capacity?
- High volume: Which investments improve margin, and which merely add complexity?
Your cash forecast should show these effects, not just a single annual expense total. A practical cash burn analysis for SMEs can help connect cost behavior to liquidity, particularly when fixed commitments remain payable during a weak sales period.
For a deeper visual explanation, use the video below as a quick refresher before rebuilding your own volume scenarios.
Calculating Contribution Margin and Break-Even
Revenue alone doesn't tell you whether the next sale helps. Contribution margin does. It's the amount left after variable costs are subtracted from sales, and that remainder covers fixed costs before producing profit. The per-unit formula is:
Contribution margin per unit = Selling price per unit − Variable cost per unit
For a project business, replace “unit” with project, billable hour, route, or customer cohort. The logic stays the same. If a project sells for $40,000 and its incremental labor, materials, subcontractors, and delivery costs total $25,000, the project contributes $15,000 toward overhead and profit.
The break-even calculation
Break-even units equal fixed costs divided by contribution margin per unit. If fixed costs are $12,682, selling price is $16 per bottle, and variable cost is $8.44 per bottle, contribution margin is $7.56 per bottle. At 2,000 units, the implied break-even price is $14.78 per bottle, as shown in this Missouri Extension break-even example.
Use the formula in every pricing sheet:
Break-even units = Fixed costs ÷ Contribution margin per unit
If your fixed costs are $900,000 and each project contributes $30,000, you need 30 projects to cover overhead. That is a planning conclusion, not merely an accounting output. It tells you whether the sales target is realistic, whether capacity supports the target, and whether a proposed hire arrives before or after the business can fund it.
For a second explanation of the mechanics, Bookkeeping and Accounting of Florida's break-even guide can serve as a reference when documenting the calculation for managers.
Put the formula into your forecast
Add three lines to your monthly model:
- Expected volume, by product, project, or service.
- Variable cost per unit, with separate assumptions for labor, materials, commissions, and delivery.
- Contribution margin, both in dollars and as a percentage of sales.
Then calculate a second threshold for your target profit:
Required units for target profit = (Fixed costs + Target profit) ÷ Contribution margin per unit
Your break-even analysis framework should also include downside volume, price reductions, and variable cost increases. A model that only works at the budgeted volume isn't a decision tool. It's a hope document.
Rules for Classifying Messy Real-World Expenses
Classify each expense according to the decision you need to make. A cost may stay fixed for the next month, then become variable over a year. It may also remain fixed within one project while changing across projects. Before assigning a label, identify what causes the cash payment to change.
A practical classification test
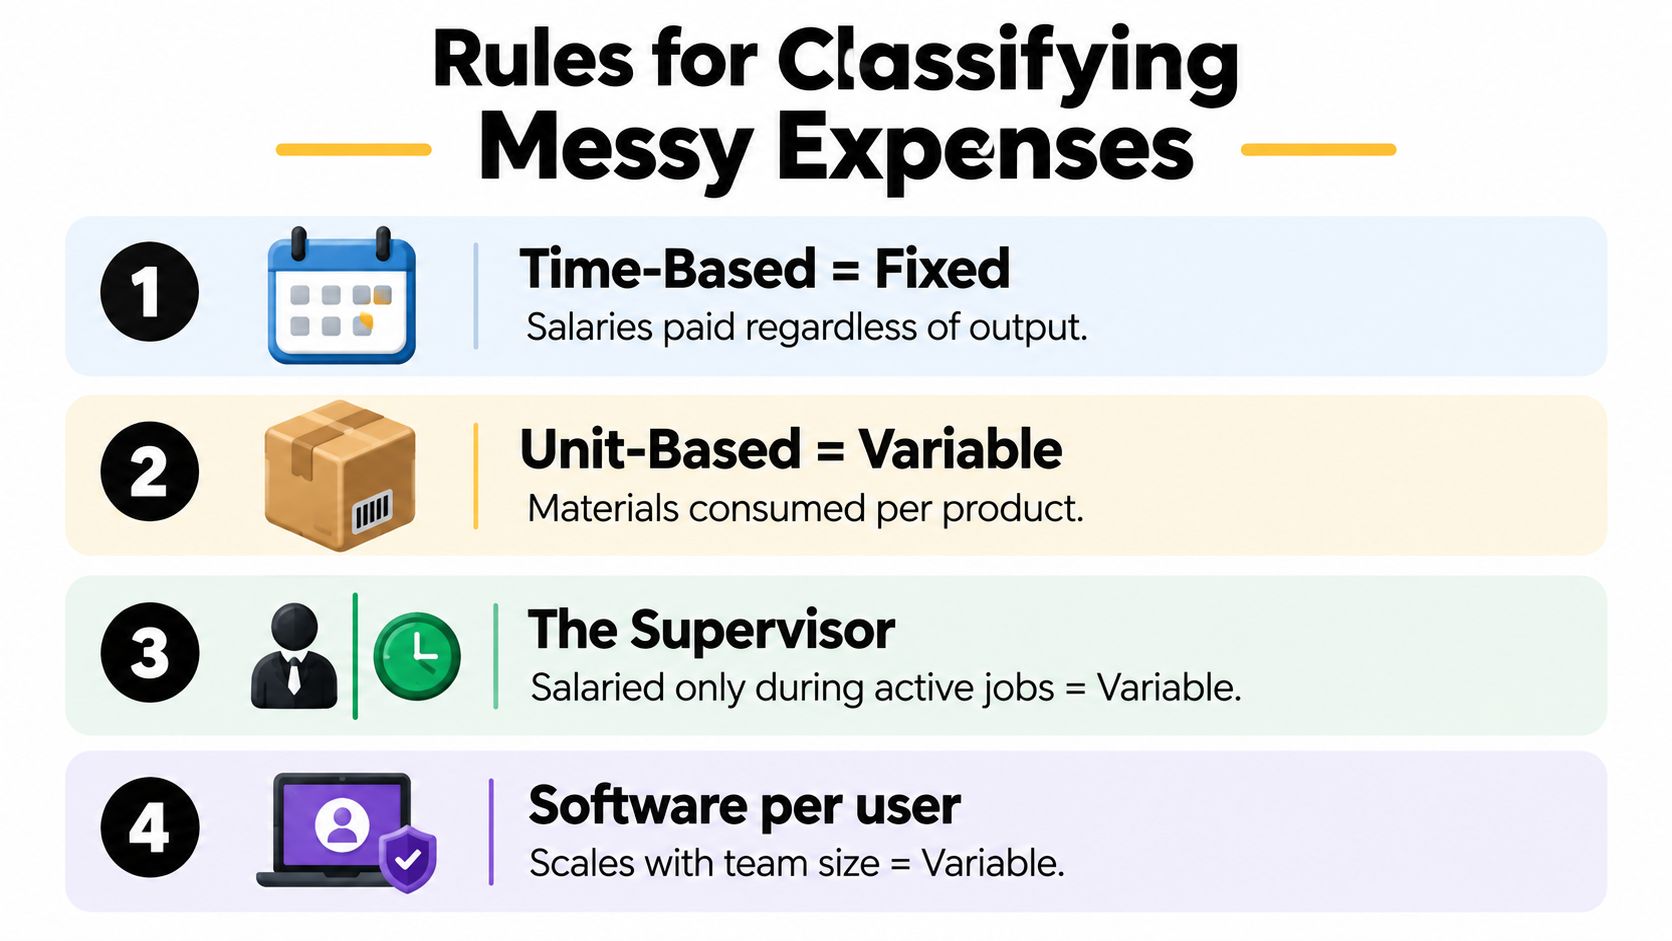
Apply these four tests to every material expense:
- Test the time trigger. If payment occurs because time passes, such as with a lease or recurring salary, classify the baseline as fixed for the forecast period.
- Test the activity trigger. If payment rises because the company sells, produces, ships, or delivers, classify it as variable.
- Find the threshold. Identify the volume, headcount, user count, or capacity limit that causes a sudden increase.
- Split the components. Separate the unavoidable base from the usage-driven amount.
A salaried supervisor is fixed when the company pays that person regardless of active work. If the role exists only for an active job and ends with the job, model the project-linked portion as variable. Software remains fixed only while the license count and pricing tier stay unchanged. Per-user licensing becomes variable as added employees increase the bill.
Build modeling buckets that reflect decisions
Keep the chart of accounts conventional, but make the management model more precise. Add behavioral tags such as:
| Modeling bucket | How to use it |
|---|---|
| Fixed within capacity | Holds steady until a known threshold |
| Direct variable | Moves with units, projects, or revenue |
| Semi-variable | Contains a base charge plus usage |
| Step-fixed | Jumps when capacity is exceeded |
| Discretionary | Management can pause or reduce it |
| Repricing exposure | Contract or market conditions can reset it |
Use the buckets to connect each expense to the decision that changes it. Rent, property taxes, executive salaries, and depreciation belong in a different planning group from raw materials, direct labor, and maintenance that rise with production.
Step-fixed costs deserve special attention in larger businesses. A new crew, warehouse, software tier, or support team can leave unit economics unchanged until capacity is reached, then raise overhead sharply. Model the threshold and the utilization required to absorb it before committing to growth.
Before accepting a contract, show the extra people, equipment, seats, and support capacity it consumes. Before adding a location, show the overhead step-up and the volume required to cover it. For a practical review of expense categories in Xero, see cutting costs the right way in Xero.
Adjusting Models for Inflation and Repricing Risk
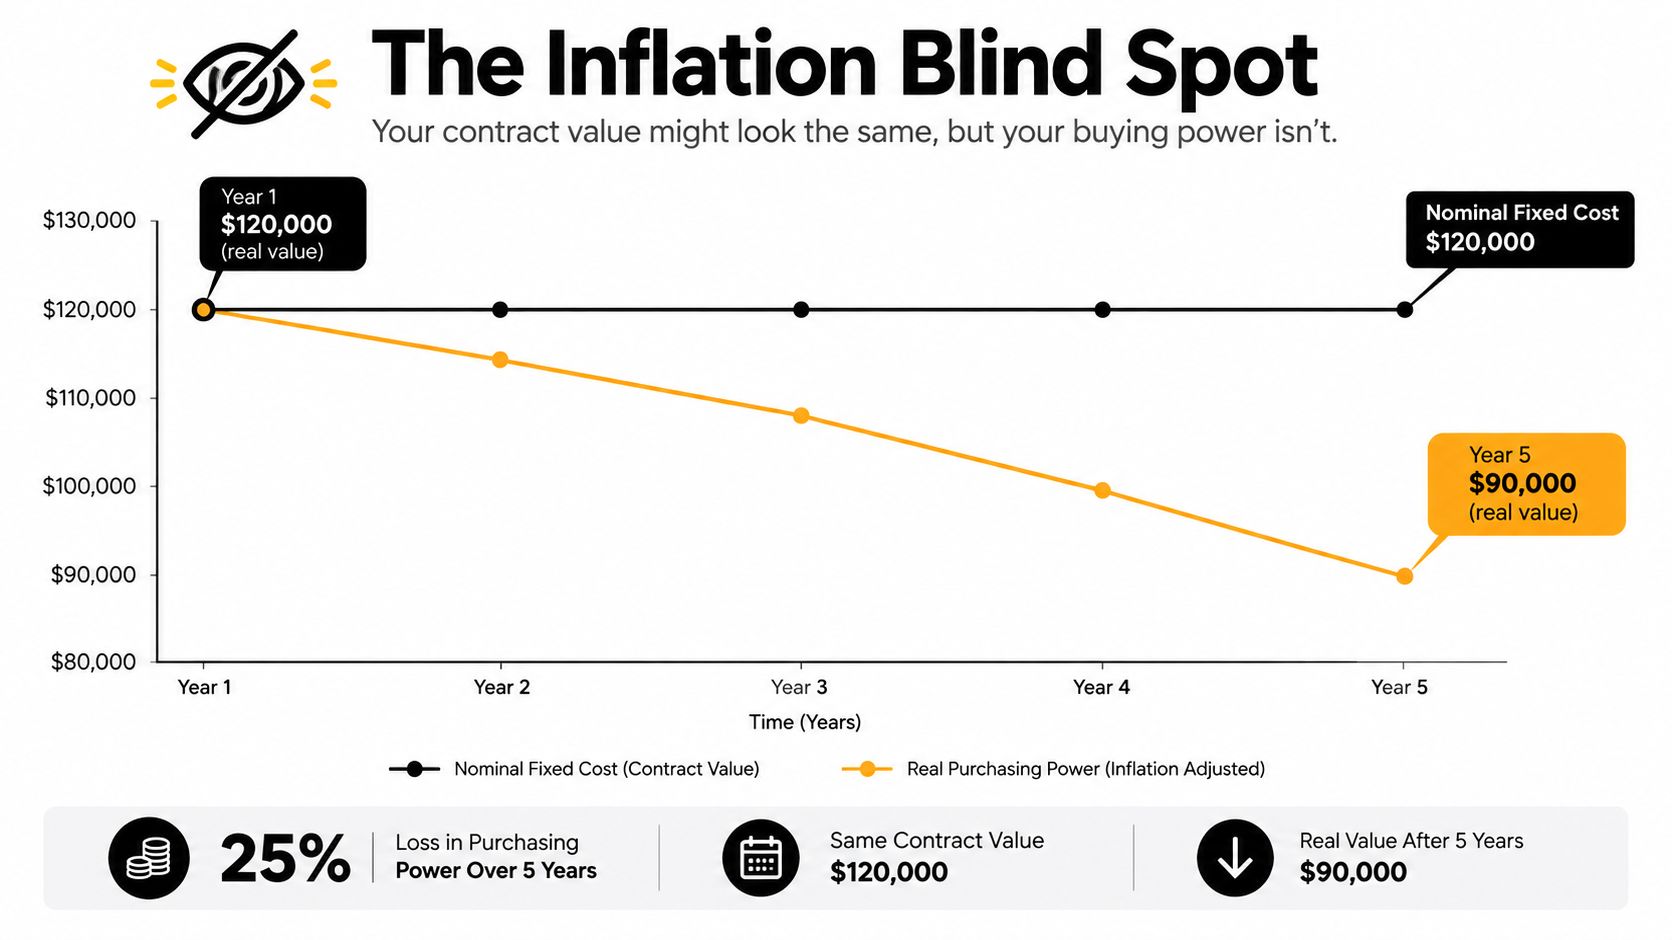
“Fixed” describes behavior over a chosen period. It doesn't guarantee a stable economic cost over the life of a contract. Rent may be locked temporarily, salaries may be scheduled, and insurance may be paid on a recurring basis, but renewal dates create repricing events.
That distinction matters for a business planning capital purchases, new crews, or a long-term customer contract. A model can show flat overhead while the underlying purchasing power and replacement cost move against the company.
Separate structural stability from repricing exposure
Create a “repricing date” for every major cost. Record the renewal date, escalation clause, wage review, insurance reset, supplier review, and tariff exposure. Then add a separate assumption for the likely change instead of hiding it inside a generic inflation line.
Recent construction cost reporting found that steel prices in the ENR 20-city average rose 11.9% by the end of 2025, while skilled labor rose 5.7%, according to ENR's 2026 cost report. Those movements show why a cost treated as fixed in an annual budget can still reprice sharply over a 12-month planning horizon.
A contractor that locks a customer price while steel and labor reset at renewal has variable economic risk, even if the accounting model labels the contract cost fixed. Your forecast needs to expose that risk before the bid is signed.
Run three operating cases
Build a base case, a downside case, and an upside case. Change the assumptions that drive cash, such as material cost, wage rates, insurance, subcontractor pricing, utilization, and customer payment timing.
Your scenario planning framework should answer:
- Margin case: What happens if direct input costs rise while price stays unchanged?
- Capacity case: What happens when the current team or facility reaches its threshold?
- Liquidity case: How much cash does the business need while repriced costs arrive before customer prices can change?
Don't call the model conservative if it only changes revenue. Stress the cost lines that can reset, and assign an owner to each assumption.
Strategic Moves to Optimize Your Cost Structure
Cost structure is a strategic choice. You can deliberately carry more fixed cost to gain capacity and margin at predictable volume, or keep more cost variable to protect cash during uncertainty. The right choice depends on demand visibility, customer concentration, service quality, and the speed at which you can reverse the commitment.
A business between $10M and $100M in annual revenue shouldn't outsource or insource by instinct. It should compare the full economics of flexibility, control, quality, and break-even exposure.
Convert fixed commitments when downside protection matters
Outsource non-core finance administration, IT support, recruiting, or specialized project work when demand is irregular and internal capacity would sit idle. Use contractors or subcontractors for work that clearly follows project volume, but track the contribution margin after those payments. A lower fixed-cost base is worthless if the external rate consumes the margin.
Leasing equipment can preserve cash and shift part of the commitment away from an upfront capital purchase. It can also create a continuing obligation, so compare the lease payment, utilization requirement, maintenance terms, residual risk, and exit flexibility against buying.
Compensation deserves the same discipline. Keep core leadership and mission-critical capability in-house when continuity matters. Use performance-linked compensation for roles whose workload or output follows revenue, rather than disguising a permanent role as variable.
Add fixed capacity only after demand earns it
Once demand is consistent, a fixed investment can improve productivity and protect service quality. A distributor may buy equipment when utilization is dependable. A professional services firm may hire specialists when the pipeline supports sustained deployment. A construction company may add a permanent operations leader when the project base can absorb the role through normal volume.
The aerospace example is a useful warning about fixed-cost intensity. Fixed cost in airframe manufacturing was estimated at about 19% two decades earlier and later at approximately 31%, illustrating how plants, tooling, engineering, and compliance can make an industry increasingly fixed-cost-heavy, as documented in this defense-industry cost analysis.
The question isn't whether fixed costs are good or bad. The question is whether your expected volume can carry them through a weak period.
Before committing, calculate the added fixed cost, the contribution margin required to absorb it, the volume threshold that triggers the commitment, and the cash impact if the contract arrives late. Use a focused cost-cutting strategy review to remove waste, not capability. Cutting a cost that protects delivery or pricing power can damage profitability more than it improves cash.
Your Action Plan for Cost Structure Modeling
You can build a useful first model this week. It doesn't need to be elaborate. It needs to connect the P&L to operating activity and show management what changes when volume, price, or capacity moves.
Audit the current cost base
Export the recent P&L and list every material expense. Add columns for payment frequency, operational driver, capacity threshold, renewal date, and owner. Don't accept “fixed” or “variable” as the final answer. Write the event that changes the payment.
Then map costs to the unit that matters:
- Construction: job, crew, equipment day, and project phase.
- Distribution: order, shipment, route, warehouse, and product category.
- Professional services: client, project, billable hour, and delivery team.
Rebuild contribution margin
For each unit, project, or client type, calculate selling price less direct variable costs. Include the labor, materials, subcontractors, commissions, delivery, and usage-based software that the work consumes.
Next, separate corporate overhead from delivery costs. This prevents a profitable-looking revenue line from hiding a weak project or client contribution.
Model the thresholds
Create low, expected, and high-volume cases. Insert step changes for another supervisor, warehouse, vehicle, software tier, or production shift. Add repricing events for contracts and major suppliers. Then calculate break-even volume and the volume required to achieve your target profit.
Use the financial modeling best practices as a reference for building assumptions that managers can review and update rather than a spreadsheet only one person understands.
Review the dashboard monthly
Track revenue, contribution margin, contribution margin percentage, fixed overhead, variable cost per unit, utilization, break-even volume, cash balance, and forecast variance. Review the drivers, not just the totals. If revenue is on budget but contribution margin is falling, the business has a pricing or delivery problem that topline reporting will miss.
AmbitionCFO works with founder-led companies on 13-week cash flow modeling, margin analysis by job or client, forecasting, KPI dashboards, and exit planning. For owners preparing an expansion, acquisition, or transition, the firm can connect cost behavior to the operating decisions that determine cash and profitability.
AmbitionCFO can help you audit your cost structure, rebuild contribution margin and break-even models, and stress-test the next 12 months of cash flow. Visit AmbitionCFO to discuss the financial model your leadership team needs before its next major hiring, capital, contract, or exit decision.