
Break-even analysis is the sales level where total revenue equals total costs, meaning the business covers all fixed and variable expenses before earning its first dollar of profit. For a business with $500,000 in fixed costs, a $100 selling price, and $60 in variable cost per unit, break-even is 12,500 units.
You're probably not asking this because you enjoy accounting formulas. You're looking at a new contract, equipment quote, warehouse lease, hiring plan, or price increase and need to know whether the decision will produce profit or create a larger loss. Break-even analysis gives you that answer by converting your cost structure into a sales target.
The important distinction is that break-even isn't a permanent number. Material prices change. Labor overruns appear. A discount reduces contribution margin. A new manager, truck, facility, or software commitment increases fixed overhead. Your break-even point moves with every meaningful change.
A useful model helps you calculate break-even in units and sales dollars, test best, base, and worst cases, and evaluate pricing, bidding, capital purchases, and exit readiness. That's how AmbitionCFO uses the tool with owner-led businesses. The formula is the starting point. The decision is the point.
Table of Contents
- Why Every Business Owner Needs Break Even Analysis
- Fixed Costs Versus Variable Costs and Contribution Margin
- How to Calculate Your Break Even Point in Units and Dollars
- Real World Break Even Examples for Construction Distribution and Services
- Common Break Even Mistakes and How to Avoid Them
- How AmbitionCFO Uses Break Even Analysis to Drive Client Decisions
Why Every Business Owner Needs Break Even Analysis
A commercial contractor receives a request to bid a large project. A distributor considers adding warehouse space. A services firm is deciding whether to hire another consultant before demand is fully committed. In each situation, the owner needs a practical answer: how much must the business sell before this decision pays for itself?
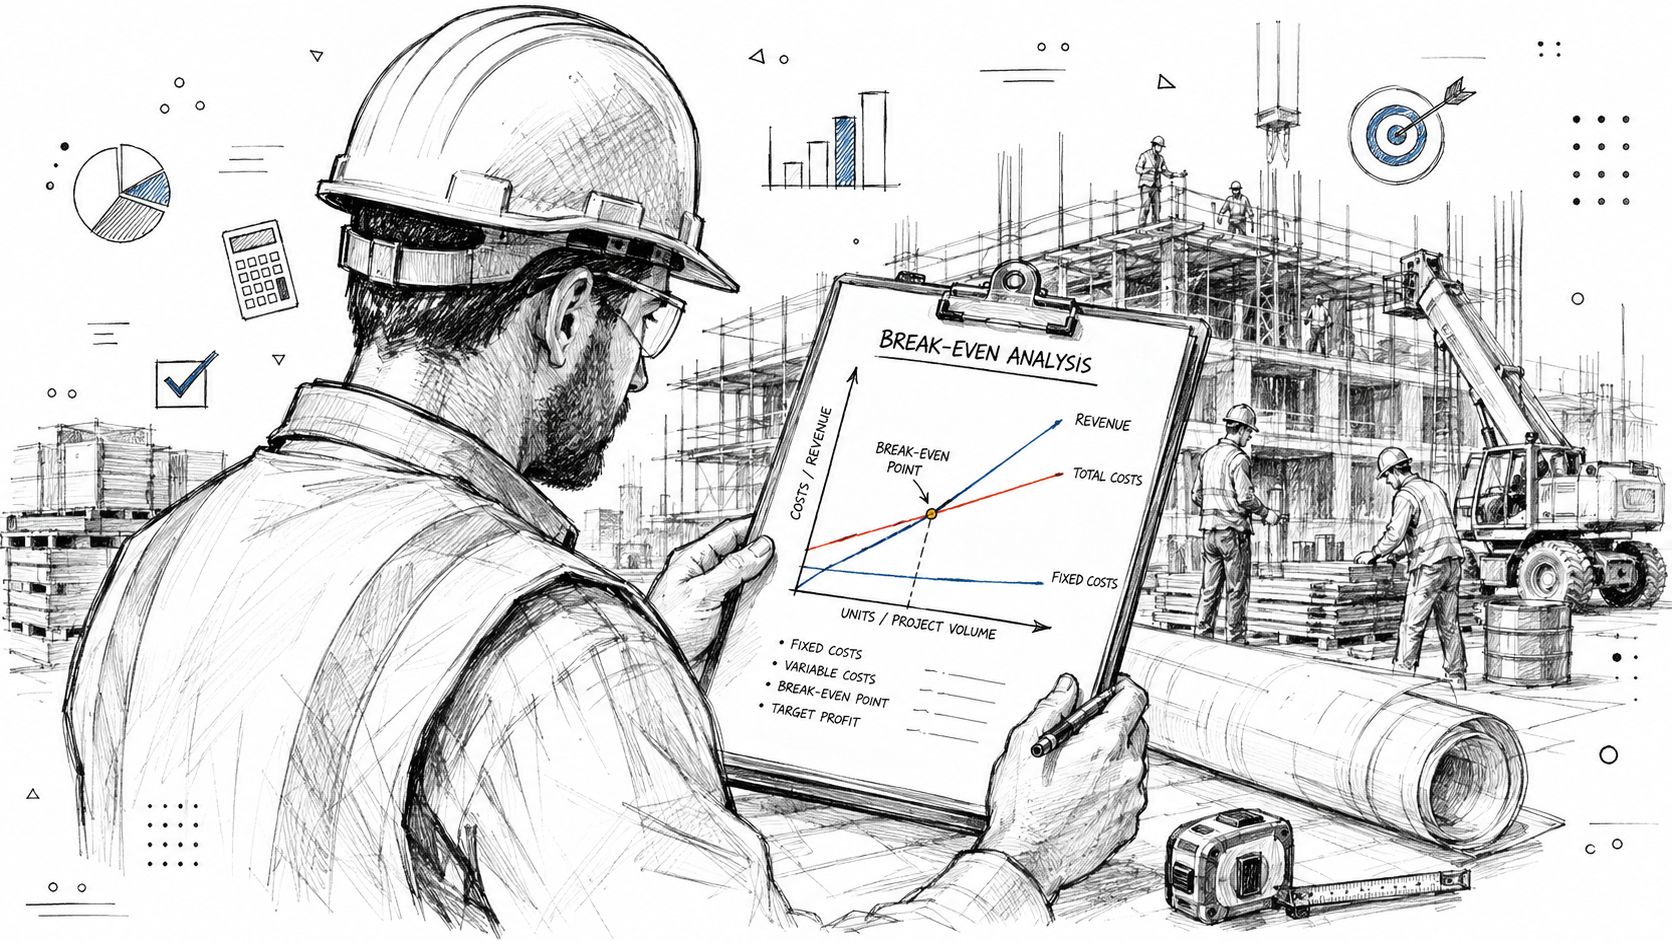
Break-even analysis answers that question. It identifies the sales level where total revenue equals total costs. Below that point, the business operates at a loss. At that point, it has covered its costs but earned no profit. Above it, each additional sale contributes toward operating profit, assuming the underlying price and cost assumptions hold. The U.S. Small Business Administration's break-even guidance uses the standard formula, fixed costs divided by price minus variable costs.
The method became a formal management-accounting tool in the early twentieth century. One of the earliest graphical treatments is credited to Henry Hess in 1903, and cost-volume-profit work later standardized the approach during the Great Depression, when firms needed to identify minimum viable production levels. The framework remains useful because it turns an abstract question about profitability into a concrete sales target. You can use that target to plan staffing, inventory, equipment purchases, and contract commitments. This history and formula overview provides the accounting context.
The decisions the number should support
Don't put a break-even figure in a report and stop there. Use it to make decisions such as:
- Pricing: Determine whether a proposed price leaves enough contribution margin to absorb overhead.
- Bidding: Test whether expected project volume supports the labor, supervision, insurance, and equipment commitment.
- Hiring: Calculate the additional sales or billable work required to carry a new salary and related overhead.
- Capital purchases: Compare the incremental fixed cost of equipment with the contribution generated by the capacity it adds.
- Cost control: Identify whether you need to reduce overhead, improve purchasing, or cut costs without sacrificing quality.
The metric also gives lenders, owners, and potential acquirers a clearer view of operating risk. A company with high fixed costs needs more volume before it earns profit, so demand declines and price concessions deserve closer scrutiny.
Practical rule: Never ask only, “What is our break-even point?” Ask, “What assumptions would move it, and how quickly would we notice?”
Start with the broader financial picture by reviewing the financial metrics every business owner should track. Then build break-even into monthly management reporting instead of treating it as a one-time spreadsheet exercise.
Fixed Costs Versus Variable Costs and Contribution Margin
The formula is only as reliable as the expense classification behind it. If you put direct labor in fixed costs when it rises with project volume, or leave freight out of variable costs, your break-even target will mislead you.
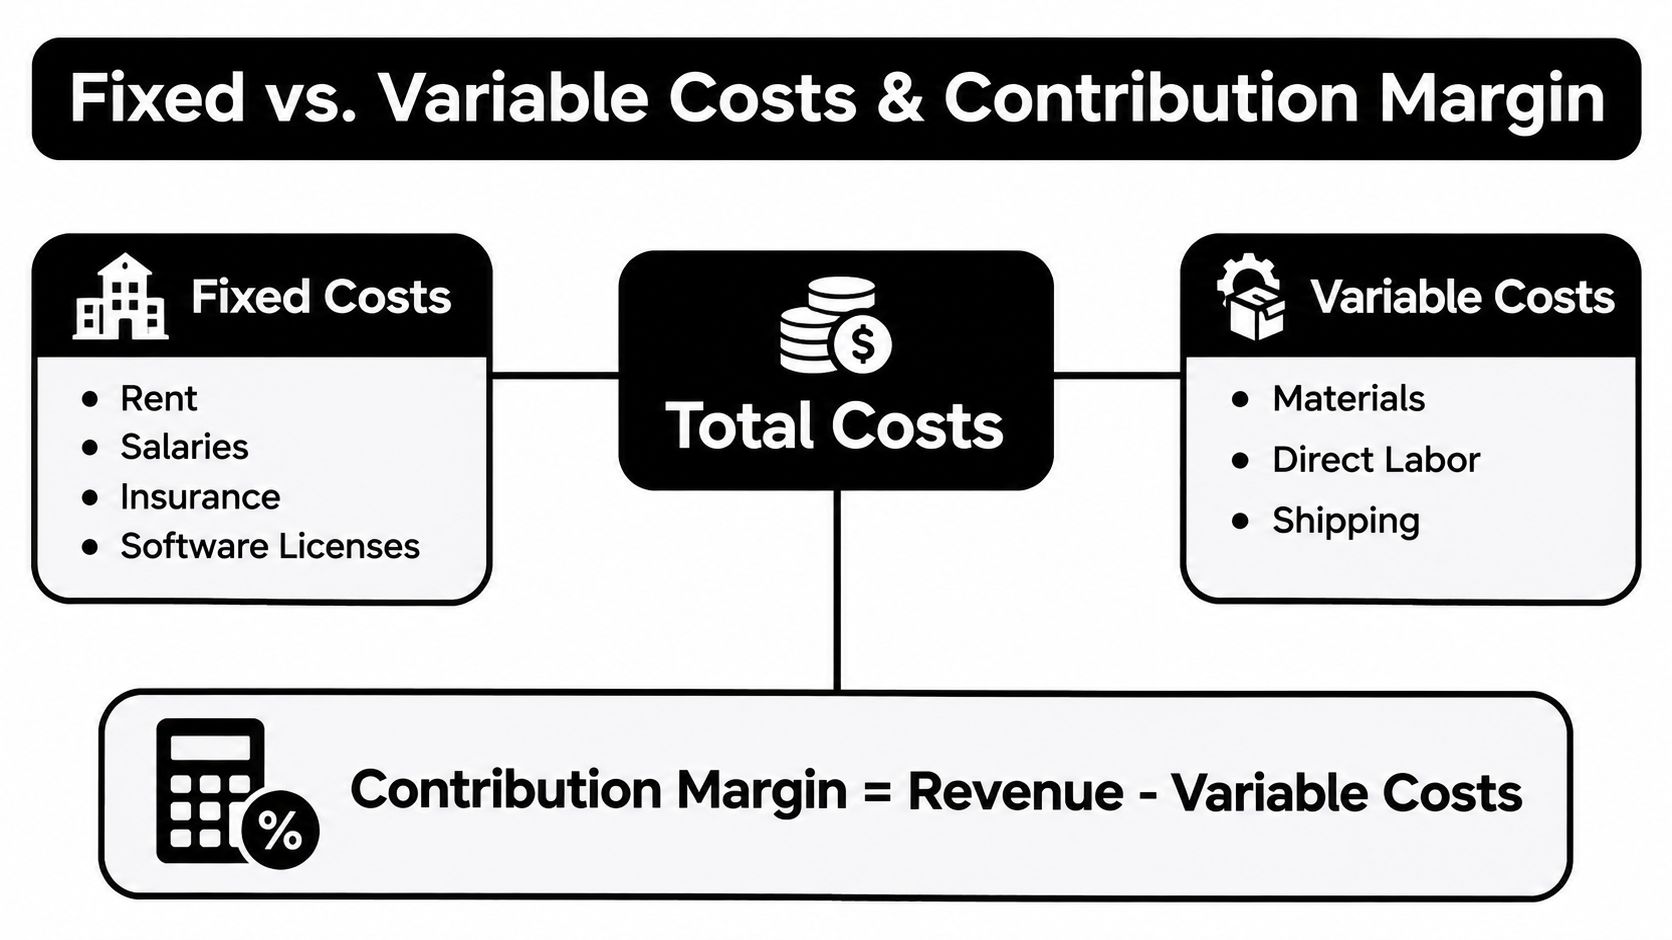
Fixed costs generally remain stable within the relevant operating range. They include rent, salaried administrative staff, insurance, software licenses, and certain equipment commitments. A distribution company may pay the same warehouse rent whether it ships a small or large number of orders. A professional services firm may carry the same finance, office, and technology overhead while consultant utilization changes.
Variable costs move with sales activity. Materials, direct labor, freight, packaging, commissions, and transaction fees typically rise as the company sells more. A construction contractor consumes more materials and field labor as it completes additional work. A distributor incurs product and shipping costs with each order. A services firm may treat subcontractor fees or delivery-specific labor as variable even when internal salaries remain fixed.
Some expenses are mixed. Vehicle costs may include a stable lease component and a usage-based fuel component. A sales compensation plan may combine a fixed salary with commissions. Split these costs when the distinction matters to the decision.
Contribution margin is the working engine
Contribution margin is selling price minus variable cost per unit. It represents the amount each sale contributes toward fixed costs and, after fixed costs are covered, profit. The Wall Street Prep break-even explanation states the same unit relationship: break-even units equal fixed costs divided by contribution margin per unit.
Use two measures:
- Contribution margin per unit: Selling price per unit minus variable cost per unit.
- Contribution margin ratio: Contribution margin divided by sales.
For example, a product sold for $100 with a $60 variable cost produces a $40 contribution margin per unit. That $40, not the $100 sales price, is what absorbs fixed overhead.
For a multi-product business, calculate the contribution margin across the expected sales mix. A blended margin can be useful for company-level planning, but it can also hide an unprofitable product, customer, or service line. Review margins by job, SKU, client, and channel before approving a major commitment. In construction, accurate classification depends on reliable job-level data, so owners should pair break-even work with job costing.
A quick P&L classification audit
Take the latest operating statement and ask:
- Does this cost rise when units, projects, shipments, or billable hours rise?
- Would the cost remain if sales stopped temporarily?
- Is the cost mixed, with both stable and usage-based components?
- Does the line include owner compensation that should be part of operating overhead?
- Can the cost be assigned directly to a job, customer, product, or project?
Don't classify expenses by habit. Classify them according to the decision you're modeling. A pricing decision may require a precise per-unit cost. A facility decision may require separating the new lease from the variable fulfillment costs it enables.
How to Calculate Your Break Even Point in Units and Dollars
Start with the unit formula:
Break-even units = Fixed costs ÷ contribution margin per unit
Contribution margin per unit equals selling price per unit minus variable cost per unit. The SBA's standard example uses $500,000 in fixed costs, a $100 selling price, and $60 in variable cost per unit, producing a $40 contribution margin and a break-even point of 12,500 units. The arithmetic is $500,000 ÷ ($100 − $60) = 12,500. The SBA's break-even resource provides this example and formula.
Unit calculation
Use this sequence:
- List fixed costs for the period you're analyzing.
- Confirm the selling price per unit, project, or service package.
- Estimate variable cost per unit, including direct labor, materials, freight, commissions, and other volume-linked costs.
- Subtract variable cost from price to determine contribution margin.
- Divide fixed costs by contribution margin.
- Round up to a whole unit, project, or contract where fractional sales aren't possible.
A construction company may need to calculate labor cost carefully before using the result. A resource explaining how to calculate labor cost per hour can help you include wages and related labor burden rather than relying on an incomplete hourly rate.
For services or mixed-product companies, unit counts may not be meaningful. Use the revenue formula:
Break-even sales dollars = Fixed costs ÷ contribution margin ratio
The Lumen Learning explanation of revenue break-even defines the contribution margin ratio as contribution margin divided by sales. If fixed costs are $500,000 and the contribution margin ratio is 40%, break-even revenue is $1,250,000.
Compare the right version to your business model
| Business Type | Fixed Costs | Price per Unit or Project | Variable Cost | Contribution Margin | Break-Even Units or Projects | Break-Even Revenue |
|---|---|---|---|---|---|---|
| Product business | $500,000 | $100 | $60 | $40 | 12,500 units | $1,250,000 |
| Construction project model | $18,000 | $100 per project unit | $20 | $80 | 225 units | $22,500 |
| Services model | Fixed costs ÷ contribution margin ratio | Project or service price | Delivery-specific costs | Price minus variable cost | Use projects or hours | Fixed costs ÷ contribution margin ratio |
The second row uses the managerial-accounting example with $18,000 in fixed costs and an $80 contribution margin, resulting in 225 units at break-even. Boise State's contribution-margin example also shows that target units for a desired profit equal fixed costs plus desired profit, divided by contribution margin per unit.
Add the margin of safety
Break-even tells you where losses stop. Margin of safety tells you how much room exists before losses begin.
Margin of safety in dollars = actual or budgeted sales − break-even sales
The percentage version is:
Margin of safety percentage = (actual or budgeted sales − break-even sales) ÷ actual or budgeted sales × 100%
That measure helps an owner assess downside exposure. The margin-of-safety formula defines the cushion above break-even and shows how much sales could fall before the company enters a loss position.
Operating leverage adds another risk lens. Degree of operating leverage is commonly expressed as contribution margin divided by operating income. As operating income approaches zero near break-even, operating leverage rises sharply, so a small revenue decline can produce a disproportionately large profit decline. This leverage analysis explains why fixed-cost-heavy businesses need tighter volume monitoring.
For a working model, use the financial modeling best practices that keep assumptions visible, traceable, and easy to revise.
Real World Break Even Examples for Construction Distribution and Services
A formula becomes valuable when it changes a decision. The following examples show how an owner can use contribution margin and fixed-cost analysis to assess a bid, a facility, or a staffing plan.
Construction contractor deciding whether to bid
A commercial contractor is considering a $2 million project at a lower proposed margin. The owner should not ask whether the contract is large enough. The owner should ask whether the project's contribution after direct labor, materials, subcontractors, and project-specific costs adequately absorbs the fixed supervision, equipment, insurance, and office overhead assigned to the work.
The contractor builds a project-specific break-even model with the bid price, expected direct costs, remaining fixed overhead, and downside assumptions for labor overruns and schedule delays. If the expected contribution leaves a narrow margin of safety, the contractor can raise the price, revise scope, require stronger change-order protections, or decline the bid. For a deeper construction application, use construction job costing to connect the bid model to actual project performance.
Distributor testing a warehouse lease
A building-products distributor is evaluating a new warehouse lease. The lease increases fixed costs, while product purchases, handling, freight, and certain fulfillment costs vary with shipments. The owner calculates the incremental fixed cost and divides it by the contribution margin per additional SKU or shipment.
That result becomes the minimum volume the warehouse must support. The decision should also account for capacity, product mix, inventory carrying requirements, and whether the added space attracts profitable orders rather than low-margin volume. A revenue-based model is more useful if the distributor sells a wide range of products with different prices and margins.
For a different kind of large-scale breakeven discussion, the analysis of buyer breakeven for SpaceX illustrates how breakeven questions can be framed around the buyer's economics rather than only the seller's reported revenue.
Services firm setting consultant capacity
A professional services firm has fixed costs for leadership, rent, technology, insurance, and administration. Each consultant also carries delivery-specific costs, including compensation and any subcontractor or project expense that changes with client work.
The firm calculates contribution per billable hour or project, then divides fixed overhead by that contribution. The result tells the owner how much billable work the team must generate before the firm covers its operating structure. That number should guide hiring, pricing, utilization targets, and client selection. A low-price engagement may fill the schedule while contributing too little to overhead.
A visual walkthrough can help teams understand how volume, price, and cost assumptions interact:
These examples share one lesson. Break-even doesn't tell you whether an opportunity is attractive by itself. It tells you the minimum economic performance the opportunity must deliver, giving you a disciplined basis for accepting, repricing, staffing, or rejecting it.
Common Break Even Mistakes and How to Avoid Them
The most dangerous break-even model is a precise calculation built on stale assumptions. Owners often treat the output as a permanent fact even though price, labor, freight, interest, rent, and project scope can change during the year.
Five errors that distort the answer
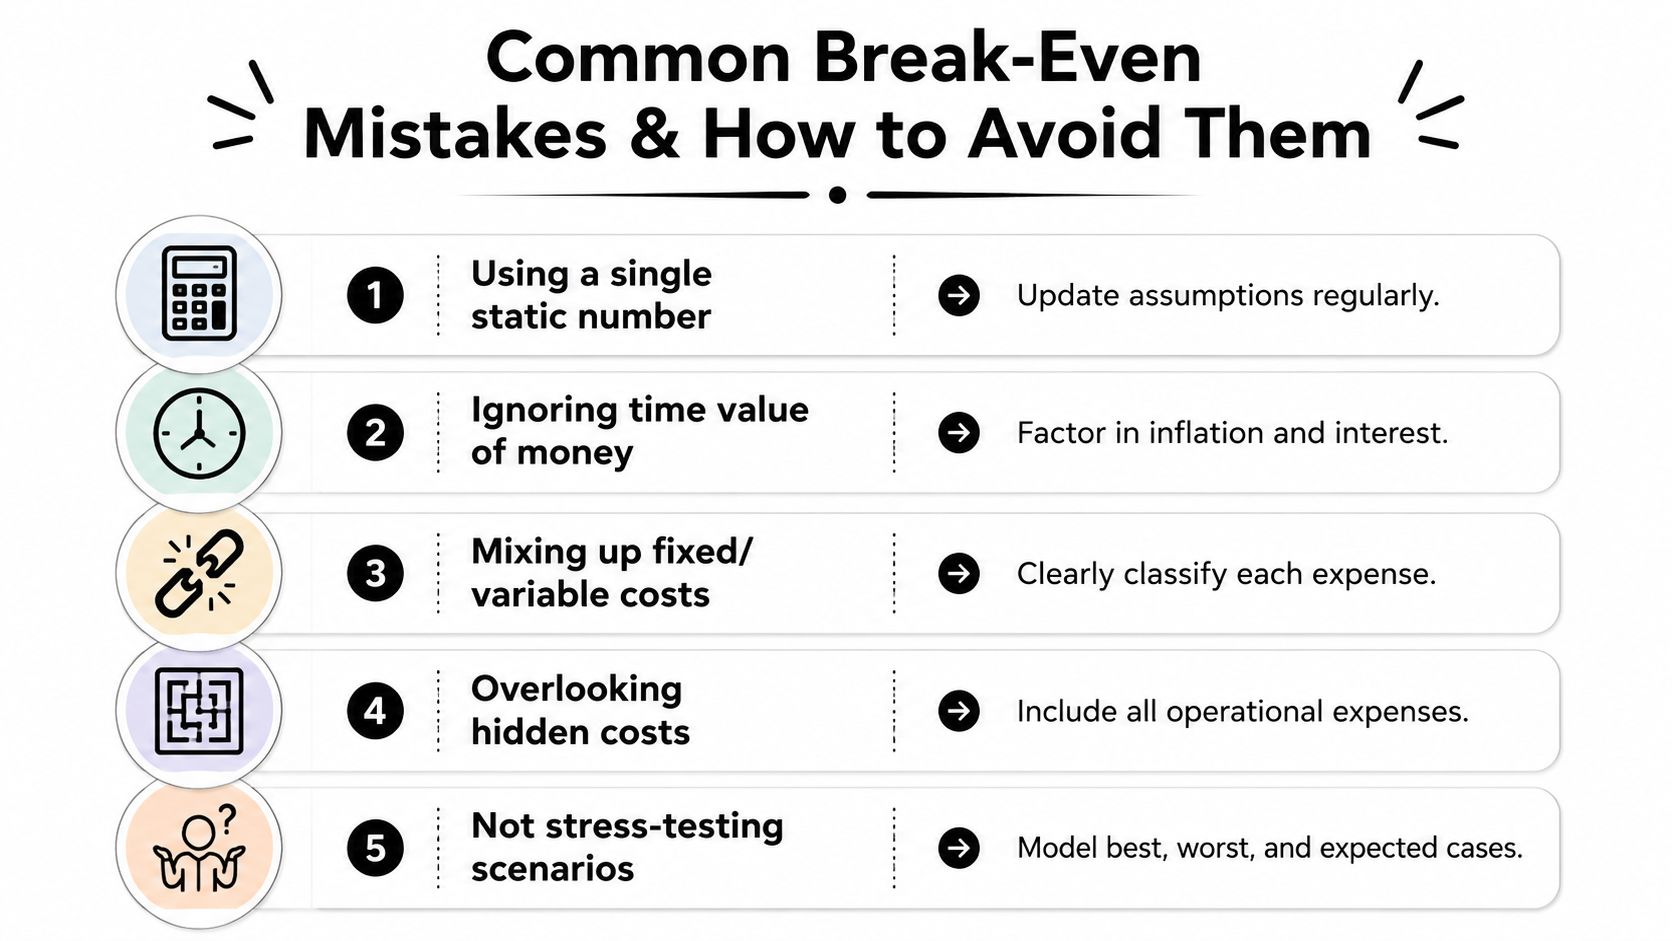
- Treating fixed costs as permanently fixed: Costs can step up when volume requires another supervisor, vehicle, shift, or facility. Model the operating range you expect.
- Ignoring variable-cost pressure: Material inflation, discounting, freight increases, and labor overruns narrow contribution margin. A 10% drop in contribution margin can require more than a 10% increase in sales volume to restore the same profit threshold, as explained in this contribution-margin analysis. (Reference)
- Leaving out owner compensation: If the owner performs operating work, include a realistic cost for that role. Otherwise, the model may show profit that disappears when the business hires someone to replace the owner.
- Blending profitable and unprofitable work: Company-wide averages can hide a weak product line, client, job, or contract. Analyze contribution by economic unit.
- Confusing accounting and cash break-even: Accounting break-even compares revenue with income-statement costs. Cash break-even focuses on cash inflows and outflows. A business can show accounting profit while struggling to fund payroll, inventory, debt service, or project costs.
Replace one answer with three operating cases
Scenario-based break-even is the better operating method. Build:
- Best case: Favorable pricing, expected productivity, stable variable costs, and planned volume.
- Base case: The assumptions management currently considers most realistic.
- Worst case: Lower pricing, higher direct costs, delays, weaker mix, or slower collections.
The Investopedia overview of break-even analysis emphasizes that the useful question is how the threshold changes when operating costs and business conditions change. It also frames a broader breakeven target that can include operating costs, interest, taxes, and a desired net income.
Before presenting the model to a lender, board, or potential acquirer, verify that fixed costs include all committed overhead, variable costs reflect current delivery economics, owner compensation is addressed, product mix is visible, and cash obligations are separately modeled. If accrual reporting obscures the cash picture, review the process for converting accrual to cash.
How AmbitionCFO Uses Break Even Analysis to Drive Client Decisions
A fractional CFO should turn break-even into a recurring management control, not a spreadsheet kept in a shared folder. AmbitionCFO serves founder-led businesses with $10M to $100M in annual revenue, using break-even analysis to inform pricing, bidding, capital purchases, and exit planning.
For a new contract, the model shows the minimum price and volume required to cover incremental delivery costs and overhead. For a large project, it tests schedule, labor, and margin assumptions before the owner commits capacity. For equipment, it compares the added fixed cost with the contribution from the capacity or efficiency the purchase is expected to create. For an owner planning a transition within 3 to 10 years, it shows how recurring profitability, customer mix, and fixed-cost exposure affect the durability of the business.
The firm can place these assumptions inside a 13-week cash flow model, KPI dashboard, monthly reporting package, or Certified Exit Planning engagement. That creates a live view of how actual pricing, volume, cost changes, and cash requirements compare with the original plan.
Don't wait for the income statement to tell you that a decision failed. Build your break-even worksheet with current fixed costs, variable costs, contribution margins, and best, base, and worst cases, then review it whenever you change price, staffing, capacity, or contract terms.
AmbitionCFO provides break-even diagnostics, profitability analysis, 13-week cash flow modeling, and exit-planning support for founder-led businesses. Visit AmbitionCFO to discuss your current pricing, bidding, capital purchase, or ownership-transition decision and turn the numbers into an actionable plan.