

Can you answer the next cash question without opening a dozen spreadsheets? Specifically, how much cash will be available over the next 13 weeks, which jobs or customers create or destroy margin, and what changes if sales slow, collections stretch, or hiring accelerates?
That's the gap in conventional financial modeling. A polished annual budget may look precise while hiding a near-term cash squeeze or an unprofitable project. The strongest financial modeling best practices connect assumptions to cash, profitability, working capital, and the weekly decisions owners make.
A driver-based model forecasts from operating variables such as jobs won, labor hours, units shipped, utilization, or collection timing instead of extending old line items. DSO, or days sales outstanding, measures how long customers take to pay invoices. Sensitivity analysis tests how a result changes when a key assumption moves, helping leaders see which variables deserve attention first.
This guide organizes ten practices around the decisions founder-led businesses must make: protecting cash, improving profitable growth, building reliable forecasts, and creating decision-ready reporting. AmbitionCFO supports $10M–$100M founder-led businesses with 13-week cash flow modeling, margin analysis, forecasting, KPI dashboards, and exit planning. Its work focuses on fractional CFO advisory support, not bookkeeping, tax preparation, audit, valuation, or fundraising services.
Table of Contents
- 1. Build a 13-Week Rolling Cash Flow Forecast
- 2. Analyze Margin by Customer, Job, or Project
- 3. Implement KPI Dashboards Tied to Financial Outcomes
- 4. Develop a Rolling 12-Month Budget and Forecast
- 5. Align Compensation With Financial Outcomes
- 6. Track and Manage DSO to Improve Cash Flow
- 7. Establish Reporting Standards and a Monthly Close
- 8. Create a Working Capital Playbook
- 9. Automate FP&A and Integrate the Data
- 10. Manage Change Before Scaling Financial Practices
- Top 10 Financial Modeling Best Practices, Comparison
- Turn the Model Into a Weekly Management Habit
1. Build a 13-Week Rolling Cash Flow Forecast
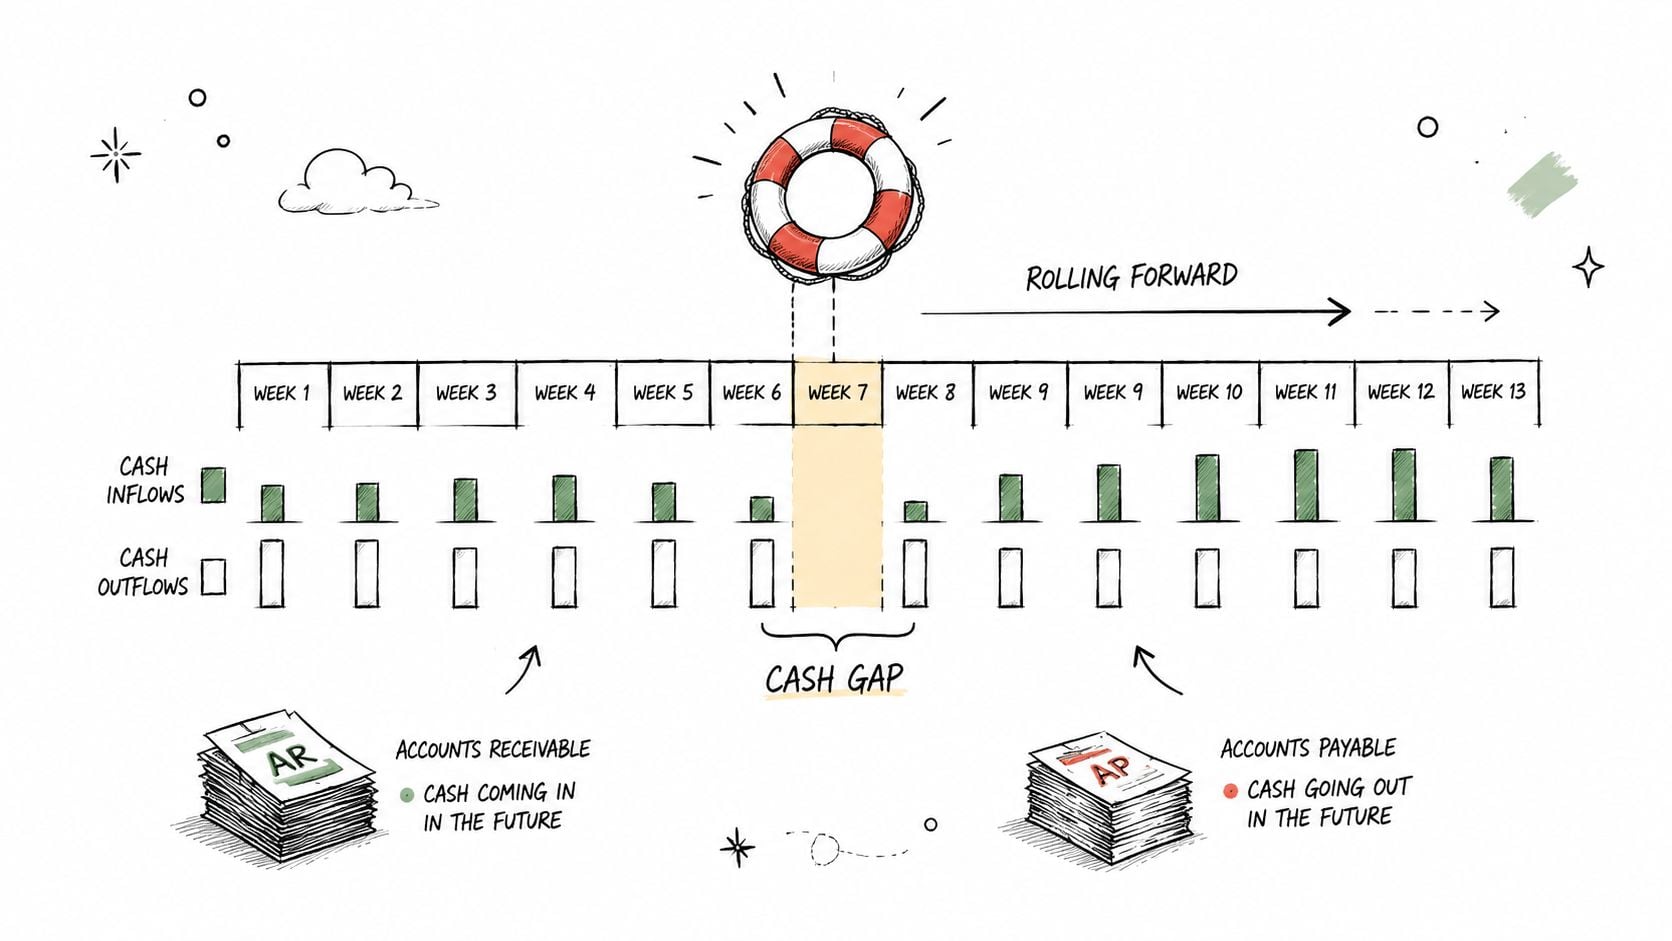
A 13-week rolling cash flow forecast shows weekly inflows, outflows, and ending cash for the near term. Each week, you remove the completed period, add a new future week, and update expected receipts and payments. That rhythm exposes timing problems that a profitable income statement can miss.
Start with the largest cash drivers rather than trying to perfect every line. Pull your accounting system's accounts receivable aging report, identify your three largest customers and suppliers, and build the model until it covers most expected cash activity. Add payroll, payroll taxes, debt payments, retainage receipts, vendor payments, and one-time capital purchases. Leave out non-cash items such as depreciation.
A $40M construction firm found a $500K cash gap in weeks 8–10 because retainage from three large projects was scheduled to arrive together. Early communication and partial advance payment removed the need for emergency financing. A $25M distributor negotiated net 60 terms instead of net 30 and freed $300K in working capital. A $15M services firm identified $175K trapped in slow-paying clients and used the finding to justify an AP coordinator, recovering that cash within six months.
Make the update easy to repeat
Keep columns for dates, categories, expected amount, actual amount, and notes. Set a recurring Friday 2 PM update and make it a short team ritual. Share the forecast with your bookkeeper and controller monthly. Differences often reveal missing invoices, incorrect payment dates, or other data-quality issues.
For a deeper operating routine, use this cash flow forecasting best practices guide.
The forecast becomes valuable when it drives action before the cash gap arrives.
2. Analyze Margin by Customer, Job, or Project
Revenue can hide weak economics. A customer, job, or engagement may look attractive until you include direct labor, materials, freight, rework, discounts, service demands, and a reasonable allocation of overhead.
A $30M construction firm discovered that 15% of its jobs lost money after overhead. Repricing and estimate changes improved net margin by 2.1%, adding $630K in profit. A $50M distributor found that its smallest 20% of customers consumed 40% of order-processing costs. A $50 minimum order freed $400K annually. An $18M services firm shifted its mix toward custom projects with higher net margin and improved revenue quality.
The practical lesson is to calculate profitability where work is delivered. Construction companies need job costing that captures field labor, subcontractors, change orders, retainage, and estimated-to-actual performance. Distributors should include warehouse handling, freight, returns, and order frequency. Professional services firms should examine realization, utilization, scope changes, and unpaid time.
Build the analysis in the operating system
Start with your top 20 customers or 30 jobs, validate the results, and then expand. Use your accounting system's job-costing or cost-center functions instead of maintaining a separate manual workbook. Choose overhead drivers that reflect consumption. Labor hours may fit a services business, while direct job costs may be more useful for construction.
Run the analysis at least quarterly, or monthly when the business moves quickly. Compare estimated margin with actual margin after completion. That variance improves future bids, pricing, staffing, and contract terms.
Use this customer profitability analysis framework to turn margin reporting into a pricing and resource-allocation habit.
3. Implement KPI Dashboards Tied to Financial Outcomes
A dashboard shouldn't become a wall of attractive charts. It should answer three questions: What drives profitability? What predicts cash flow? What signals trouble early?
A $35M construction firm used dashboard visibility into rising DSO to improve billing and collections, recovering $200K in cash. A $45M distributor saw freight costs rise, switched carriers, and saved $180K annually. A $22M services firm noticed realization falling, adjusted scope, and restored profit margin by 1.5%.
Those examples work because the operational metric connects directly to a financial result. A construction dashboard might pair unbilled work and billing milestones with project margin and cash receipts. A distributor dashboard may connect inventory turns, freight, fill rate, and gross margin dollars. A professional services dashboard should connect utilization, realization, backlog, and DSO.

Choose a small set leaders will use
Start with 6–8 metrics, not a catalogue of every available measure. Connect the accounting system to a BI tool such as Power BI, Tableau, or Looker rather than relying on manual Excel updates. Set targets from historical performance and strategy, then assign an owner to every metric.
Review the dashboard in a weekly 15-minute leadership huddle. Each metric should lead to a decision, an owner, or a follow-up date. Create separate views for executives, sales, operations, project managers, and finance.
Customer-facing teams may also need operational measures. A useful companion resource is this guide to customer service metrics 2026. For financial definitions and owner-level priorities, use the financial metrics every business owner should track.
4. Develop a Rolling 12-Month Budget and Forecast
An annual budget becomes stale as soon as actual results, hiring plans, customer demand, or supplier conditions change. A rolling 12-month forecast keeps a full year of monthly visibility while replacing the completed month with a new future month.
A $28M construction firm used a rolling forecast to negotiate seasonal credit at 6% instead of drawing emergency credit at 10%, saving $12K annually. A $55M distributor modeled a second-shift hire and confirmed the decision would become net positive by month 7. A $20M services firm modeled an acquisition and identified an $800K working-capital requirement before agreeing to payment terms.
Build the forecast from drivers. Revenue might depend on signed backlog, project starts, units shipped, price, billable capacity, or utilization. Labor expense should reflect headcount, wage rates, overtime, and timing. Working capital should reflect collections, inventory purchases, vendor terms, and payment schedules.
Make the forecast a management conversation
Use 12–24 months of actuals to calibrate the drivers, then update monthly. Perform variance analysis that explains why actual results differ from forecast. Don't label a miss as “timing” unless someone can identify the underlying timing issue.
Maintain base, upside, and downside cases, but connect each case to operating conditions. Demand, labor availability, commodity costs, collections behavior, and capacity constraints usually matter more than arbitrary percentage changes.
A flexible budget gives leadership a better decision tool than a static target. Learn how to structure one with this guide to flexible budgeting.
5. Align Compensation With Financial Outcomes
Employees respond to what the compensation plan rewards. If incentives focus only on revenue, shipments, hours, or utilization, teams may increase activity while damaging margin or cash.
A $32M construction firm changed its commission structure to 70% revenue and 30% gross margin. Gross margin rose from 36% to 38.5%, adding $400K in annual profit. A $48M distributor tied operations bonuses to inventory turns and gross margin dollars, freeing $900K of working capital in the first year. A $24M services firm introduced a realization-rate bonus and reduced DSO from 52 to 38 days.
The design matters as much as the metric. Sales teams can influence price, discounting, contract quality, and customer mix. Project managers can influence labor productivity, change-order discipline, and rework. Operations leaders can influence inventory, freight, and purchasing. Don't assign a metric to a team that can't affect it.
Introduce incentives without breaking trust
Start by tying 15–20% of a bonus to one financial measure before expanding. Set targets using historical performance and strategic priorities, not arbitrary ideals. Communicate the calculation monthly so employees can see how actions affect results.
Add guardrails. A sales bonus tied to margin should also protect customer retention and contract quality. An inventory target shouldn't encourage stockouts. Pilot the change with one team, review behavior and outcomes, and adjust the formula before a wider rollout.
For a related productivity measure, review revenue per employee alongside margin and cash outcomes. Revenue alone isn't a sufficient definition of performance.
6. Track and Manage DSO to Improve Cash Flow
DSO measures collection speed. A rising DSO often means invoices aren't being issued correctly, customers are disputing charges, approval workflows are slow, or account managers aren't escalating overdue balances.
A $38M construction firm improved DSO from 48 to 38 days by diversifying customers and freed $1.6M in cash. A $52M distributor increased early-pay discount adoption and improved DSO from 42 to 36 days. The discounts cost $1.2M, but the company freed $3.1M in cash, creating a net benefit of $1.9M. A $19M services firm adopted milestone billing, reduced DSO from 51 to 34 days, and cut bad debt from $180K to $42K annually.
Don't manage DSO as a single finance number. Segment it by customer, contract type, salesperson, business unit, and aging bucket. Compare actual collection behavior with stated payment terms. A customer paying late may require revised terms, deposits, milestone invoices, or an executive escalation.
Turn collections into a weekly operating process
Review AR aging weekly and flag invoices over 60 days. Automate reminders, document escalation steps, and give owners specific accounts to resolve. Construction contracts should state retainage terms and billing milestones clearly. Services businesses can use deposits or milestone billing when deliverables span multiple periods.
Early-pay discounts can help, but the cash benefit must exceed the discount cost. Model that trade-off before offering broad concessions. The objective isn't faster collections at any price. It's reliable cash conversion that protects customer relationships and margin.
7. Establish Reporting Standards and a Monthly Close
Leadership can't make reliable decisions from reports that arrive late or change definitions from month to month. A documented close process creates consistent ownership, timing, and review.
A $42M construction firm reduced close time from 45 to 12 days by enforcing timely jobsite entries and controller review. That visibility enabled mid-month pricing adjustments that recovered $200K in annual margin. A $55M distributor standardized its chart of accounts across divisions and reduced close time from 30 to 11 days. An $18M services firm improved DSO visibility by recording cash receipts daily and automating invoice-to-cash tracking.
Start with a close checklist. List every account, report, owner, dependency, and due date. Assign responsibility for each section of the profit and loss statement and balance sheet. Use close tools within QuickBooks, NetSuite, or Xero where they fit your process.
Choose timely information over late perfection
A good early report with clearly marked estimates is more useful than a perfect report that arrives after the decision window. Set a target for preliminary reporting, then complete reconciliations and adjustments through a controlled review.
Track close time by month and discuss bottlenecks. Common problems include late job entries, missing receiving records, unreconciled bank accounts, delayed payroll data, and inconsistent revenue coding. Automate repetitive tasks only after the underlying definitions are clear.
A monthly close also creates the historical base needed for rolling forecasts, margin analysis, and KPI reporting. Without that foundation, every downstream model carries uncertainty that leadership may not see.
8. Create a Working Capital Playbook
Working capital is the cash tied up in receivables, inventory, and operating obligations. A working capital playbook combines the 13-week cash forecast, DSO management, inventory turns, and payable optimization into one leadership routine.
The sequence matters. First identify the largest cash drivers. A distributor may have excess inventory and weak vendor terms. A construction company may have retainage, unbilled work, and project costs paid before customer receipts. A professional services firm may have slow collections, low deposits, and invoices held until a project milestone.
Assign owners to the cash levers
Set weekly or monthly targets and discuss them in leadership meetings. Make each target operational:
- Receivables: Assign overdue invoices to named owners and track promised payment dates.
- Inventory: Separate fast-moving, slow-moving, and obsolete stock, then connect purchasing decisions to demand.
- Payables: Negotiate terms where supplier relationships and service levels allow it.
- Discounts: Calculate the cost and cash benefit of early payment before approving the program.
- Forecasting: Tie actions back to the rolling cash view so leaders can see when cash should improve.
The objective isn't to delay every payment or minimize inventory blindly. Those actions can damage supplier relationships, service levels, or customer experience. The playbook should protect operating capacity while releasing avoidable cash.
9. Automate FP&A and Integrate the Data
Financial planning and analysis, or FP&A, turns financial data into forecasts, performance reviews, and decisions. Automation helps when it removes repeated exporting, copying, and reconciliation between accounting, project management, HR, and inventory systems.
Start with the highest-impact connection. For many businesses, that means linking the general ledger to the KPI dashboard. Next, integrate the system that explains the most important variance. Construction companies may prioritize project management data. Distributors may prioritize inventory and freight. Services firms may prioritize timekeeping, staffing, and billing data.
A distribution company that automated inventory and margin feeds reduced manual analyst work, shortened the month-close lag, and responded faster when freight costs increased. The result came from faster visibility, not from adding a more complicated forecast.
Establish definitions before connecting systems
Agree on what counts as revenue, direct job cost, gross margin, active customer, billable utilization, and inventory on hand. If systems use different definitions, automation only moves inconsistent data faster.
Use managed connectors or vetted ETL tools where possible. Create monitoring and alerts for failed feeds, missing periods, duplicate records, and unexpected changes. Keep a clear data owner for each source system.
Automation should also cover workflow actions, not just reporting. For an adjacent example, see how teams automate spreadsheet approvals and status changes. The governing principle is simple. Automate repeatable work, but preserve human review for assumptions and decisions.
10. Manage Change Before Scaling Financial Practices
A new forecast, dashboard, close process, or incentive plan fails when people don't trust it or can't maintain it. Change management is therefore part of financial modeling best practices, not an afterthought.
Begin with one pain point and one pilot. A sales region might test a compensation plan that ties 20% of bonus to margin. A single business unit might pilot the 13-week forecast before the process expands across the company. The pilot should show how data is calculated, who updates it, and what decision the information supports.
Use a short, visible test cycle
Set a 90-day pilot period, define the expected behavior, and track outcomes. For the compensation pilot, review retention, margin change, and employee sentiment. For the cash pilot, monitor update completion, forecast variance, and the speed of management response to cash risks.
Transparency builds adoption. Show the formulas, explain the source data, and publish progress and wins. If the model changes, document why. Employees resist financial metrics when leaders use them as unexplained scorecards. They engage when the measures connect to decisions they can influence.
Scale only after the process works. Provide templates, training, ownership rules, and governance. A model that depends on one founder or analyst isn't a management system. It becomes durable when another trained person can update it, explain it, challenge assumptions, and improve the process.
Top 10 Financial Modeling Best Practices, Comparison
| Initiative | Implementation complexity | Resource requirements | Expected outcomes | Ideal use cases | Key advantages |
|---|---|---|---|---|---|
| Build a 13-Week Rolling Cash Flow Forecast | Moderate, setup 20–40 hrs, weekly upkeep | AR/AP data, accounting inputs, weekly owner time | Early detection of short-term cash gaps, fewer emergency borrowings | Project-based firms, seasonal cash swings, short-term liquidity management | High-frequency visibility, actionable timing insights |
| Margin Analysis by Customer, Job, or Project | High, detailed cost allocation and validation | Job costing, time tracking, historical cost data, analyst time | Identification of unprofitable customers/jobs, improved pricing and bids | Construction, services, manufacturing, distribution with varying job profitability | Reveals true profitability, enables repricing and portfolio decisions |
| Implement KPI Dashboards Tied to Financial Outcomes | High, BI integration and metric design | BI tool, connectors, data governance, 40–80 hrs initial | Real-time operational-to-financial visibility, faster corrective action | Growth-stage, PE-backed, firms needing operational-financial alignment | Visual, role-specific metrics; aligns teams and speeds decisions |
| Develop a Rolling 12-Month Budget and Forecast | Moderate, monthly updates and driver-based modeling | Historical data, FP&A time, scenario templates | Strategic monthly visibility, seasonality captured, better hiring/capex timing | Strategic planning, seasonal businesses, lender/investor reporting | Forward-looking monthly view; supports scenario planning |
| Align Compensation to Financial Outcomes | Moderate–High, design and pilot, change management | HR coordination, reliable financial metrics, pilot period | Better pricing discipline, improved margins and cash conversion | Sales-driven firms, companies needing behavior change to protect margin | Incentivizes profitability and cash, reduces perverse incentives |
| Track and Manage Days Sales Outstanding (DSO) | Low–Moderate, process and policy changes | AR aging, collections process, automation tools | Faster cash conversion, reduced working capital needs, fewer bad debts | Firms with long receivable cycles, retainage-heavy industries, distributors | High ROI on cash freed; direct impact on liquidity |
| Establish Clear Financial Reporting Standards & Monthly Close | Moderate, documentation and training | Controller time, standardized chart of accounts, close checklist | Faster, more reliable monthly financials, improved audit readiness | Companies with slow/inconsistent close, preparing for exit or audit | Consistency, fewer errors, quicker decision-ready reports |
| Working Capital Playbook (synthesis) | High, cross-functional coordination | AR/AP, inventory metrics, leadership cadence, tools | Material cash freed, reduced dependence on short-term financing | Mid-market firms needing holistic cash optimization | Holistic set of levers, prioritized measurable improvements |
| FP&A Automation and Data Integration (synthesis) | High, technical integration and governance | IT/consultants, ETL/connectors, BI platform, 40–120 hrs | Reduced manual reconciliation, near-real-time insights, faster close | Scaling firms with multiple systems and heavy manual reporting | Single source of truth, scalable FP&A, fewer errors |
| Change Management for Financial Practices (synthesis) | Moderate, governance, communication, pilots | Leadership time, training resources, pilot governance | Higher adoption rates, sustained benefit realization, faster ROI | Any org introducing new financial processes or incentives | Increases adoption, reduces resistance, captures lessons from pilots |
Turn the Model Into a Weekly Management Habit
A financial model earns its place when it changes what the leadership team does. The right sequence is practical: establish reliable reporting, build the 13-week cash view, create a driver-based 12-month forecast, analyze margin and working capital, connect KPIs to decisions, automate repeatable data flows, and pilot new practices before scaling them.
Keep governance visible. The widely cited benchmark that 88% of large spreadsheet models contain material errors is associated with Raymond Panko's research at the University of Hawaii and repeated in financial modeling guidance, including this overview of financial modeling best practices. The implication isn't that spreadsheets are unusable. It's that structure, validation, documentation, and review matter as much as formula skill.
Separate inputs, calculations, and outputs. Keep assumptions labeled and version-controlled. Add checks for reconciliations, missing data, unexpected variances, and broken links. A technically strong model can still mislead when assumptions are buried or formulas are inconsistent.
Historical discipline matters too. A common standard is to anchor forecasts to 3–7 years of historical data, using the shorter end for fast-changing businesses and the longer end for stable or cyclical firms. Good practice also recommends spending 40–60% of modeling effort cleaning and reconciling historical data before building projections, as explained in this guidance on incorporating historical data in financial modeling. Treat those conventions as starting points, then adjust for the quality and relevance of your records.
A hybrid architecture is often stronger than a single forecasting method. Combine management judgment, a statistical baseline, and a driver-based model, then back-test results with error measures such as MAD and RMSE. The AFP's top-line modeling guidance also notes that aggregated forecasts are usually more accurate, a useful consideration for multi-division businesses.
AI can support modeling, but it shouldn't replace auditability. BigFinanceBench reported a best system rubric score of 58.8% and final-answer accuracy below 45%. Other finance benchmarks reported that state-of-the-art models fail approximately 50% of professional tasks, while Finance Agent v2 leaders reached only 34.52% in Financial Modeling and 36.37% in Precedents. These results support explicit calculation chains, version-controlled assumptions, and independent sensitivity checks for capital decisions and exit planning. See the BigFinanceBench research for the benchmark details.
Your industry determines which drivers deserve priority:
- Construction: Focus on job costing, retainage, billing milestones, change orders, labor productivity, and project cash timing.
- Distribution: Focus on inventory turns, freight, vendor terms, order economics, fill rate, and customer profitability.
- Professional services: Focus on utilization, realization, scope control, milestone billing, staffing capacity, and DSO.
A further governance issue is upstream data quality. Recent guidance emphasizes modular structures, clear labeling, validation checks, data lineage, version control, and ERP-connected refresh cycles. That matters when external data is incomplete or time-series inputs are missing. More model sophistication won't fix unreliable source data. Often, the better decision is a smaller model with fewer key drivers and stronger controls, as discussed in this practical guide to financial model governance.
Scenario design also needs operating triggers. Don't stop at base, upside, and downside labels. Decide which signals move first, such as demand, labor availability, commodity costs, or collections behavior. Then link those signals to actions, such as slowing hiring, revising bids, changing purchasing, escalating receivables, or protecting borrowing capacity. This discussion of financial modeling under volatility highlights the shift toward dynamic assumptions, real-time feeds, and integrated sensitivity testing.
Complete a one-page cash diagnostic this week. Select the model improvement with the greatest likely effect on cash, margin, forecast reliability, or decision speed. If your leadership team needs embedded fractional CFO support for cash flow management, profitability improvement, forecasting, KPI reporting, or exit planning, AmbitionCFO can help build the operating cadence around the model.
AmbitionCFO provides fractional CFO support for founder-led businesses, including 13-week cash flow modeling, margin analysis, budgeting and forecasting, KPI dashboards, and exit planning. Visit AmbitionCFO to discuss the financial modeling practice your leadership team should improve first.