
You just signed off on three hires, the pipeline looks decent, and payroll still feels heavier than it should. That's the moment founders start asking the right question, is the business becoming more productive, or just more expensive to run? For a construction contractor, distributor, or professional services firm, Revenue per employee is the fastest way to pressure-test that question.
Used correctly, it's not a vanity ranking. It's a diagnostic lens on utilization, headcount mix, and pricing power. Used lazily, it turns into comparison bait that tells you almost nothing. The value is in the discipline, not the scoreboard.
Table of Contents
- Why Founders Get Fixated on Revenue Per Employee
- How to Calculate Revenue Per Employee the Right Way
- What Good Revenue Per Employee Looks Like in 2026
- Five Traps That Distort Revenue Per Employee
- Segmenting Revenue Per Employee to Find the Real Story
- Using Revenue Per Employee in Forecasting and Exit Planning
- A Sample Dashboard and Action Plan You Can Run This Quarter
- Your Next Move With Revenue Per Employee
Why Founders Get Fixated on Revenue Per Employee
A founder doesn't usually wake up caring about Revenue per employee because of theory. They care because they just approved a new project coordinator, the ops manager wants another admin, and the bank is asking what headcount does to cash flow. The number suddenly matters because payroll is now sitting right next to revenue on the same screen.
The first emotion is usually suspicion. “Are we overstaffed?” “Did I hire too early?” “Why doesn't the top line feel big enough for this many people?” Those are the right questions, because the ratio is really a way to check whether your labor structure still fits the book of business. The metric itself doesn't solve the problem, it tells you where to look.
For larger-company rankings, the spread is huge. VICI Properties comes in at about $142.6 million per employee, Rajesh Exports at about $307.1 million per employee, NVIDIA at about $4.41 million per employee, and McDonald's at about $172,800 per employee (OnDeck's ranking). That kind of spread is exactly why founders should not copy one benchmark and call it strategy. Business model, capital intensity, and labor mix drive the result.
Practical rule: if your business lives on labor, the ratio is telling you about staffing discipline, not just growth.
The other reason founders get drawn to it is timing. The ratio gets loud before a loan renewal, before a sale process, and right after a hiring wave. In all three cases, buyers and lenders want the same thing, proof that your labor base is producing enough revenue to justify itself.
What you should take from the metric is simple. It's a quick read on whether your company is building efficiency or building overhead. If the number is falling, don't celebrate top-line growth and ignore it. If it's rising, don't assume all is well until you check margin and mix.
How to Calculate Revenue Per Employee the Right Way
A founder can get the math right and still get the wrong answer. Revenue per employee = total revenue divided by employee count, but the useful version depends on whether you are measuring against a clean headcount or a messy operating reality. Use the same fiscal period for both inputs, and when staffing moves a lot, use average FTE count instead of a year-end snapshot, as noted by Vena Solutions. FTE means full-time equivalent, which is the cleanest way to normalize part-time staff and keep the ratio from overstating productivity.
The denominator is where founders usually get fooled. One company with $5 million in revenue and 50 employees lands at $100,000 per employee. Another with $3 million in revenue and 10 employees lands at $300,000 per employee (Great Place To Work). Same formula, different labor model, different conclusion. If you run construction, distribution, or professional services, that gap usually reflects utilization, headcount mix, or pricing discipline before it reflects raw growth.
Use the version that survives scrutiny
For FP&A work, I would use rolling 12-month revenue divided by average FTE headcount over the same period. That keeps hiring bursts, turnover, and seasonality from distorting the result. If contractors materially contribute to output, decide now whether they stay out of the formula or get tracked in a separate RPE+ view. If you skip that decision, you will compare one month's clean payroll to another month's delivery structure and end up arguing over the wrong number.
If your company spans currencies or entities, clean up the accounting first. A multi-entity accounting resource can help you standardize the inputs before you drop the ratio into a monthly pack, especially when revenue sits across different ledgers or locations. A useful starting point is NAS Ledger's multi-entity accounting guidance, because the problem is usually consistency, not arithmetic.
Controller note: use the same period, use average FTE, and decide how contractors are handled before you publish the number.
Simple worksheet to copy into your model
- Revenue line: trailing 12-month revenue from the P&L.
- Average FTE line: average headcount over the same period, not a point-in-time count.
- Contractor adjustment line: separate them if they matter, or note that they are excluded.
- Final ratio: revenue divided by the chosen headcount figure.
If your team separates FP&A from accounting, that split matters here. The people closing the books are not always the people turning those numbers into management decisions. A useful reference point is this FP&A vs. accounting breakdown.
The takeaway is simple. If the denominator is sloppy, the ratio is useless. If the denominator is clean, the ratio becomes a real operating tool.
What Good Revenue Per Employee Looks Like in 2026
A revenue per employee number only helps if you use it as a diagnostic, not a trophy. For founder-led businesses in construction, distribution, and professional services, the question is simple. Are you getting enough output from the labor mix you have, or are you carrying too much support headcount for the revenue base you've built?
Industry benchmarks are useful only when they match the business model. A broad U.S. average has been reported at about $111,000 per employee, while capital-light and software-heavy segments can run far higher, including entertainment software at $1.76 million, real estate development at $1.42 million, and brokerage/investment banking at $1.3 million per employee (Vena Solutions). That spread is the point. If you compare a labor-heavy services company to a software or finance business, you are comparing two different operating engines.
For founder-led companies that live closer to labor delivery than code, the more useful test is the band that fits the structure. Published benchmark ranges for businesses in the $10M to $40M ARR range put median RPE around $200k to $300k, top quartile at $350k to $500k, and exceptional performance at $500k to $750k or higher (HR Bench). That is the lens I would use with a construction owner, a distributor, or a professional services firm. The point is not to turn those businesses into SaaS. The point is to see whether pricing, utilization, and headcount mix are pulling their weight.
Revenue Per Employee Benchmarks by Industry and Band
| Segment | Median RPE | Top Quartile | Exceptional |
|---|---|---|---|
| Broad U.S. average | About $111,000 | Not stated | Not stated |
| Entertainment software | $1.76 million | Not stated | Not stated |
| Real estate development | $1.42 million | Not stated | Not stated |
| Brokerage and investment banking | $1.3 million | Not stated | Not stated |
| Private SaaS | $129,724 in 2025 | Not stated | Not stated |
| $10M to $40M ARR founder-led businesses | $200k to $300k | $350k to $500k | $500k to $750k+ |
Private SaaS reported a median of $129,724 in 2025, up from $125,000 the prior year. That matters because even modest efficiency gains can move the ratio enough to change how investors talk about the business. It does not mean a construction or distribution company should chase SaaS-like numbers. It means the benchmark has to match the labor model, the pricing model, and the amount of delivery work that still sits inside payroll.
A ratio by itself can still fool you. High revenue per employee can come from tight pricing and high utilization, or from underinvesting in support until the team starts breaking. Low revenue per employee can reflect bloated overhead, but it can also show a business that keeps more bench strength, more technical depth, or more customer service capacity than a leaner peer. If you want the number to say anything useful, read it beside margin, utilization, and headcount mix. For a clean way to keep those inputs aligned, use a financial reporting best practices checklist before you start comparing businesses.
Read the band, not just the number
- Below median: Usually points to weak pricing, low utilization, or too much support staff for the revenue base.
- At median: Acceptable, but not automatically healthy. Margin still decides whether the business can absorb a bad month or a slower quarter.
- Above median: Usually signals strong pricing or strong utilization, but it can also hide burnout or too little investment in support.
A cross-industry average around $350k per employee has also been reported, but that figure gets pulled up by capital-light digital businesses and pulled down by labor-heavy sectors (HR Bench). I would not use it to run a founder-led services or distribution company. I would use it to keep the owner focused on the same question every month, are we getting better output from the same labor structure, or are we just looking good because the comparison set is wrong?
Five Traps That Distort Revenue Per Employee
A bad read on Revenue per employee usually starts with the wrong comparison. A founder-led construction firm, a distributor with inventory on the floor, and a professional services shop with a large bench do not produce the same ratio for the same reasons. If you compare them like-for-like without context, you end up judging the wrong operating model.
The next mistake is treating the ratio like a profit line. A business can post a strong number and still bleed margin through discounting, overtime, or underpriced work. A lower number can still be healthy if the team is carrying the right support load and the pricing holds up.
The right move is to use the metric as a diagnostic. When the number shifts, ask what changed in utilization, headcount mix, pricing, or contract quality before you do anything else.
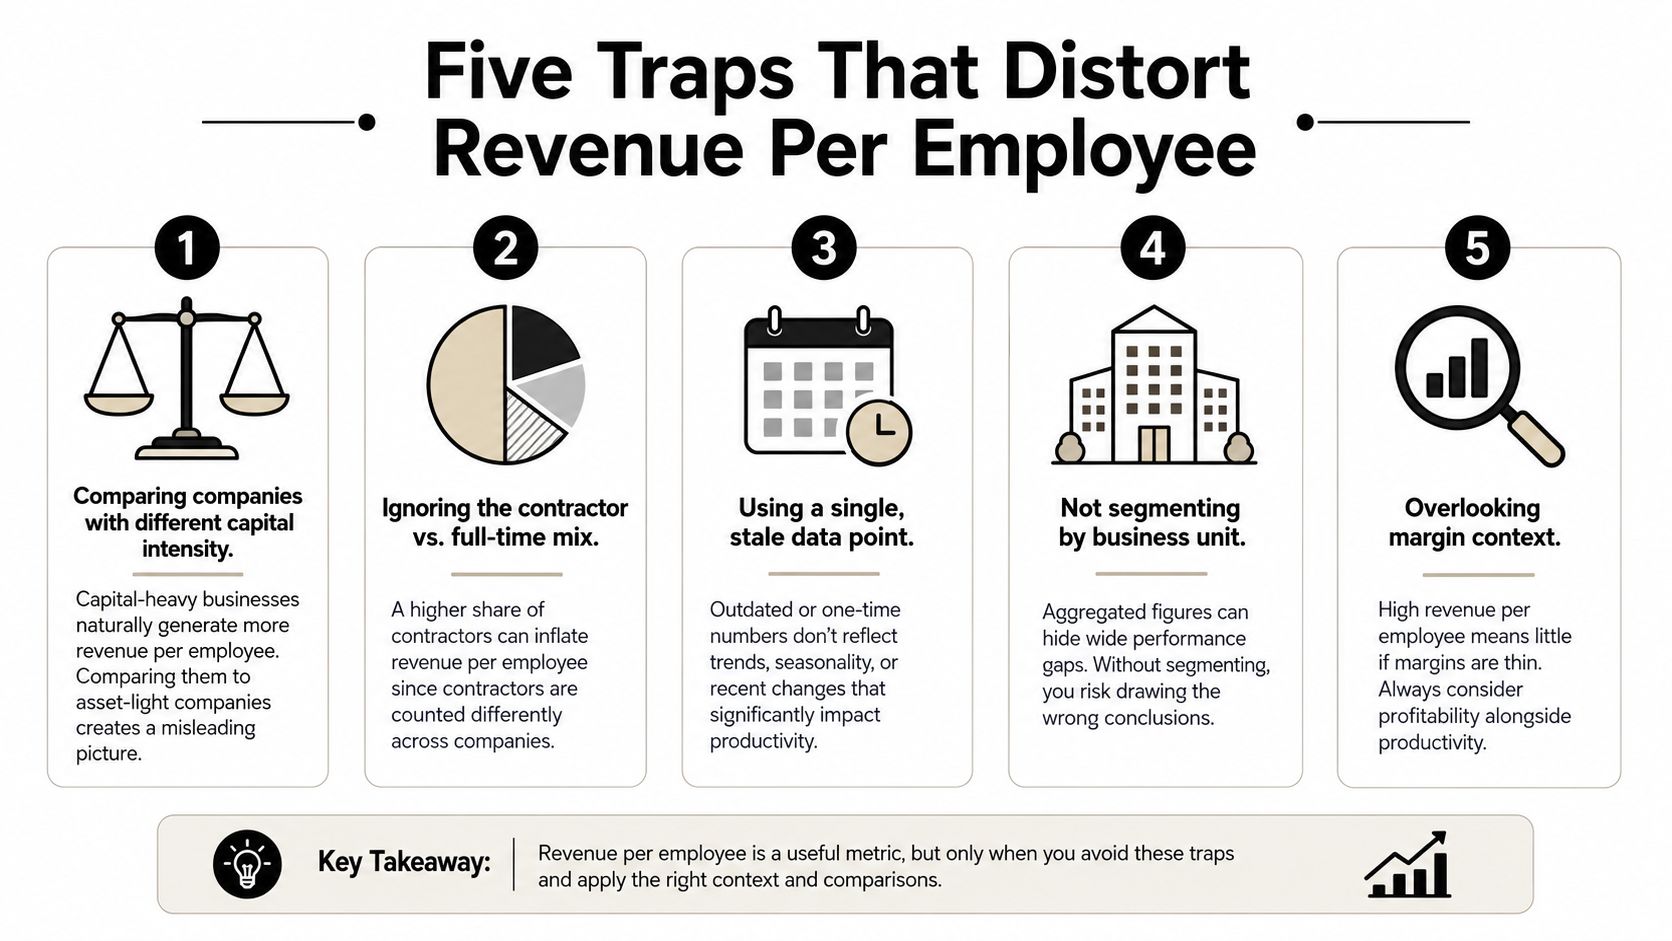
Five traps that distort the read
- Comparing different capital intensity. A firm with equipment, inventory, or other fixed assets will not behave like a software-heavy company. The right comparison is against businesses with a similar labor model and asset structure, not a flashy ranking.
- Ignoring contractor mix. If contractors are doing real delivery work, a headcount-only denominator inflates productivity. Decide whether they belong in the ratio or in a separate view, then stay consistent.
- Using one stale data point. A single month or year-end snapshot can hide a real trend. Use a rolling 12-month view and average FTE so the number reflects how the business ran.
- Skipping business-unit segmentation. A strong division can mask a weak one. Break the metric by segment before you draw conclusions, and keep the analysis tied to financial reporting best practices so the inputs stay clean.
- Leaving out margin context. Revenue without margin tells you very little. If pricing is sloppy or delivery costs are drifting, the ratio can look fine while cash flow gets worse.
The public-company comparison trap is the easiest one to fall into. Rajesh Exports shows about $307.1 million per employee in a large-company ranking, but that number is driven heavily by business model and capital intensity (OnDeck's ranking). It is interesting. It is not a serious benchmark for most private founder-led companies.
The practical correction is simple. Benchmark like for like, measure over a clean period, and never read the ratio without margin. In contractor-heavy services, distribution, and construction, pair the metric with utilization, pricing discipline, and the mix of direct labor versus support staff. If the ratio moves, one of those levers moved first, and that is where the work starts.
Segmenting Revenue Per Employee to Find the Real Story
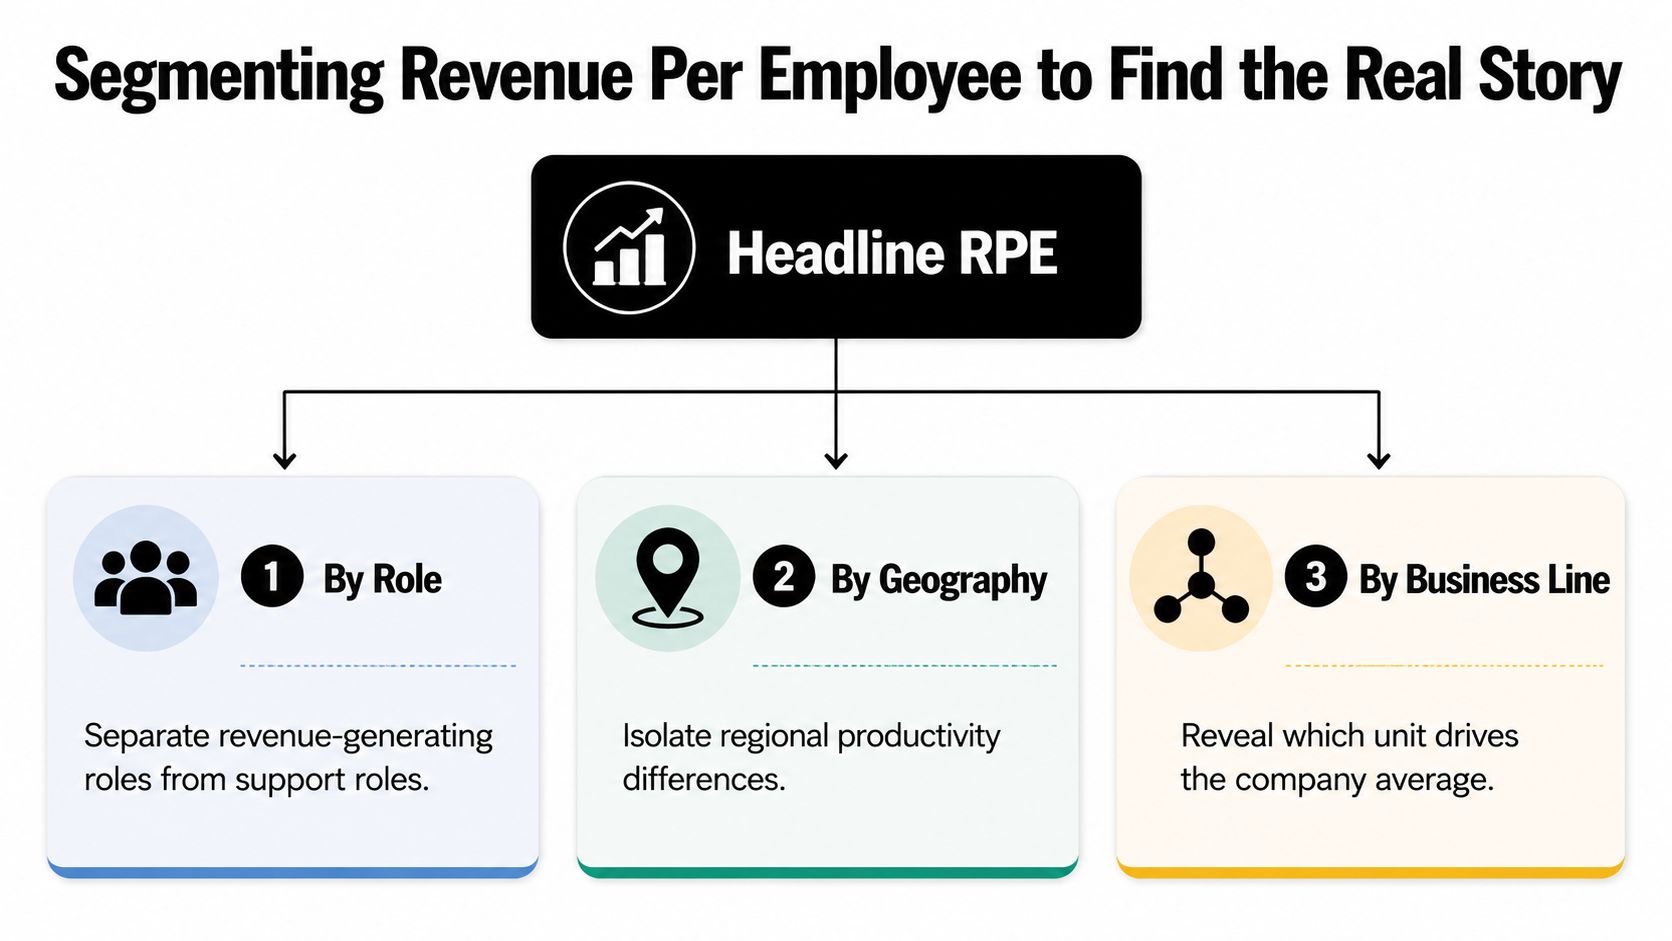
Headline Revenue per employee is usually too blunt to manage by itself. The story shows up when you split the business by role, business unit, and, in project-based firms, by job. That's where you see whether the issue is delivery, support, or pricing.
Start with the people who generate revenue
Separate revenue-generating headcount from support headcount. In a professional services firm, that means pairing client-facing staff against the back-office team. In distribution, it often means looking at sales and warehouse labor separately from admin overhead. If the support side is growing faster than the productive side, the company may be building coordination instead of output.
Then isolate the profitable unit
Split the metric by business line. One service line can drag the company average down while another carries the load. If the average looks fine but one division is weak, you have a pricing or utilization problem inside the segment, not in the whole company. That's where a contract revenue loss analysis can be useful, because weak contract discipline often shows up as revenue leakage before it shows up in the P&L.
Use the project lens where work is job-based
For construction and job-heavy distribution models, pull the ratio by project or job. A job can look productive on the top line and still be a drag once you account for supervision, rework, or support time. If one project type consistently produces weaker output per labor dollar, that's a pricing problem or a scope-control problem, not a headcount problem.
AmbitionCFO's metrics every business owner should track belong in the same conversation, because this ratio only tells the truth when it sits next to margin and operating trend lines.
The practical workflow is simple. Start with headline RPE, split by role, then by business line, then by project where relevant. You'll usually find the company average was hiding one weak operating pocket. That's the pocket to fix first.
Using Revenue Per Employee in Forecasting and Exit Planning
A forecast without a productivity assumption is a guess dressed up as finance. Revenue per employee gives leadership a concrete operating target, which is exactly what belongs in a rolling forecast and a 13-week cash flow model. If headcount rises faster than the ratio can support, cash pressure usually shows up long before the year-end P&L does.
In a 13-week cash flow model, the ratio helps set the hiring pace. If the business adds labor ahead of revenue, the model should show the working-capital drag immediately. In a rolling 12-month forecast, it becomes the assumption around which management commits to delivery, utilization, and pricing discipline. That makes the conversation specific instead of aspirational.
Buyers read the metric differently. In a CEPA-style exit conversation, they'll look at normalized productivity, headcount add-backs, and synergy potential. If your segmentation is clean, you can explain which labor is required and which cost bucket is just legacy inefficiency. That makes the story easier to defend during diligence.
A clean operating narrative matters if you're planning to transition in the next few years. AmbitionCFO's exit planning for business owners fits here because exit value is rarely about one number. It's about whether your productivity, margin, and reporting can survive a buyer's model without excuses.
Owner rule: if you can't explain why headcount moved and revenue followed, a buyer will assume the business is less durable than it looks.
The best use of the ratio in exit planning is not to brag about a high number. It's to show that the company knows how labor turns into revenue, and that the process is repeatable. Buyers pay for repeatability. Lenders like it too.
A Sample Dashboard and Action Plan You Can Run This Quarter
Your dashboard should not be fancy. It should answer five questions fast. Start with headline Revenue per employee, then add RPE excluding contractors, RPE by business unit, RPE trend over six quarters, and a margin overlay so productivity never gets read alone. If a tile can't be reviewed in under a minute, it's probably too busy.
For the data source, pull revenue from the P&L, headcount from payroll or HR, and contractor totals from AP or project accounting if they materially affect delivery. Review it monthly, but only make decisions on the trend, not one noisy month. If you want the visualization side to work cleanly, a guide on how to build a powerful BI dashboard is a practical reference point.
The action plan is blunt.
- Calculate baseline. Lock the rolling 12-month ratio and average FTE.
- Segment data. Split by business unit and contractor treatment.
- Review quarterly. Tie changes to utilization, pricing, and hiring.
Use the dashboard to answer one question only, where is headcount growing faster than revenue quality?
The action items for founders are equally direct. Tighten utilization on underused teams. Reprice the bottom tier of customers. Automate support workflows where labor is getting eaten by admin drag. And stop approving hires until the productivity hurdle is visible in the model. If you need a companion model, AmbitionCFO's projected sales forecast template pairs well with this dashboard.
Your Next Move With Revenue Per Employee
Pull the last 12 months of revenue, calculate average FTE, and add your current margin overlay. Then book a 30-minute working session with your controller or CFO to decide whether the issue is utilization, pricing, or headcount mix. If you do only that, you'll have a better read on the business than most owners do.
That's also where a fractional CFO earns their keep. AmbitionCFO works inside the operating team on cash flow modeling, KPI dashboards, margin analysis by job or client, budgeting and forecasting, and Certified Exit Planning for owners thinking about a transition inside the next few years. The point isn't more reports. It's better decisions.
If you want a sharper read on your labor's efficiency, go to AmbitionCFO and start a conversation about your current headcount, margin, and forecast. We'll help you turn Revenue per employee from a vanity metric into a decision tool you can run the business on.