

Your revenue can be up and your bank account can still feel tight. That usually means you've got a margin problem, not a sales problem. The business is working harder, the team is busier, and the numbers still don't look healthy because the wrong customers, jobs, or products are soaking up profit.
That's the question owners need answered. Not, “How do I sell more?” but, “Which revenue is worth keeping, which needs repricing, and which should go away?” If you run a founder-led business in construction, distribution, or professional services, that question gets expensive fast when discounting, freight, labor, and overhead creep in.
Table of Contents
- Why Your Revenue Is Growing but Margins Stay Flat
- The Four-Phase Margin Diagnostic Workflow
- Profit-Quality Segmentation by Customer and SKU
- Pricing Discipline and Cost Control Levers
- Financial Modeling and KPI Dashboards for Margin Tracking
- Your 90-Day Margin Improvement Roadmap
- Take Your First Step Toward Stronger Margins Today
Why Your Revenue Is Growing but Margins Stay Flat
A lot of owners live this exact story. A distribution company lands more business, the sales team celebrates, and then the month-end close shows the same weak profit as before. Freight is up, discounts are deeper, and a handful of accounts are carrying the volume while dragging the margin down.
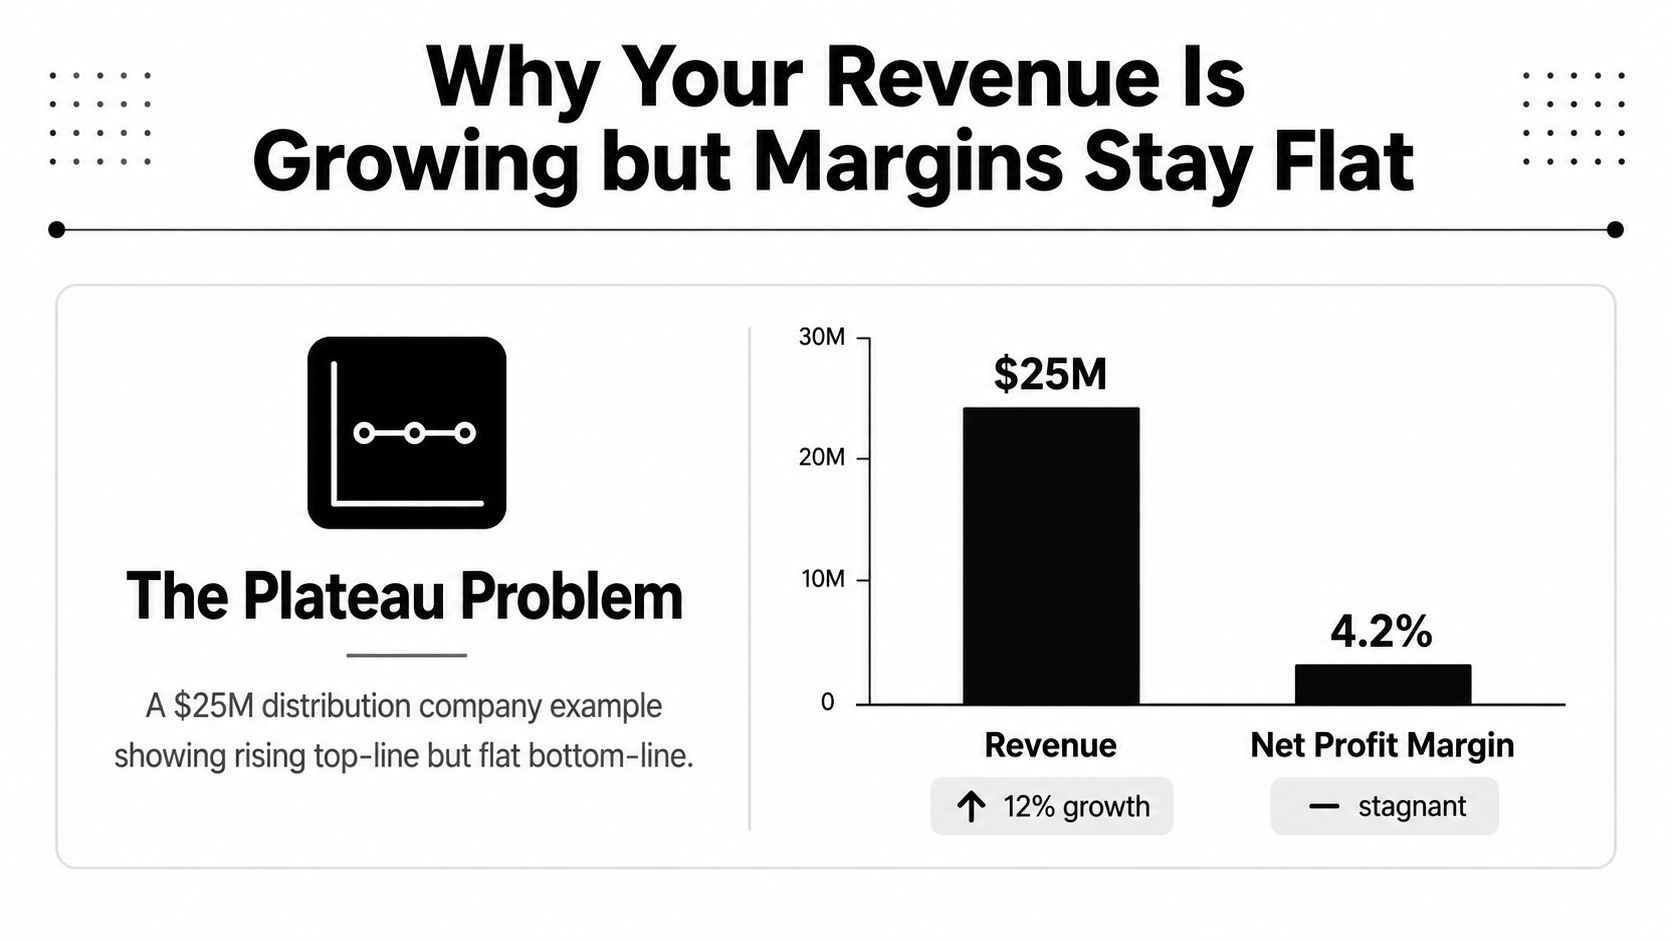
That's the plateau problem. Revenue moves, but profit doesn't.
Use a benchmark that tells the truth
A practical rule of thumb in business finance is 5% is low margin, 10% is healthy, and 20% is high. That benchmark gives you a quick read on whether pricing, cost structure, or product mix is moving the business in the right direction, and it's especially useful for businesses that need to compare performance across time, peers, or product lines (Brex).
Margin is normalized to revenue, which is why it's so useful. A 10% net margin means you keep $0.10 of every $1 of revenue after all expenses. A 20% margin means you keep $0.20 of every $1. That makes margin one of the few metrics that stays meaningful whether you're looking at a small shop or a multi-location operation.
The power is in the math. A 1 percentage-point margin increase on $20 million of revenue adds about $200,000 in annual profit (Brex). That's enough to fund hiring, reduce debt, or finally put cash behind growth instead of hoping growth fixes the cash problem.
Practical rule: if revenue rises but net margin stays flat, you're not scaling profit. You're scaling complexity.
Know which margin you're actually chasing
Owners often say they want to improve “profit margins,” but they don't define the margin. That's a mistake. Gross margin tells you how efficiently you produce or buy the thing you sell. Operating margin tells you whether overhead is under control. Net margin tells you what's left after everything hits the P&L.
The benchmark matters even more in businesses where overhead, labor, freight, and discounting can erode profits fast. Construction, distribution, and professional services all have different economics, but they share the same problem, weak visibility into where profit is being lost. Once you know your current margin against the benchmark, you can stop guessing and start diagnosing.
For a growing business with flat margins, the first question is simple. Are you underpricing, over-discounting, carrying too much overhead, or selling too much low-quality revenue? If you don't know, you don't have a margin strategy yet.
A good next move is to review the hidden drivers behind rapid growth and cash strain in the forecasting guide for growing businesses. Growth without margin discipline usually just creates a bigger version of the same problem.
The Four-Phase Margin Diagnostic Workflow
A price increase is the last move, not the first one. Start by finding where margin is leaking, or you will raise rates in the wrong places and irritate the wrong customers.
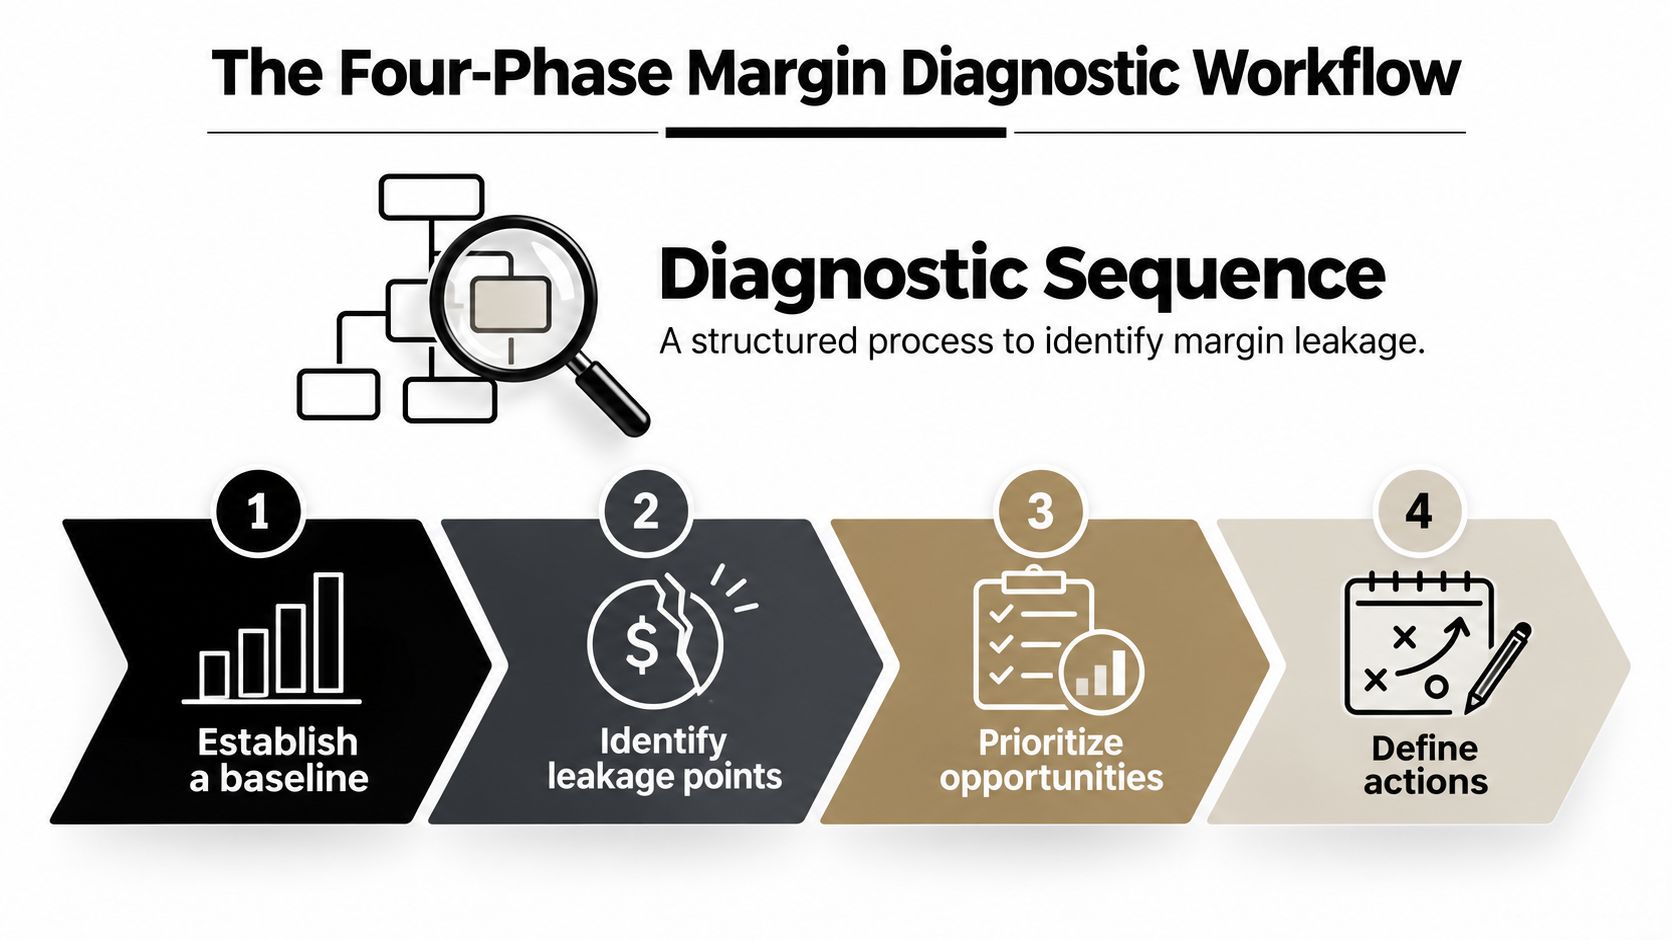
Phase one and two, establish the baseline and find the leak
Build the baseline first. Pull the last twelve months of revenue, gross profit, overhead, and net profit, then break those numbers out by business line, customer group, or project type. If the business runs on projects, compare budgeted costs with actuals on recent jobs. That is the only way to tell whether the quote was disciplined or just hopeful.
Then run the cost audit. Look for overhead leaks, supplier creep, labor overruns, and recurring discounts. The goal is not a thick report. It is to isolate the few places where margin disappears every month. For the variance review, use budget vs actual variance analysis as the backbone of the work.
Construction and professional services need full-cost estimating. Include materials, labor, overhead, and owner time. Leave any of those out, and the estimate is fiction. You are not measuring profit, you are guessing at it.
Phase three and four, sort the mix and change the pricing
After the cost audit, examine the mix. Which services, job types, customers, and SKUs contribute real profit? Which ones look busy but fall apart once full cost is loaded in? Owners usually discover that their “best” revenue is not their best revenue at all.
Then change pricing and review the KPIs. Raise prices where the work earns it, re-scope weak jobs, and cut the segments that keep draining management time without paying for it. The common mistake is changing price before knowing which jobs, customers, or SKUs are profitable. That creates churn, weakens trust with the wrong accounts, and leaves the margin leak in place.
Margin work gets easier when you stop treating every sale the same. A weak account, a weak SKU, and a weak project are not the same problem.
A simple checklist keeps the work moving:
- Baseline: Gather revenue, gross profit, overhead, and net profit by segment.
- Cost audit: Review labor, freight, supplier pricing, and unbilled time.
- Mix analysis: Rank jobs, customers, and products by contribution.
- Action plan: Reprice, re-scope, or remove the worst performers.
If you need a cleaner standard while you work through the numbers, financial reporting best practices gives you the reporting discipline needed to make the results decision-ready.
Profit-Quality Segmentation by Customer and SKU
The work gets real. Generic advice tells owners to raise prices or cut costs. That's not enough. You need to know exactly which customers, jobs, channels, and SKUs are creating good profit quality and which ones are just creating noise.
Separate profitable revenue from busy revenue
A top line can look healthy while the business bleeds. Underpriced jobs, rush orders, excessive support, and complicated customers all hide inside “good” revenue. That's why reviewing net profit by product, channel, and customer segment matters more than staring at gross margin alone. The same logic applies to evaluating downstream customer value, not just front-end volume (Partner Colorado CU).
Use a simple rule. If a segment requires more management time, more service recovery, or more concessions than it earns back, it's not high-quality revenue. It may still be revenue, but it's not the kind that deserves your best attention.
For construction owners, that often means certain job types or customers create margin drag because of change orders, site delays, or poor scope control. If you need a deeper job-costing lens, construction job costing is the place to tighten the estimate-to-actual loop.
Use a decision matrix, not gut feel
A revenue segment decision matrix forces discipline. It strips emotion out of the conversation and makes the next move clear.
| Segment | Margin Profile | Revenue Volume | Recommended Action |
|---|---|---|---|
| Premium repeat customer | Strong contribution, low rework | Moderate to high | Keep and protect |
| Large account with heavy support | Thin after labor and concessions | High | Reprice or re-scope |
| Small job with unpredictable overruns | Weak and volatile | Low to moderate | Fix the estimate or exit |
| SKU with slow turnover | Ties up capital | Low | Reduce or eliminate |
| Channel with discount pressure | Weak net result | Moderate | Reprice or restrict |
Product mix becomes a cash decision. In distribution, there's a blunt but useful cutoff. Any SKU with under 2 turns annually is tying up capital and should be reduced or eliminated (Investopedia). If a product doesn't move fast enough, it eats cash, storage, and attention.
Keep, reprice, or exit
Owners usually know which accounts are noisy. They just haven't named them. The matrix gives you a way to decide whether a customer, job, or SKU deserves a better price, a tighter scope, or a polite goodbye.
- Keep: High contribution, manageable support, predictable execution.
- Reprice: Good volume, weak margin, but worth saving if the customer fit is strategic.
- Exit: Low contribution, recurring overruns, or excessive operational drag.
That decision is uncomfortable, but it's also the fastest way to improve profit quality without hoping the whole market gets easier. Revenue is not the goal. Good revenue is the goal.
Pricing Discipline and Cost Control Levers
Once you know what to keep, you can move the numbers with purpose. The strongest margin programs do not start with a full pricing reset. They start with a controlled test, tighter approval rules, and a clear decision to stop subsidizing poor accounts, weak jobs, and slow-moving SKUs.
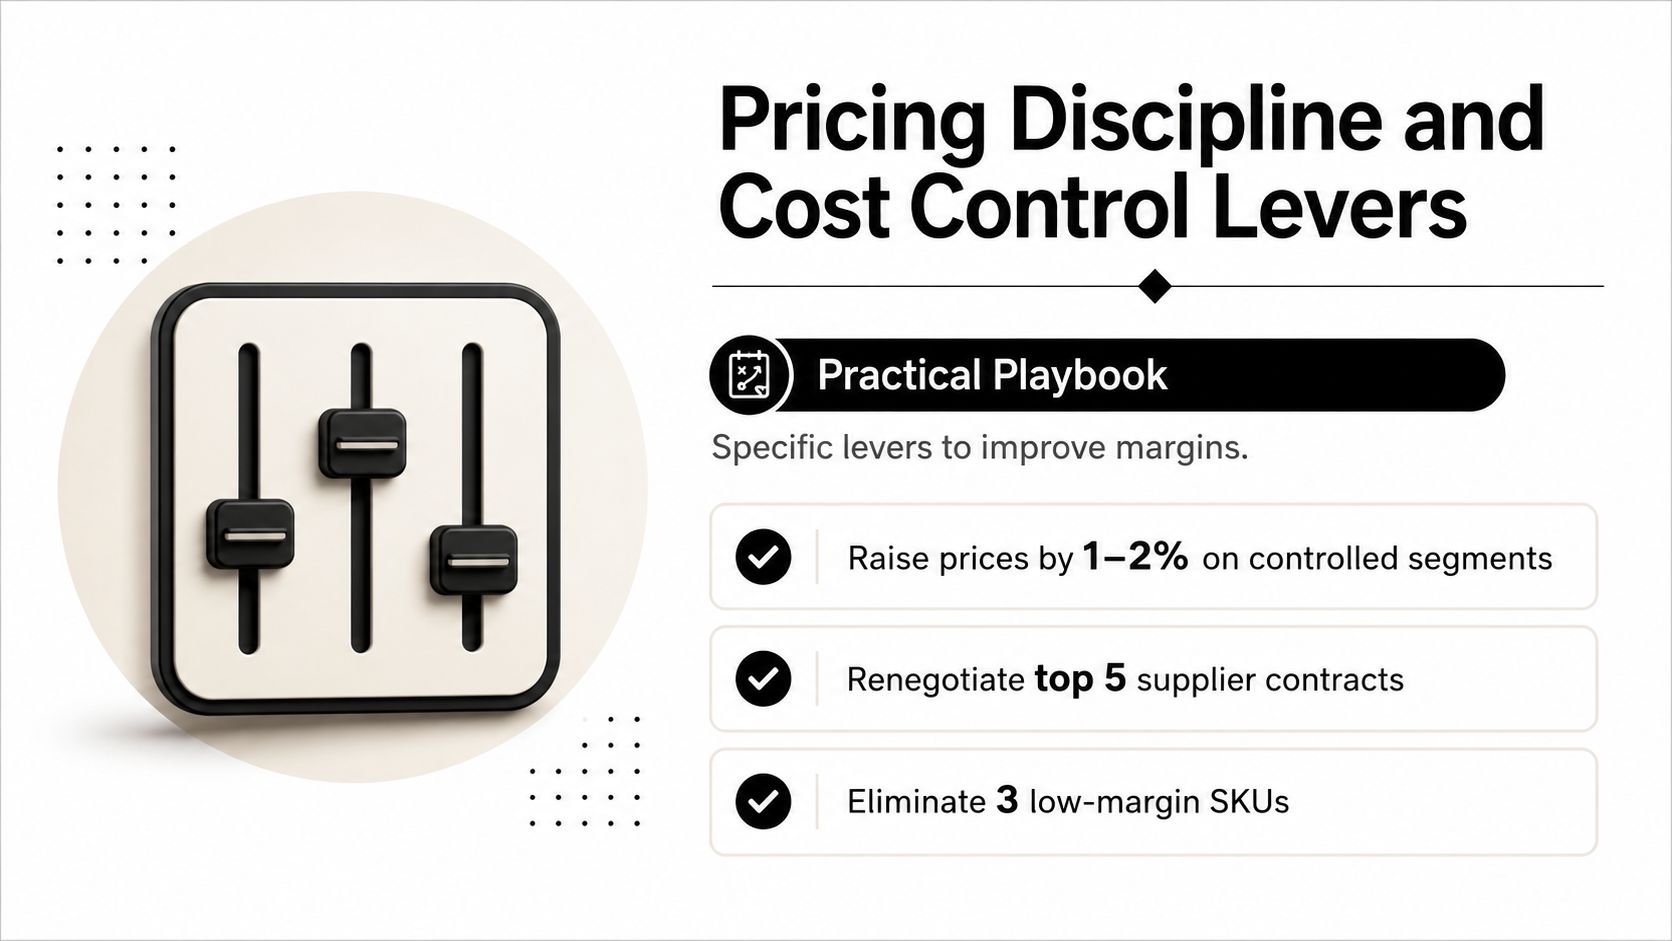
Start with small price moves and tighter discount rules
Raise prices on a narrow set of products or customers first. Keep the move controlled, then tighten discount approvals so margin leaks are visible instead of buried. The goal is to protect contribution where the business already has proof of demand, then improve cost of goods through supplier talks, volume commitments, or cleaner purchasing discipline.
Do not push price across everything at once. Start with the segment that has steady demand, manageable competition, and low operational noise. If customers push back, explain the value change directly. Better service, better availability, faster turnaround, or cleaner scope all support a justified increase.
Project-based businesses need the same discipline on the front end. Build contingencies into estimates wherever historical variance keeps showing up, because under-counted indirect costs will erase profit. A job can look healthy on paper and still lose money once labor spillover, coordination time, and overhead are fully loaded.
Owner rule: if you cannot defend the estimate with full costs, you do not have a quote. You have a risk transfer.
Use a 30, 60, 90-day cadence
The first 30 days are for control. Put a daily dashboard in place that shows margin by product and channel, tighten discount approvals, and flag the worst offenders. In the operational playbook behind this approach, the bottom 5% of negative-contribution SKUs get eliminated or repriced, because they consume resources without paying for themselves (Cleverence).
During days 31 to 60, push supplier negotiation and cost cleanup. Work vendor terms, review freight charges, and look for order-volume commitments that reduce COGS. If process waste is part of the problem, streamline operations with Cloudvara to reduce friction and surface cost reduction opportunities without losing visibility.
By days 61 to 90, review the segments that responded. Keep the pricing changes that held. Roll back the ones that failed. Then make the margin review part of normal management, not a rescue project that only appears when cash gets tight.
Match the lever to the problem
Different problems need different fixes. If discounting is the leak, price discipline matters more than supplier renegotiation. If freight or materials are spiking, COGS control is the cleaner lever. If projects keep overrunning, estimate quality beats broad cost cutting every time.
That is the question owners need to answer. Protect the revenue you should keep, push the cost structure where it matters, then force the weak parts of the business to earn their place or leave. For teams that want tighter reporting discipline around those decisions, financial reporting best practices help keep the process consistent and decision-ready.
Financial Modeling and KPI Dashboards for Margin Tracking
Margin improvement disappears fast when owners stop looking at the right numbers. You do not need a huge dashboard. You need a tight set of metrics, updated on a fixed rhythm, that shows whether the business is improving or just staying busy.
Track a handful of KPIs and tie them to action
A workable margin dashboard runs on 3 to 5 core KPIs tracked monthly. For most founder-led businesses, that means gross margin, operating margin, net margin, and one or two segment-level contribution metrics. Keep the reporting package consistent by following the discipline in financial reporting best practices, so managers see the same definitions every month and can act on them without debate.
The dashboard should answer plain questions. Which customer segment is improving? Which product line is slipping? Which jobs are getting more profitable and which are getting worse? Those are management questions, not accounting questions.
A 13-week cash flow model belongs next to the margin dashboard, not in a separate drawer. It links profitability to timing, which is where a lot of stress hides. A business can be profitable on paper and still get squeezed by collections, payroll timing, or supplier terms. If you need a working reference, calculate cost per lead is a useful model for thinking in contribution terms, even outside marketing.
Build scenario models before you make moves
A good model should answer simple “what if” questions. What happens if freight costs rise? What happens if you lose a key customer? What happens if volume falls but price sticks? Those are not academic questions. They are the decisions owners face.
Use a margin waterfall to show exactly where profit is gained or lost between budget and actuals. That lets you isolate the problem instead of arguing over the whole P&L. It also makes the conversation with managers clearer, because you can assign accountability to the exact driver that moved.
A clean monitoring system usually includes these roles:
- Owner or CEO: Reviews the monthly margin story and approves major pricing moves.
- Finance lead or fractional CFO: Maintains the model, dashboard, and scenario assumptions.
- Operations lead: Owns labor, throughput, freight, or job execution drivers.
- Sales lead: Owns discounting, pricing discipline, and customer mix.
For businesses thinking about succession or exit, consistent margin tracking matters beyond the monthly close. Buyers and successors pay for businesses that know their numbers and can prove improvement over time. Sloppy reporting creates doubt, and doubt lowers confidence.
Practical rule: if a metric does not trigger a decision, it does not belong on the dashboard.
Your 90-Day Margin Improvement Roadmap
A margin plan only works if somebody owns the next 90 days. The goal is not to “improve profitability” in the abstract. The goal is to finish a quarter with better visibility, better discipline, and a cleaner revenue mix.
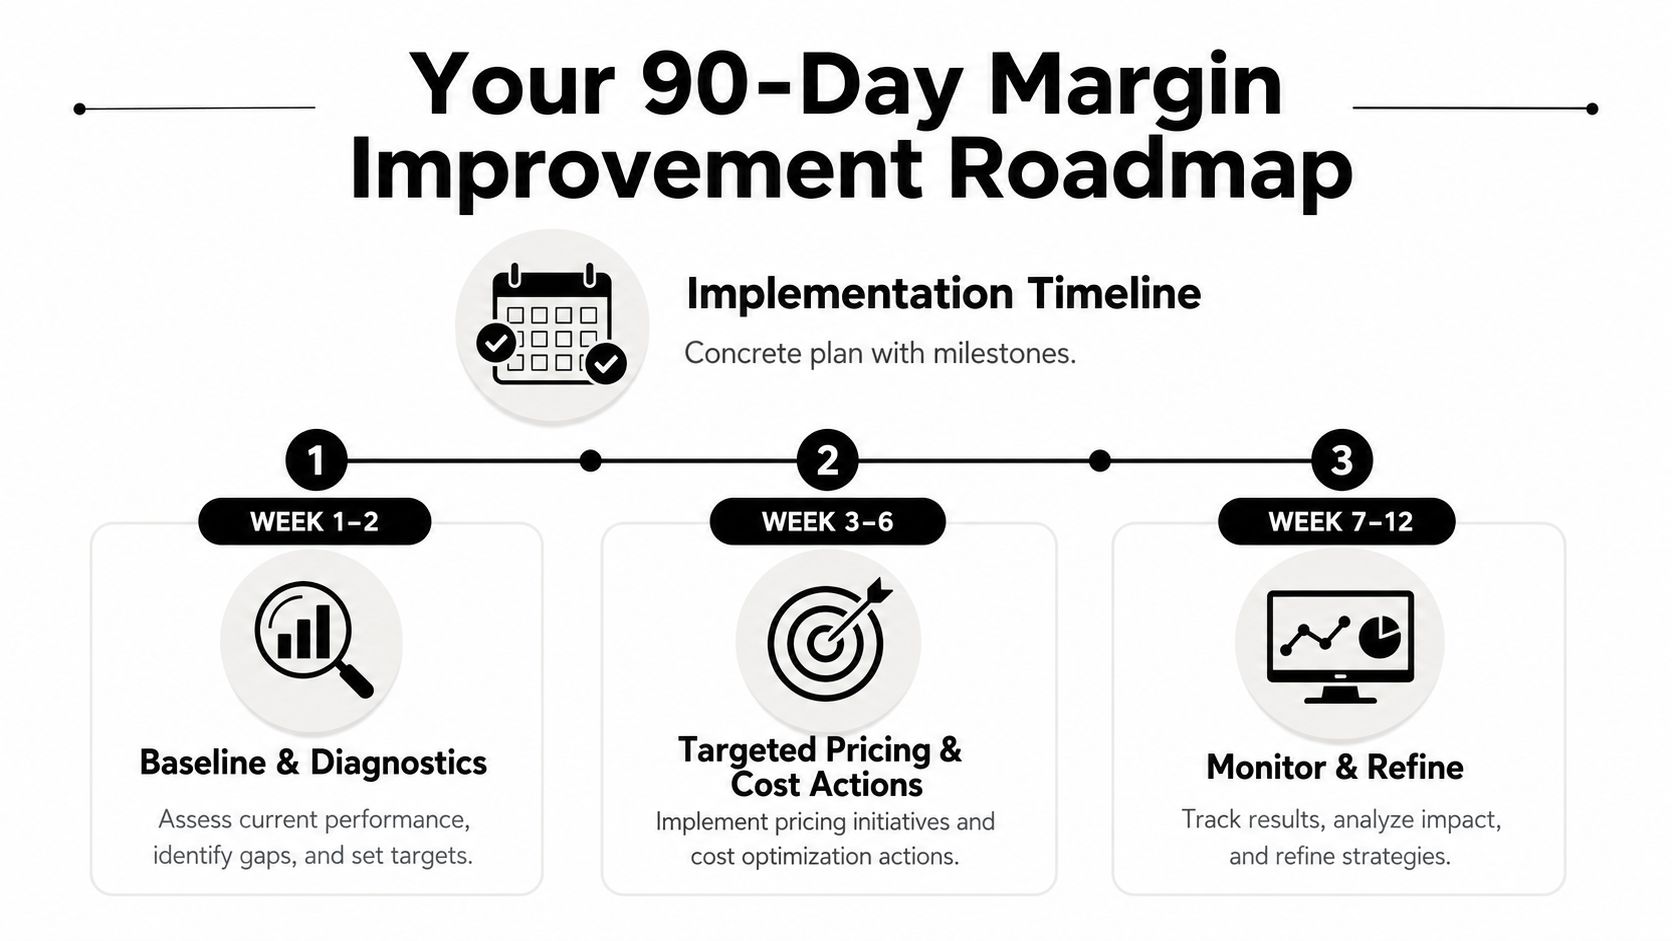
Weeks one through four, get the facts
Week 1 and 2 are for baseline and data gathering. Pull margin by customer, job, SKU, and channel. Assign someone to clean the data and document the gaps. If the data is weak, say so now instead of pretending the numbers are precise.
Week 3 and 4 are for the cost audit and profitability analysis. Review the biggest leaks, rank the weakest segments, and identify the decisions that need to be made. Product data hygiene matters here, especially if you manage a large catalog. If that's you, optimize product data with NanoPIM can help you think about cleaner item-level visibility and better product-level reporting.
The go/no-go standard for this phase is simple. If you can't name your worst-performing customer group or SKU class, you're not ready to change price yet.
Weeks five through twelve, act and monitor
Weeks 5 to 8 are for pricing changes and supplier negotiations. Start with the cleanest targets first, the segments most likely to accept a reprice without relationship damage. Use the savings or price lift to support the segments that deserve more investment.
Weeks 9 to 12 are for dashboard implementation and monthly reviews. Lock in the cadence. Review the scorecard. Track what changed. If the same weak segments still show up, the business hasn't finished the job yet.
A simple ownership map keeps the roadmap moving:
- Finance: Builds the margin model and tracks actuals.
- Operations: Fixes execution problems and estimate accuracy.
- Sales: Manages pricing discipline and customer conversations.
- Leadership: Makes the hard calls on repricing and exits.
If cash timing is part of the pressure, a 13-week view helps you see whether the margin work is translating into liquidity. A good reference is the 13-week cash flow framework, because profit improvement without cash visibility is still an incomplete plan.
Make the worksheet simple
Print one page. Put the top 20 customers or SKUs on it. Mark each one keep, reprice, or exit. Then assign a date and an owner. That's enough to start. You don't need a committee to tell you that a weak account is weak.
The businesses that win here are not the ones with the prettiest strategy decks. They're the ones that make small, measurable changes and keep score long enough to see the pattern.
Take Your First Step Toward Stronger Margins Today
The fastest way to improve profit margins is to stop treating all revenue the same. Run a profit-quality segmentation on your top 20 customers, jobs, or SKUs and sort each one into keep, reprice, or exit. That one exercise will show you where the business is making money and where it's just staying busy.
If you need senior-level help to build the analysis, model the cash impact, and turn the numbers into action, AmbitionCFO works with founder-led businesses on margin analysis, 13-week cash flow modeling, KPI dashboards, and financial forecasting. That's the right toolset when your business has outgrown basic bookkeeping but doesn't need a full-time CFO.
AmbitionCFO helps founder-led businesses make cleaner margin decisions with job, client, and product-level analysis, cash flow modeling, and practical KPI reporting. If you want a sharper view of which revenue to keep, reprice, or eliminate, visit AmbitionCFO and schedule a margin conversation.