

Your P&L says you're profitable. Your bank balance says you're one bad week away from a problem.
That's the spot a lot of founders hit in the $10M to $100M range. The business is real. Revenue is real. Jobs are moving, trucks are rolling, inventory is turning, and customers are buying. But payroll is due Friday, a supplier wants to be paid earlier than usual, and you're trying to decide whether you can afford a new hire, a piece of equipment, or a bigger inventory buy.
If you run a construction company, you might have strong billings and still wait too long for collections to hit. If you run distribution, you might land a big order and immediately feel pressure because cash has to leave before it comes back. That disconnect is where founders start making expensive decisions from instinct instead of visibility.
A 13-week cash flow forecast fixes that. It turns scattered accounting data into a weekly view of what cash is expected to do, not what the P&L hopes it will do.
Table of Contents
- Why Your P&L Is Lying About Your Cash
- Gathering Your Core Financial Inputs
- How to Build Your First Forecast Model
- From Static Report to Dynamic Decision Tool
- Driving Smarter Business Decisions Every Week
- Avoiding Pitfalls and Partnering for Success
Why Your P&L Is Lying About Your Cash
It is Thursday afternoon. Payroll hits tomorrow. A supplier is waiting on a wire to release material for a job already behind schedule. Your controller sends over a P&L that shows a decent month, but your bank balance says something else.
That disconnect is normal in a $10M to $100M business. It gets sharper as volume rises, jobs overlap, and working capital starts swinging harder week to week.
Your P&L is accrual-based. Cash is timing. Those are not the same thing. Revenue can post before the customer pays. Expenses can sit on the balance sheet until the invoice arrives. Depreciation lowers profit without touching cash. Loan principal hits cash but never shows up as an operating expense on the P&L.
Founders feel that gap fast.
In construction, a project can show margin while cash is trapped in retainage, change order disputes, or slow pay applications. In distribution, profit can look fine while inventory lands early, customers stretch terms, and vendor payments come due before collections. The income statement says the business is performing. The bank account says timing is beating you up.
The report founders actually need
A 13-week cash flow forecast turns noisy accrual data into a weekly cash view you can run the business on. For founder-led companies, that is the job. Not producing another finance report. Converting sales, payables, payroll, debt service, inventory buys, and job timing into a clear answer to one question: what will cash look like each week, and what decisions do we need to make now?
The distinction is important: founders rarely lose sleep over annual profit forecasts. They lose sleep over making payroll, covering a large material draw, staying inside the borrowing base, or deciding whether this is the month to buy equipment.
Practical rule: If you cannot see cash by week, you are making timing decisions blind.
Why this matters for a growing company
At this size, cash problems usually do not come from one bad number. They come from timing friction across the whole business. A profitable quarter can still produce a painful six-week stretch if receivables slip, inventory builds, or a few large disbursements stack up at once.
That is why I treat the 13-week forecast as a control tool. It gives founders time to act while options still exist.
A healthy P&L will not tell you whether to push collections on three specific accounts, delay a discretionary equipment deposit, buy less inventory for two weeks, or draw on the line before the bank gets nervous. A weekly cash forecast will. For companies with volatile accruals, especially construction and distribution, that is the difference between reacting late and steering early.
If cash has felt unpredictable lately, tighten your operating cadence before you reach for bigger fixes. This guide on how to improve cash flow pairs well with a 13-week model because it addresses the habits that make the forecast accurate and useful.
Gathering Your Core Financial Inputs
A 13-week cash forecast breaks down long before the math breaks down. It breaks when the inputs do not match how cash moves through your business.
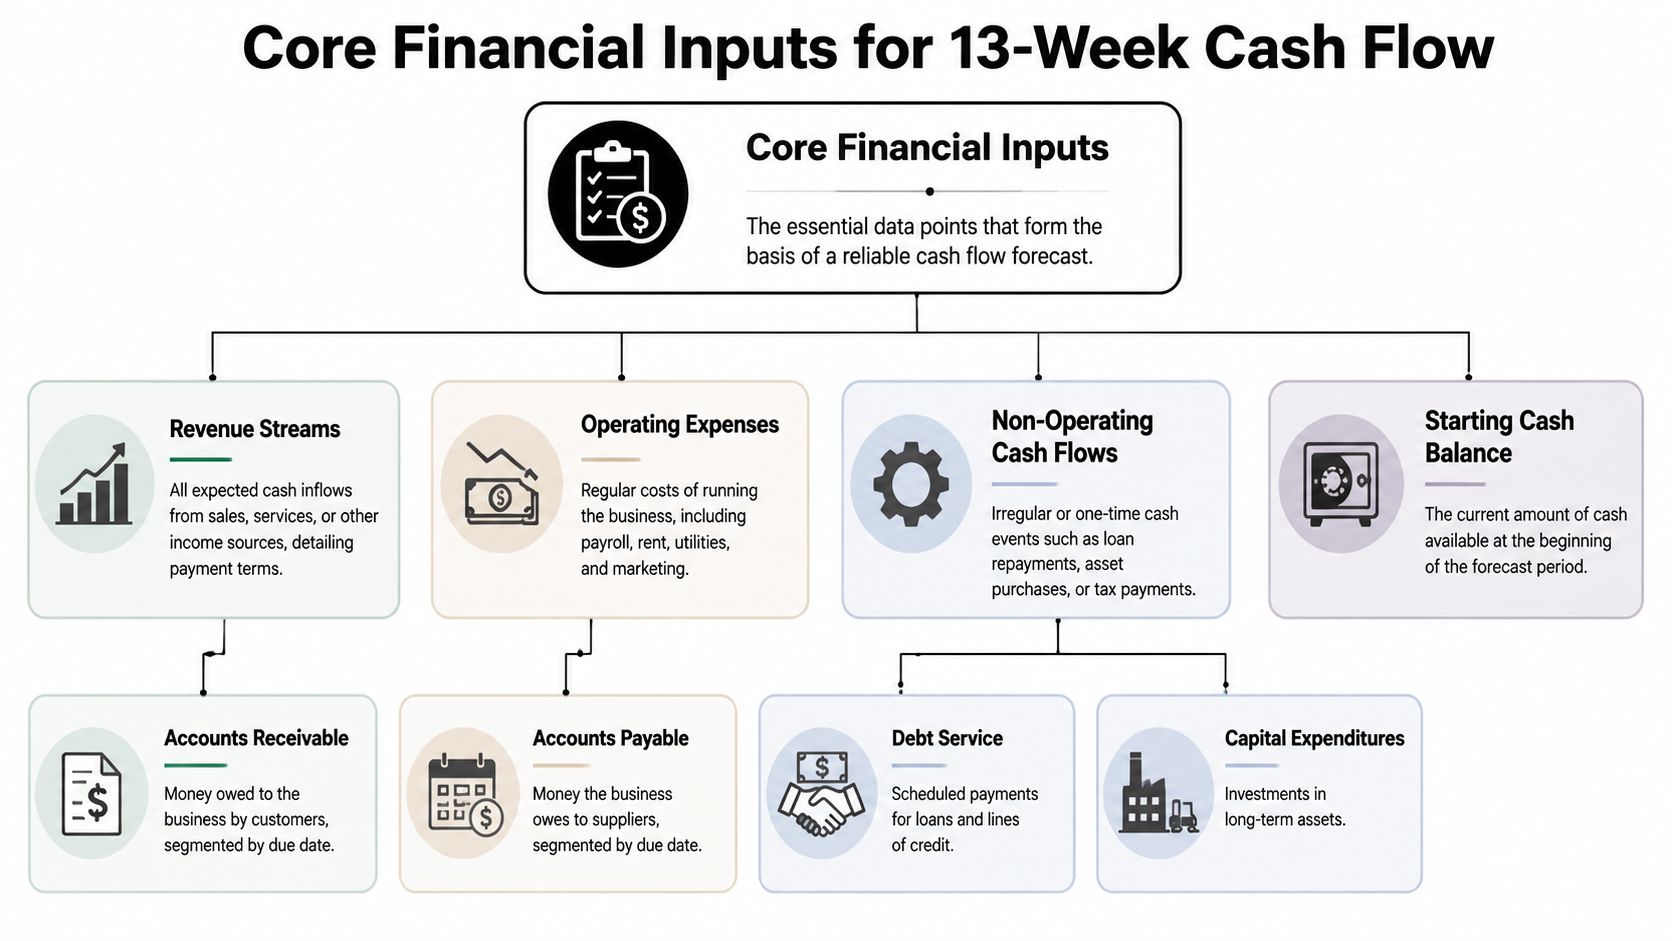
For a $10M to $100M company, that usually means one thing. The accounting system has plenty of accrual data, but very little of it is organized around weekly cash timing. A founder sees revenue, margin, backlog, and payables on paper, yet still cannot answer a harder question with confidence: what will be in the bank three Fridays from now?
Start by pulling the few reports that control timing, not just the reports your controller closes every month.
- Current cash balances: Use actual bank balances, not last month's close. Reconcile them to the books before you build anything.
- Accounts receivable aging: Review invoice dates, promised payment dates, disputes, retainage, and concentration by customer.
- Accounts payable aging: Separate what is due now from what can realistically wait without damaging supply or credit terms.
- Payroll calendar: Include payroll dates, taxes, benefits, and any bonus or commission runs.
- Debt service schedule: List principal, interest, covenant-driven sweeps, and line of credit activity by payment date.
- Tax payment schedule: Include sales tax, payroll tax, property tax, income tax estimates, and any industry-specific items.
- Capital expenditure plan: Capture deposits, progress payments, and final payments. Capex rarely lands in one clean month.
- Booked sales and open jobs: In construction and distribution, timing risk is first evident through these items.
The goal is not to gather every report. The goal is to gather the reports that let you convert accrual activity into dated cash events.
That distinction matters.
A construction company may show a strong month on the P&L because a large job billed well, while cash is still tied up in retainage and slow approvals. A distributor may show healthy sales growth while cash tightens because inventory arrived ahead of collections and two large customers stretched terms from 30 days to 52. The forecast has to reflect those facts, not the average story in the GL.
I usually separate inputs into two buckets. First, the core operating cycle: collections, payroll, vendor payments, rent, and recurring overhead. Second, the capital and financing cycle: debt service, owner distributions, tax payments, equipment purchases, and any one-time legal or settlement items. Founders need to see whether the business is generating cash on its own or whether financing activity is covering an operating shortfall.
Define the working capital drivers that actually move the model
Two terms deserve attention because they change week-to-week cash availability fast.
DSO, or Days Sales Outstanding, measures how long customers take to pay.
DPO, or Days Payable Outstanding, measures how long you take to pay suppliers.
These are not reporting trivia. They are operating assumptions with cash consequences. If your largest GC starts paying in 55 days instead of 38, the forecast needs to push those receipts out immediately. If a key supplier cuts terms from net 45 to net 20, the disbursement side needs to tighten just as fast.
Founders who want a cleaner scorecard around these drivers should keep a short list of financial metrics every business owner should track close at hand.
Handle volatile accrual data without fooling yourself
This is the part generic advice usually misses. “Convert accrual to cash” sounds simple until customer behavior changes mid-quarter, inventory builds ahead of demand, or a lender starts watching availability more closely.
Graphite Financial notes in its discussion of 13-week forecasting challenges that static assumptions create false confidence, especially in businesses with uneven collections and purchasing cycles. That is exactly what founders in construction and distribution run into. The model looks clean. The bank balance does not.
Use current behavior, not historical averages, to place cash into specific weeks.
For construction, that often means breaking receivables into billed-and-collectible, retainage, pending change orders, and disputed balances. For distribution, it usually means modeling the top accounts one by one, then grouping the smaller accounts by payment pattern. A blended DSO may be fine for board reporting. It is weak input for a weekly cash tool.
A dependable input process looks like this:
- Segment customer receipts by their payment behavior. Large accounts, slow payers, and contract-driven customers should not sit in one bucket.
- Use current term behavior. If a customer has drifted from net 30 to net 45, move the cash. Do not wait for month-end reporting to confirm what the collections team already knows.
- Map inventory purchases to expected sales timing. If you bought ahead for a seasonal push or a large job, show the cash outflow now and the conversion later.
- Update vendor term changes as soon as they happen. AP assumptions get stale faster than anticipated.
- Tie every line to an event with a date. Payroll run, tax draft, loan payment, equipment deposit, insurance renewal, customer remittance.
One practical test helps. If a founder points to any large line in the model and asks, “What is behind that number?”, the team should be able to answer in one sentence and point to the source report.
That is what makes the forecast usable under pressure. It is not about building a prettier spreadsheet. It is about turning messy accrual data into a weekly cash view you can trust enough to decide whether to push collections, slow purchasing, draw the line, or hold your position.
How to Build Your First Forecast Model
A $25 million distributor can show a healthy month on the P&L and still run into a cash squeeze by Thursday. The usual reason is timing. Payroll clears this week. A supplier wants payment before the next truck ships. The customer that makes up 18% of receivables pays 12 days late. A 13-week cash flow model puts those dates in one place so leadership can act before the account gets tight.
Build the model using the direct method. Forecast cash receipts and cash disbursements by week, then calculate the ending cash balance. If your books are accrual-based, convert each major line into the week cash will move. For wages, for example, cash paid follows the payable roll, not the expense recorded in the month. The point is simple. Founders in the $10 million to $100 million range do not need another financial statement. They need a weekly control tool that turns noisy accrual data into decisions about purchasing, hiring, borrowing, and owner distributions.
Lay out the spreadsheet so it can survive weekly use
Put Week 1 through Week 13 across the top.
Down the left side, keep the structure tight:
- Beginning Cash
- Cash Inflows
- Cash Outflows
- Net Cash Flow
- Ending Cash
Under inflows, start with customer collections and add any other receipts that matter, such as tax refunds, rebates, asset sales, or financing proceeds.
Under outflows, include the cash items that can put you in a bind. Payroll. Vendor payments. Rent. Taxes. Debt service. Insurance. Software. Capital expenditures. Owner draws, if they happen.
Keep the first draft simple enough that someone updates it every week without dreading it. I would rather see 20 lines that get maintained than 70 lines nobody trusts.
Build receipts from collection timing, not booked revenue
Receipts are where many first models go wrong. Teams pull monthly sales, apply an average DSO, and spread cash across the quarter. That can work for a rough annual plan. It is weak for a weekly forecast in a business with customer concentration, progress billing, retainage, seasonality, or changing credit behavior.
Start with two separate streams:
- Open receivables, assigned to the specific week you expect to collect them
- New sales, converted into cash based on actual payment behavior and terms
For larger accounts, use invoice-level assumptions where the dollars justify the effort. A roll-forward model tracks how items like receivables and inventory change week by week, which is why broad averages often miss the exact cash timing. Wall Street Prep's explanation of 13-week cash flow roll-forward mechanics is a solid reference on that point.
In construction, this often means separating standard billings from mobilization payments, change orders, and retainage. In distribution, it often means isolating top accounts, promotional buys, and seasonal stocking orders. The trade-off is straightforward. More detail takes more effort. But detail on the top 10 to 20 cash drivers usually gives far better control than a beautifully averaged model.
Schedule disbursements by payment date
Outflows belong in the week cash leaves the bank.
That sounds obvious, but otherwise smart teams often distort the model. They drop rent into the first week of the month even though ACH hits on the 28th. They smooth payroll when the company pays biweekly. They leave capex in the forecast after leadership has already delayed the spend.
Use real dates and known commitments. If AP has negotiated a two-week extension with a supplier, move the cash. If a lender sweep is due on the 15th, place it there. If a construction job needs a $90,000 equipment deposit before mobilization, show that exact week and test whether the backlog supports it.
Below is a simplified snippet for a sample distribution company.
| Cash Flow Item | Week 1 | Week 2 | Week 3 |
|---|---|---|---|
| Beginning Cash | $100,000 | $115,000 | $123,000 |
| Customer Collections | $85,000 | $92,000 | $88,000 |
| Other Cash Inflows | $5,000 | $4,000 | $6,000 |
| Total Inflows | $90,000 | $96,000 | $94,000 |
| Payroll | $35,000 | $0 | $35,000 |
| Vendor Payments | $22,000 | $48,000 | $25,000 |
| Rent and Overhead | $8,000 | $8,000 | $8,000 |
| Debt Service | $5,000 | $5,000 | $5,000 |
| Equipment Deposit | $5,000 | $27,000 | $0 |
| Total Outflows | $75,000 | $88,000 | $73,000 |
| Net Cash Flow | $15,000 | $8,000 | $21,000 |
| Ending Cash | $115,000 | $123,000 | $144,000 |
The value of that table is not the formatting. It is the conversation it forces.
Week 2 has a heavier vendor payment load and a large equipment deposit. If collections slip by even one week, ending cash looks very different. That is the moment a founder can decide whether to delay the deposit, press for faster collections, draw on the revolver, or push a supplier for revised terms. A good 13-week model gives you time to choose. That is what lowers stress.
If you need a sales planning input to support the receipt side of the model, this projected sales forecast template for revenue planning can help tie pipeline assumptions back to cash timing.
From Static Report to Dynamic Decision Tool
A 13-week cash flow becomes useful when it changes a decision before cash gets tight.
For a founder running a $25 million distributor or a $40 million specialty contractor, that usually means one question: what happens if the timing shifts? Accrual reporting can show a profitable month while cash gets squeezed by a late customer payment, an early inventory buy, or a project draw that slips two weeks. The forecast earns its keep when it turns those timing risks into choices you can make early.
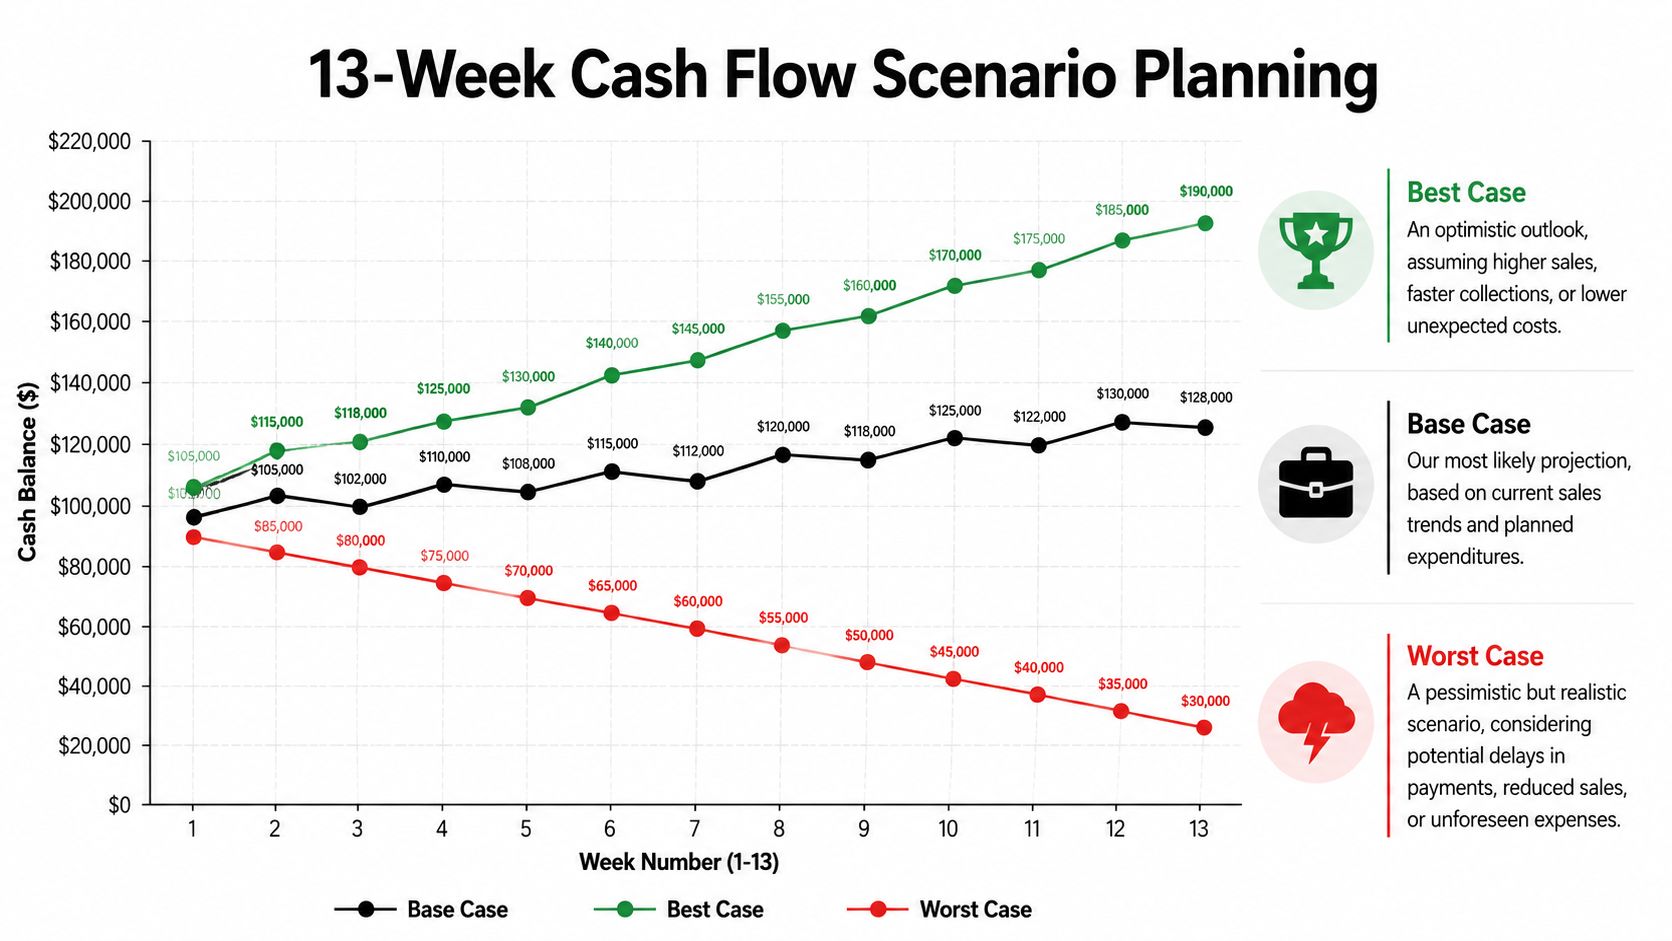
Build scenarios around actual cash decisions
Keep a base case and a downside case at minimum. A best case can help with planning, but the base and downside views are what protect the business.
PKF O'Connor Davies notes in its article on mastering the 13-week cash flow forecast that scenario planning and variance analysis help management spot funding gaps before they become urgent. That is the point. Founders in the $10 million to $100 million range do not need a prettier spreadsheet. They need a tool that converts messy accrual inputs into a cash view they can trust enough to make capital decisions.
Use scenarios tied to decisions you may make this quarter:
- A major customer pays 14 days late: Does cash drop below your minimum threshold, and in which week?
- You win a new contract or large PO: How much labor, material, freight, or mobilization cash goes out before the first dollar comes in?
- A supplier shortens terms: Can you absorb the earlier outflow, or do you need to change purchasing cadence?
- You want to add headcount or equipment: Does the business support the commitment now, or after a specific collection clears?
In construction, the pressure points are usually billing approvals, retainage, change orders, and the lag between field activity and collections. In distribution, the pressure often comes from inventory receipts landing before receivables convert to cash. Same problem, different mechanics. Cash leaves before cash arrives.
That is why scenario design should stay grounded in your operating model, not generic finance templates.
Use weekly variance review to improve judgment
The model should get better every week.
Roll the forecast forward by replacing the first week with actual cash activity. Then review where the forecast missed and why. Some misses come from bad assumptions. Others come from timing drift that now has to be pushed through the next 12 weeks.
A useful review looks like this:
- Which collections missed their expected week?
- Which disbursements cleared early or came in higher than planned?
- Which items were timing issues versus real margin or cost problems?
- Which assumptions now need to change for the rest of the quarter?
- What decision should change today because of that update?
Founders regain control. If a $600,000 project draw moves from Week 4 to Week 6, you can see whether to delay equipment purchases, press billing follow-up harder, use the revolver for two weeks, or hold off on distributions. If a distributor sees a large customer pay faster than expected, that same model may support a larger inventory buy at the right moment, without guessing.
A forecast should become more accurate and more useful over time. If the team keeps updating cells but keeps missing cash timing, the process is clerical, not managerial.
The quality of that weekly review depends on the quality of your reporting cadence. If your close process and operating reports are still inconsistent, these financial reporting best practices will help tighten the inputs behind the forecast.
Driving Smarter Business Decisions Every Week
Monday morning. Payroll clears on Thursday. A supplier is asking for a $180,000 payment hold release. Your controller says the month looked profitable, but the next three weeks still feel tight. That is the moment a 13-week cash flow earns its keep.
For founders running a $10M to $100M business, the job is not “forecasting” in the abstract. It is turning messy accrual activity, open invoices, project schedules, inventory buys, debt payments, and tax dates into a weekly cash plan you can act on before cash gets tight.

Run a weekly cash meeting
Keep the meeting short and decision-focused. In my experience, 30 minutes is enough if the inputs are current and the people in the room can move cash timing.
That usually means the founder or CEO, the finance lead, and the operator who controls near-term cash events. In construction, that may be project management. In distribution, it may be purchasing or sales. If the people who own billing, collections, inventory, or vendor commitments are absent, the forecast turns into commentary instead of control.
Review a simple dashboard:
- Lowest projected cash balance: Which week gets tight first, and how close does it get?
- Weekly sources and uses: Where is cash building, and where is it being consumed?
- Receipts at risk: Which customer payments are promised but not dependable yet?
- Required disbursements: What has to be paid, and what can be sequenced?
- Total liquidity: Cash on hand plus real borrowing capacity, not theoretical availability.
The point is to leave with decisions.
Use the forecast to make capital calls with timing in mind
A good model helps answer questions that feel operational but are really cash timing decisions.
- Can the business hire now, or does that salary burden land in the same month as a tax payment and a slow collections cycle?
- Should the company place a large inventory order before demand hits, or wait one more week and protect the borrowing base?
- Is this the right time to fund equipment down payments?
- Should management draw on the revolver now, or preserve flexibility and wait?
- Can the company accept a job that looks profitable on paper but requires significant upfront cash before billing catches up?
In a construction business, a new project can improve backlog and still create a short-term cash squeeze. Mobilization costs, subcontractor deposits, and payroll can hit weeks before the first meaningful draw is collected. A founder who sees that gap in Week 5 has options. Push harder on billing approval, slow a discretionary equipment purchase, stage subcontractor payments, or use the line for a defined period instead of reacting after cash drops.
In distribution, the trade-off looks different but feels just as sharp. A $400,000 inventory buy may secure margin and product availability, but if two top customers slip payment by ten days, the same purchase can pressure payroll, vendor terms, and covenant headroom. The forecast lets you test that move before committing. That is the difference between using working capital intentionally and hoping the bank balance holds.
Weekly decisions also improve when the team is disciplined about misses. A practical framework for budget vs actual variance analysis helps separate timing noise from a real change in collections, margins, or spending patterns.
Here's a useful walkthrough if your team wants a visual explanation of the process before building a formal rhythm:
The best cash meeting ends with two or three clear actions, an owner for each one, and a reason those actions protect cash in a specific week.
Avoiding Pitfalls and Partnering for Success
A 13-week cash flow forecast usually breaks for a simple reason. The business changes, and the model does not.
For founders in the $10M to $100M range, that gap gets expensive fast. Accrual reporting may show acceptable margins while cash is being pulled in three different directions at once: slower collections, heavier inventory or job costs, and fixed obligations that do not wait. The forecast only works when it converts that moving reality into a weekly cash view the team trusts.
The mistakes that break the model
One common failure is treating the forecast like a quarterly project instead of a weekly operating tool. The process is straightforward. Close the finished week, replace forecasted numbers with actual cash in and cash out, and add a new Week 13. That weekly roll keeps the forecast current and forces the team to deal with real timing instead of stale assumptions.
Another mistake is leaving collection, purchasing, and payment assumptions untouched after the business has clearly shifted. In construction, one owner approval delay can push a draw into the next week and create a cash gap that did not exist on Monday. In distribution, a supplier may tighten terms at the same time a large customer starts paying ten days late. If those changes are not reflected immediately, the forecast stops being a decision tool and turns into a spreadsheet exercise.
Variance review is where accuracy gets built. A forecast that missed by $300,000 is not a failure if the team can explain the miss and correct the drivers. A forecast that misses by $300,000 three weeks in a row for the same reason is a management problem. Weekly review should answer three questions: what changed, was it timing or a real trend, and what decision needs to be made now?
When a founder needs more than a spreadsheet
Intuit notes in its guide to the 13-week cash flow forecast that this type of model gives businesses a clearer short-term view of liquidity. That matters most in the middle market, where the company has outgrown basic bookkeeping but does not yet have a full internal finance team translating accrual results into cash decisions every week.
That is the point where many founders feel the strain. There is enough revenue to create complexity, enough payroll and debt to make mistakes costly, and often no consistent owner of the cash forecasting process.
The answer is usually not a fancier template. It is operating discipline. One person owns the model. Department leaders commit to current assumptions. Actuals are loaded every week. Variances are reviewed without excuses. Then the forecast gets used for real decisions: whether to hire now or wait six weeks, whether to buy equipment or lease it, whether to push growth or protect covenant headroom.
Good finance support helps the founder make those calls earlier, while options still exist.
If cash feels tighter than profit suggests, it's time to put a real operating model in place. AmbitionCFO helps founder-led businesses build and maintain 13-week cash flow forecasts that turn uncertainty into weekly decision-making discipline. If you want a sharper view of liquidity before your next hire, equipment purchase, or growth move, contact the firm for a conversation.