

Most founders are told to chase revenue and trust gross margin to sort out the rest. That advice is lazy. A big customer isn't automatically a good customer, and once you load in discounts, support, logistics, payment friction, and exception handling, the relationship can turn from asset to anchor.
That's the question behind customer profitability analysis. Not “Who buys the most?” but “Who creates net dollar contribution after the full cost to acquire, serve, and retain them?” The answer changes how you price, how you staff, and which accounts deserve senior attention.
Table of Contents
- Why Your Biggest Customers Might Be Losing You Money
- Mapping the True Cost to Serve
- Calculating Profitability by Segment and Account
- Turning Insights into Strategic Action
- Real-World Scenarios in Construction and Distribution
- Your First 30 Days of Profitability Tracking
Why Your Biggest Customers Might Be Losing You Money
Revenue rankings flatter the wrong accounts. A customer can sit at the top of your sales list and still drag on earnings if they constantly trigger rush orders, custom work, extra calls, or hand-holding from senior people. That's why Contribution Margin I and Contribution Margin II matter. CM I tells you what's left after direct product cost, while CM II shows what's left after cost-to-serve is loaded in, and that's where the truth shows up.

The customers that look great on paper
Construction, distribution, and professional services all have a familiar pattern. The loudest account often gets the fastest response, the most exceptions, and the most time from the owner or a senior project lead. That behavior feels client-friendly, but it shifts labor and overhead onto your business.
The accounting problem is simple. Traditional sales reporting rewards invoice size, while customer profitability analysis asks whether the account paid for the service it consumed. The literature defines this work as allocating revenues and costs to customer segments or individual accounts so profitability can be calculated at that level, not guessed from topline alone (customer profitability analysis definition).
Practical rule: If a customer needs custom treatment every week, assume the invoice is hiding a second cost layer until you prove otherwise.
Why CM II is the more honest number
Most owners stop too early. They subtract materials and direct labor, see a decent margin, and call the account healthy. That's incomplete because it ignores service intensity, and service intensity is where margin gets eaten. One advisory framework makes the point bluntly, CM I is insufficient for strategic decisions, because only CM II reflects true customer contribution once cost-to-serve is included (One Tribe Advisory on customer profitability analysis).
That's the lens I'd use in any founder-led business. If one account consumes your best estimator, your fastest dispatcher, or your most experienced account manager, it may be subsidized by your other customers. If you want a cleaner operating baseline, compare the revenue ranking to the profitability ranking, then ask where value is created or destroyed. For a related margin lens, see how to improve profit margins.
how smart controllers boost profitability is a useful read if you want a practical view of how finance leadership can expose these leaks without turning the business into a spreadsheet exercise.
Mapping the True Cost to Serve
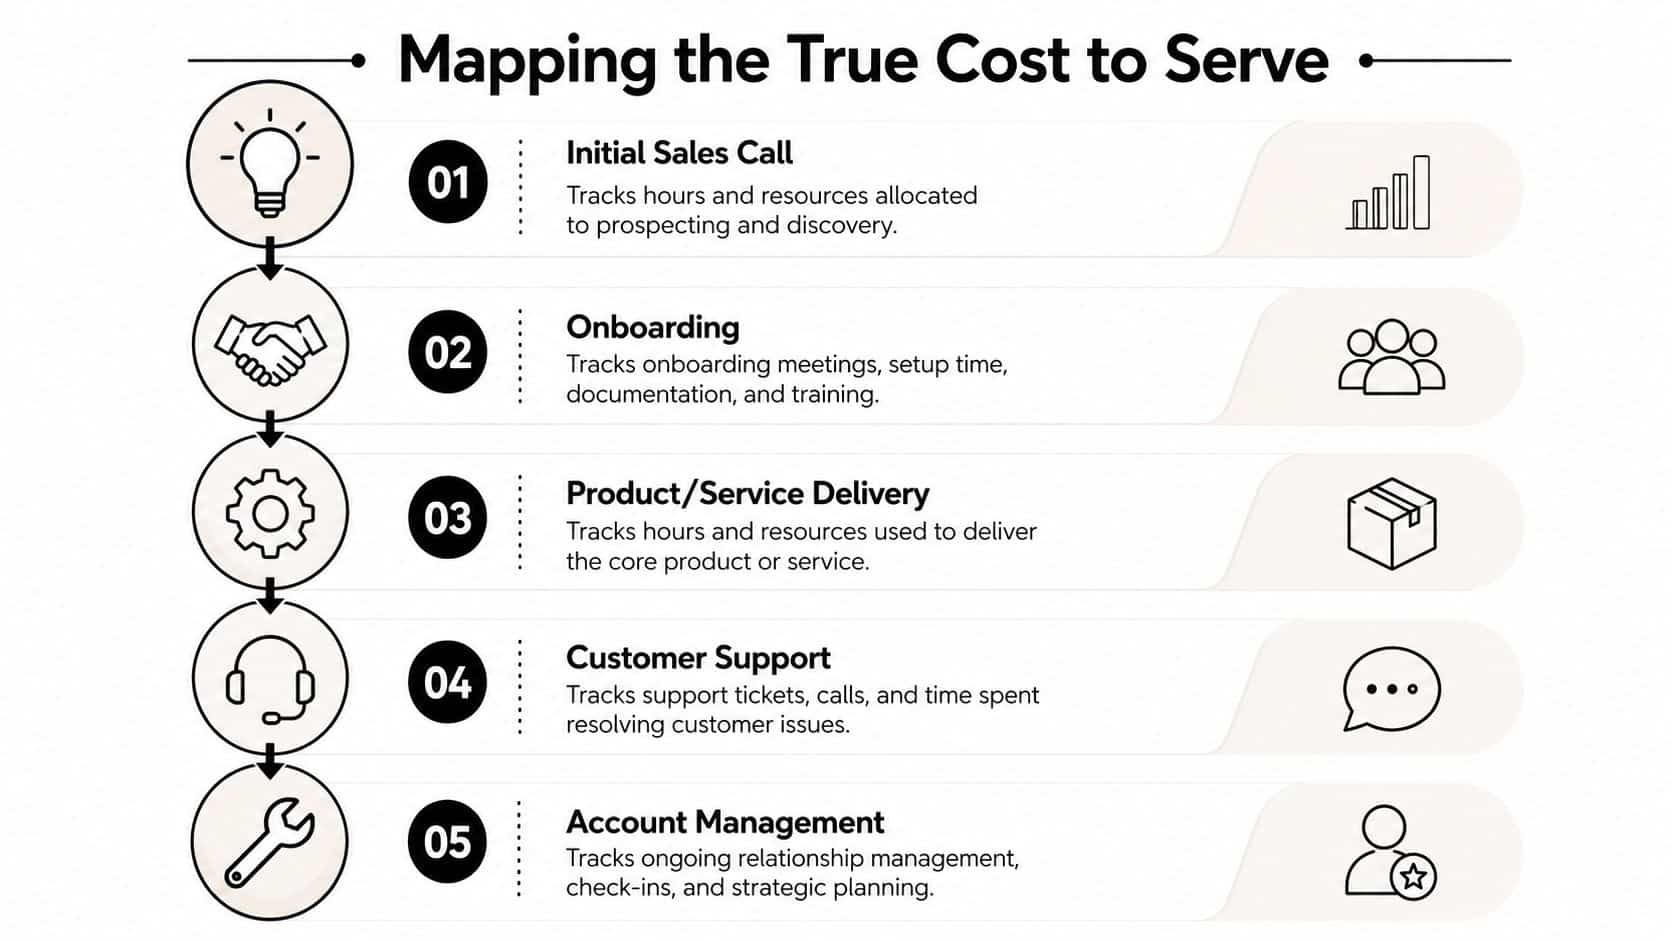
You can't fix what you haven't mapped. In customer profitability analysis, the work starts with touchpoints, not with formulas. If you don't know where the time, labor, and exceptions happen, you'll undercount the customers who are hardest to serve and overrate the ones who place large orders.
Start with every interaction, not just the invoice
The practical workflow is straightforward. List every meaningful customer touchpoint, from first sales call to onboarding, delivery, support, and account management. Then segment customers so you're not averaging a high-touch account together with a low-touch account that needs almost no intervention.
After that, assign costs to each segment or account. The approved research-backed method is to identify touchpoints, segment customers, attribute revenues and expenses to those segments, and then analyze profitability by segment (Hockeystack on customer profitability analysis). That sequence matters because it stops you from hiding service-heavy relationships inside broad averages.
Split direct costs from indirect costs
Use two buckets. Put direct costs where they belong, such as materials, labor tied to a job, or direct fulfillment expense. Then layer in indirect costs like overhead, technology, and support effort where they land. A major industry guide recommends assigning both direct and indirect costs to the touchpoints that consume them, then measuring which interactions drive engagement and profitability (Teradata on customer profitability analysis).
The business danger isn't high service alone. It's high service that never gets billed, never gets tracked, and never gets discussed at renewal.
Don't ignore favors and exceptions
Many mid-market firms fool themselves. Extra deliveries, expedited shipments, redraws, scope changes, and senior-team calls rarely get captured cleanly on the P&L by customer. Yet they absolutely belong in the analysis. A practical advisory framework recommends separating true price from true cost to serve, which means subtracting discounts from invoice price first, then loading in service costs and exceptions before you call anything profitable (BDC on customer profitability analysis).
For owners who want this operationalized inside the finance stack, job order costing is a useful companion concept because it forces discipline around assigning costs to the work that consumed them.
Calculating Profitability by Segment and Account
Once the data is organized, the math gets simple. The discipline is in not oversimplifying it. Customer profitability is the net dollar contribution of an individual customer or segment, and that means you're looking beyond revenue and gross margin to the full cost of the relationship (Journal of Database Marketing article).
Use the right formula, not the easiest one
A solid operating formula is Revenue minus all costs incurred to serve that customer. Research has also operationalized this using direct product costs, retention costs, acquisition costs, and indirect customer-related costs, which is the right direction if you want a realistic number rather than a vanity number (DePaul study on unprofitable customers). One way to think about it is this. Start with invoice revenue, subtract discounts, then subtract the direct and indirect cost-to-serve items you mapped earlier.
If you skip discounts, you're already overstating value. If you skip service exceptions, you're still overstating it. That's why a customer who looks strong at CM I can become weak at CM II.
Segment customers into tiers
You don't need a 20-tab model to get started. Classify accounts into A, B, and C tiers based on net contribution, not just revenue. Then compare the patterns. The most useful output is often not the exact ranking, but the fact that your top revenue accounts are not your top profit accounts.
| Customer Tier | Revenue % | Cost-to-Serve % | Net Profit Contribution |
|---|---|---|---|
| A Tier | High | Low | Strong positive contribution |
| B Tier | Moderate | Moderate | Mixed contribution |
| C Tier | Often high or moderate | High | Weak or negative contribution |
Watch for the margin sink accounts
This is the part founders usually resist. Some accounts are profitable on direct cost only, then flip once support, coordination, and exceptions are assigned. That's especially common in businesses with custom fulfillment, job changes, or recurring escalation calls. The goal isn't to punish those customers automatically. The goal is to decide whether the price, service model, or fit is wrong.
If an account needs special handling, the contract should reflect that. If the contract won't reflect that, the customer probably doesn't fit your model.
For a broader metric set that helps you interpret these results alongside cash and reporting, see the financial metrics every business owner should track.
Turning Insights into Strategic Action
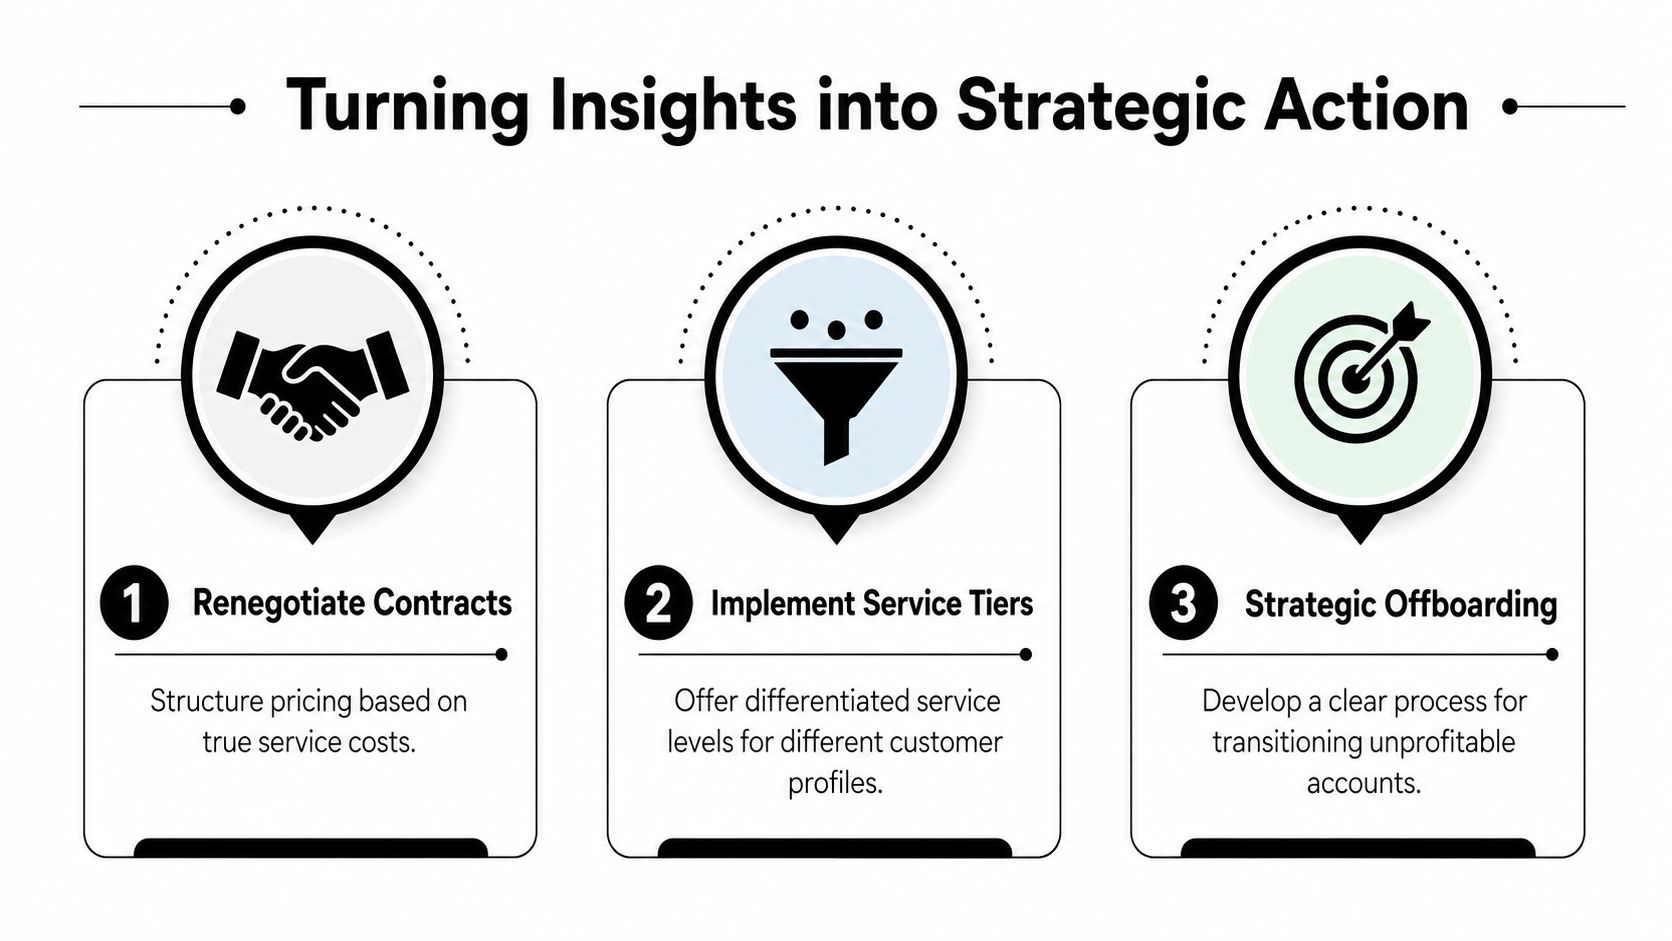
Data without action is just a prettier spreadsheet. Once you know which accounts are weak, the next move is to change the economics, not to keep admiring the leak. The right response depends on whether the problem is price, service design, or customer fit.
Renegotiate before you absorb the loss
If the customer is strategically important but structurally underpriced, renegotiate. Don't hide behind the word “relationship.” Explain the service pattern, the exceptions, and the actual cost profile. If the customer wants the same level of responsiveness, the price has to reflect it.
Service-tied pricing works better than blunt discounting. You either charge for the complexity or reduce the complexity. Anything else is a transfer from your margin to the customer's convenience.
Build tiers that match how customers really behave
A tiered model is cleaner than pretending every account deserves the same treatment. Some customers can self-serve. Some need normal support. A few need high-touch coordination and should pay for it. That's especially relevant in businesses where digitalization can reduce service effort without changing price, because lower-touch customers should consume fewer resources than high-touch ones. Current academic work on B2B markets reflects that shift toward more granular tracking of digital touchpoints and service effort (RSIS International journal article on customer profitability and digitalization).
My rule: If the customer wants white-glove service, make white-glove economics explicit.
If you want a practical operating view of how service interactions tie to retention and margin in a trades context, customer engagement metrics for homebuilders is a useful reference point for thinking about touchpoint discipline.
Offboard the accounts that refuse to change
Some customers won't renegotiate and won't self-correct. Those accounts need a planned exit. Strategic offboarding isn't dramatic, it's rational. You protect margin, free up senior time, and stop rewarding behaviors that train the rest of the market to expect concessions.
AmbitionCFO offers Client and Project Profitability Analysis, which is the right kind of toolset if you need visibility into which clients, projects, service lines, and teams are creating value. That becomes far more useful than blanket revenue reporting when the business is full of exceptions.
Real-World Scenarios in Construction and Distribution
A construction firm can grow revenue and still get poorer. The pattern is familiar, a GC or subcontractor adds change orders, but the project team keeps absorbing scope creep because it wants to preserve the relationship. The fix starts with linking every change request to the job and then reviewing whether those changes were billed, approved, and recovered. For owners who need a tighter job-level lens, construction job costing is the right companion framework.
Construction and the hidden cost of scope creep
Here's the operational reality. A client calls for a same-week revision, the estimator jumps back in, the PM revises schedules, and the field team gets re-sequenced. If those hours never land in the customer file, the account still looks healthy because the invoice stayed large. Once you load in all the service work, the picture often changes fast.
That's why construction firms should track change-order frequency, unbilled coordination time, and the amount of senior review each account consumes. If the account is large but unpredictable, the contract needs better pricing language and stricter approval rules. If not, the relationship is getting subsidized by everyone else.
Distribution and the rush-order trap
Distributors see a different version of the same problem. Rush delivery requests, split shipments, special pickups, and after-hours corrections feel like good service, until the cost-to-serve exceeds the value of the order. The answer isn't to stop serving customers well. It's to define what standard service includes and what gets charged separately.
A distributor that wants cleaner estimating and pricing discipline should tighten the way it quotes job-specific work. Tools like Exayard plumbing estimating software are relevant because estimating discipline is often the first place margin gets protected. When quoting is tighter, rush work and exceptions are harder to disguise.
The pattern in both industries is the same. Revenue growth only helps when the added work is priced correctly. If the account consumes more time than it funds, the business is growing the wrong way.
Your First 30 Days of Profitability Tracking
Start small and start now. Don't build a year-long accounting redesign before you identify the first bad account. The first pass only needs enough detail to expose obvious leaks and force a better conversation with sales, operations, or account management. For a reporting foundation that supports the process, see what financial reporting should do for a growing business.
Week one to week four
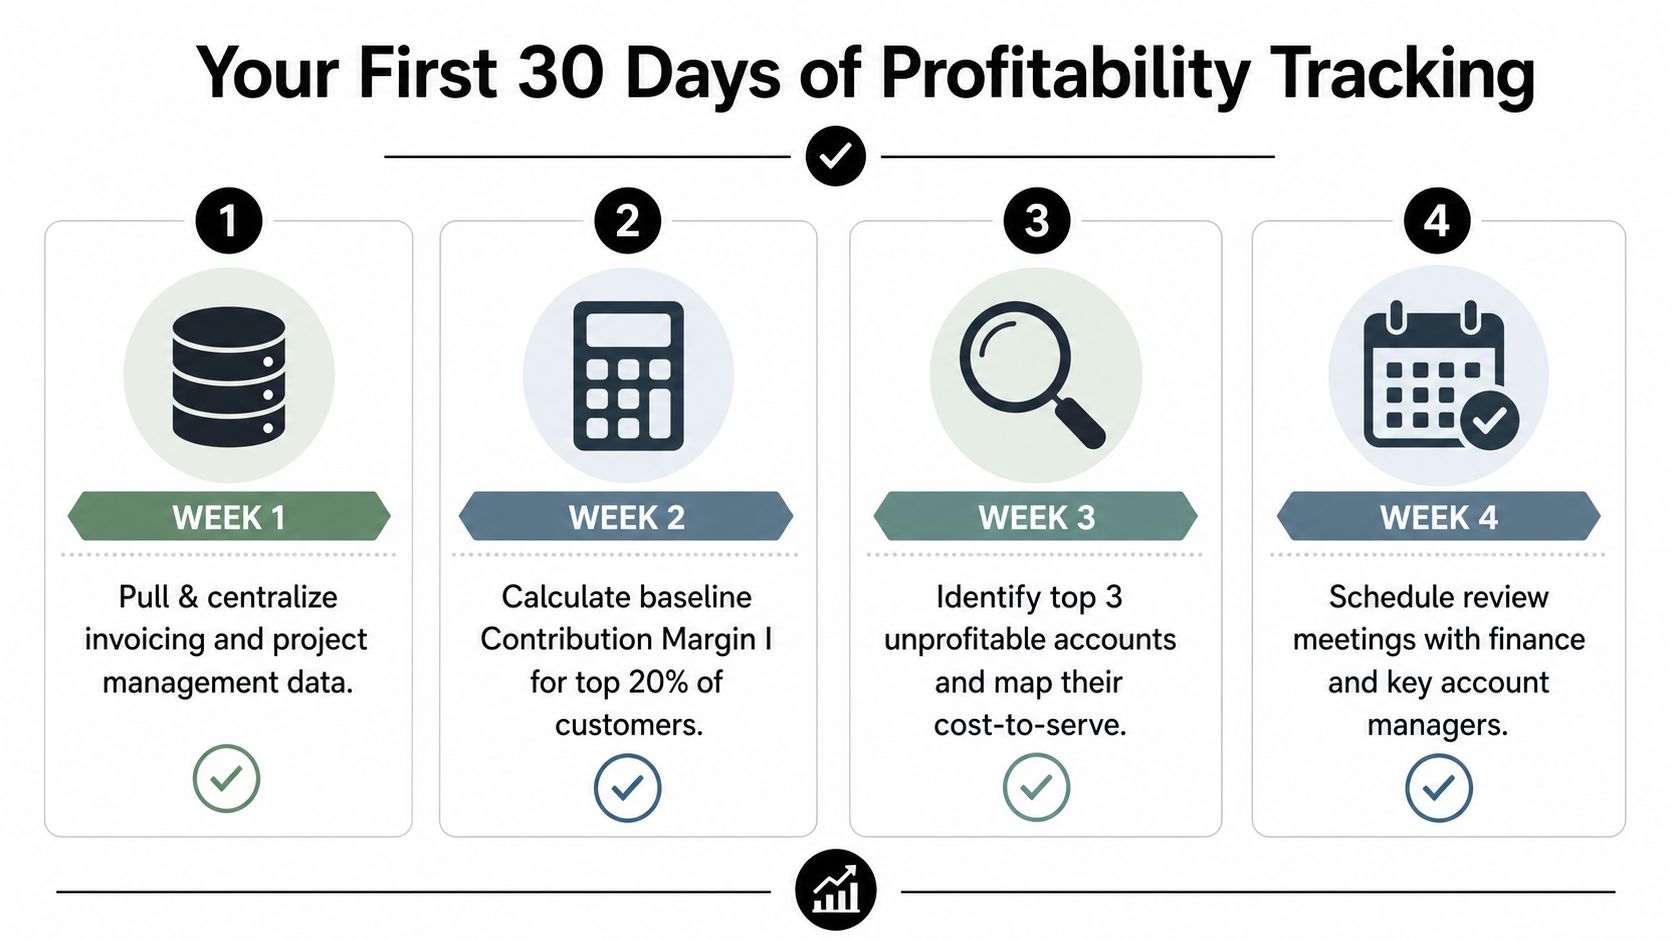
- Week 1, pull the data. Centralize invoicing, project management, support logs, and time tracking so you can see the workload by customer.
- Week 2, calculate a baseline. Build contribution margin by customer or segment for your top accounts first, not every account in the business.
- Week 3, flag the worst offenders. Identify the most unprofitable relationships and map their cost-to-serve with the team that touches them.
- Week 4, hold the review. Put finance, sales, and account owners in the same room and decide whether to reprice, tier, or exit.
Keep the first review meeting tight
Bring three things. A list of the top accounts by revenue, a list of the top accounts by profit, and a short summary of service exceptions. The gap between those lists tells you where to focus.
Your first decision doesn't need to be perfect. It just needs to stop you from rewarding unprofitable behavior. Once the team sees the pattern, customer profitability stops being an accounting exercise and becomes an operating habit.
AmbitionCFO helps founder-led businesses turn margin blind spots into clear action with client and project profitability analysis, cash flow modeling, KPI dashboards, and financial reporting built for decision-making. If your biggest customers look strong on sales but weak after cost-to-serve, visit AmbitionCFO and start a conversation about how to expose the leak and protect the margin you've already earned.