

What is financial reporting? It’s the process of turning raw financial data into clear, actionable insights that business owners can use to make immediate, fact-based decisions. Effective financial reporting shows you your cash position, true profitability, and early warning signs, allowing you to steer the business proactively instead of just reacting to surprises.
This guide will walk you through what financial reporting is, why it matters for your business, and how to implement a system that generates real value. You'll leave with practical steps you can apply today.
Table of Contents
- Why Financial Reporting Is Your Most Important Leadership Tool
- What Are The Core Financial Reports?
- Distinguishing Management Reports From Statutory Filings
- Essential Reports and KPIs for Strategic Decisions
- Implementing a Financial Reporting System That Drives Value
- Step 1: Start with a Data Audit
- Step 2: Define Your Audience and Their Questions
- Step 3: Choose Integrated Tools
- Step 4: Set a Reporting Cadence That Matches Decision Speed
- Step 5: Create a Forecasting Feedback Loop
- The 5-Step Framework at a Glance:
- Case Study: From Messy Data to a $1.2M Cash Swing
- Tools and Templates to Start Now
- Your Move This Week
- Leveraging Fractional CFO Services for Strategic Insight
- Frequently Asked Questions About Financial Reporting
Why Financial Reporting Is Your Most Important Leadership Tool

Think of your financial reporting system as your business's dashboard. You don’t need to be an engineer to drive a car, but you absolutely need to know your speed, fuel level, and whether any warning lights are on. Good reporting does the same for your company. It answers three critical questions:
- Where are we right now?
- How did we perform?
- What's coming next?
For founder-led companies, especially those in the $10M–$100M revenue range, this is not a boring compliance task. It is one of your most powerful leadership tools for reducing guesswork and making decisions with confidence.
Key Terms You Should Know:
- Balance Sheet: A financial statement that provides a snapshot of what a company owns (assets) and owes (liabilities), as well as the amount invested by shareholders, at a specific point in time.
- Income Statement (P&L): A report that shows a company's financial performance over a specific period by summarizing revenues, costs, and expenses. It reveals your profitability.
- Cash Flow Statement: A financial statement that tracks the movement of cash into and out of the company. It’s essential for managing liquidity.
- 13-Week Cash Flow Model: A forward-looking forecast that projects your cash position over the next 13 weeks, helping you anticipate shortfalls and manage working capital.
- KPI (Key Performance Indicator): A measurable value that demonstrates how effectively a company is achieving key business objectives. Examples include Days Sales Outstanding (DSO) and Gross Margin Percentage.
What Are The Core Financial Reports?
Here’s a quick guide to the essential reports and how they directly impact your business decisions.
| Core Report/Tool | What It Answers | How It Improves Your Business |
|---|---|---|
| Balance Sheet | What do we own vs. owe? | Shows your solvency and capacity to borrow for growth. |
| Income Statement | Are we profitable? | Reveals true profitability by product, service line, or customer. |
| Cash Flow Statement | Do we have enough cash to operate? | Predicts your ability to meet payroll and pay suppliers on time. |
| 13-Week Cash Flow Model | What will our cash balance be in 3 months? | Helps you prevent short-term cash crises and avoid costly emergency loans. |
Mastering these four components is the foundation of a strong financial reporting system. Getting these right puts you ahead of most businesses your size.
Who Uses These Reports?
- CEOs and Founders rely on them to set strategy, time investments, and decide when to hire.
- Department Heads track metrics like margin by job to identify and fix unprofitable projects before they drain cash.
- Lenders and Investors use these reports to assess risk, which directly impacts your cost of capital and business valuation.
Practical Example: How Reporting Unlocks Hidden Profit
A distribution company with $25M in annual revenue implemented margin-by-SKU reporting. They discovered one of their products was generating a negative gross margin, a fact hidden within their aggregate financial statements.
Action Taken: They adjusted pricing and renegotiated terms with their supplier.
Numeric Outcome: Gross margin increased by 3 percentage points, adding $750,000 directly to their annual EBITDA and eliminating their need for a seasonal line of credit.
This is the power of actionable financial reporting. A single, focused report unlocked three-quarters of a million dollars in profit.
How to Improve Your Decisions This Week
- Run a weekly cash check. Reconcile your bank statements to your accounting records to ensure your numbers are accurate. This catches surprises before they become problems.
- Build a simple 13-week cash flow model. Tie it directly to your actual bank balances and projected collections/payments.
- Report gross margin by client or project monthly. This is the fastest way to identify where you're making—and losing—money.
These aren't massive projects. Each can be set up in a few hours and provides an almost immediate return on your time. To dive deeper, check out this MyOfficeOps financial reporting guide.
For more advanced strategies, read our guide on Financial Reporting Best Practices.
Your Next Action: Block one hour on your calendar this week. Use it to build a one-page dashboard showing your current cash balance, gross margin, and Days Sales Outstanding (DSO). This simple exercise will fundamentally change how you view your business's health.
Distinguishing Management Reports From Statutory Filings
Many business owners get tangled up by confusing two very different types of financial reporting: management reporting and statutory reporting. Understanding the difference is critical for both your daily operations and long-term strategy.
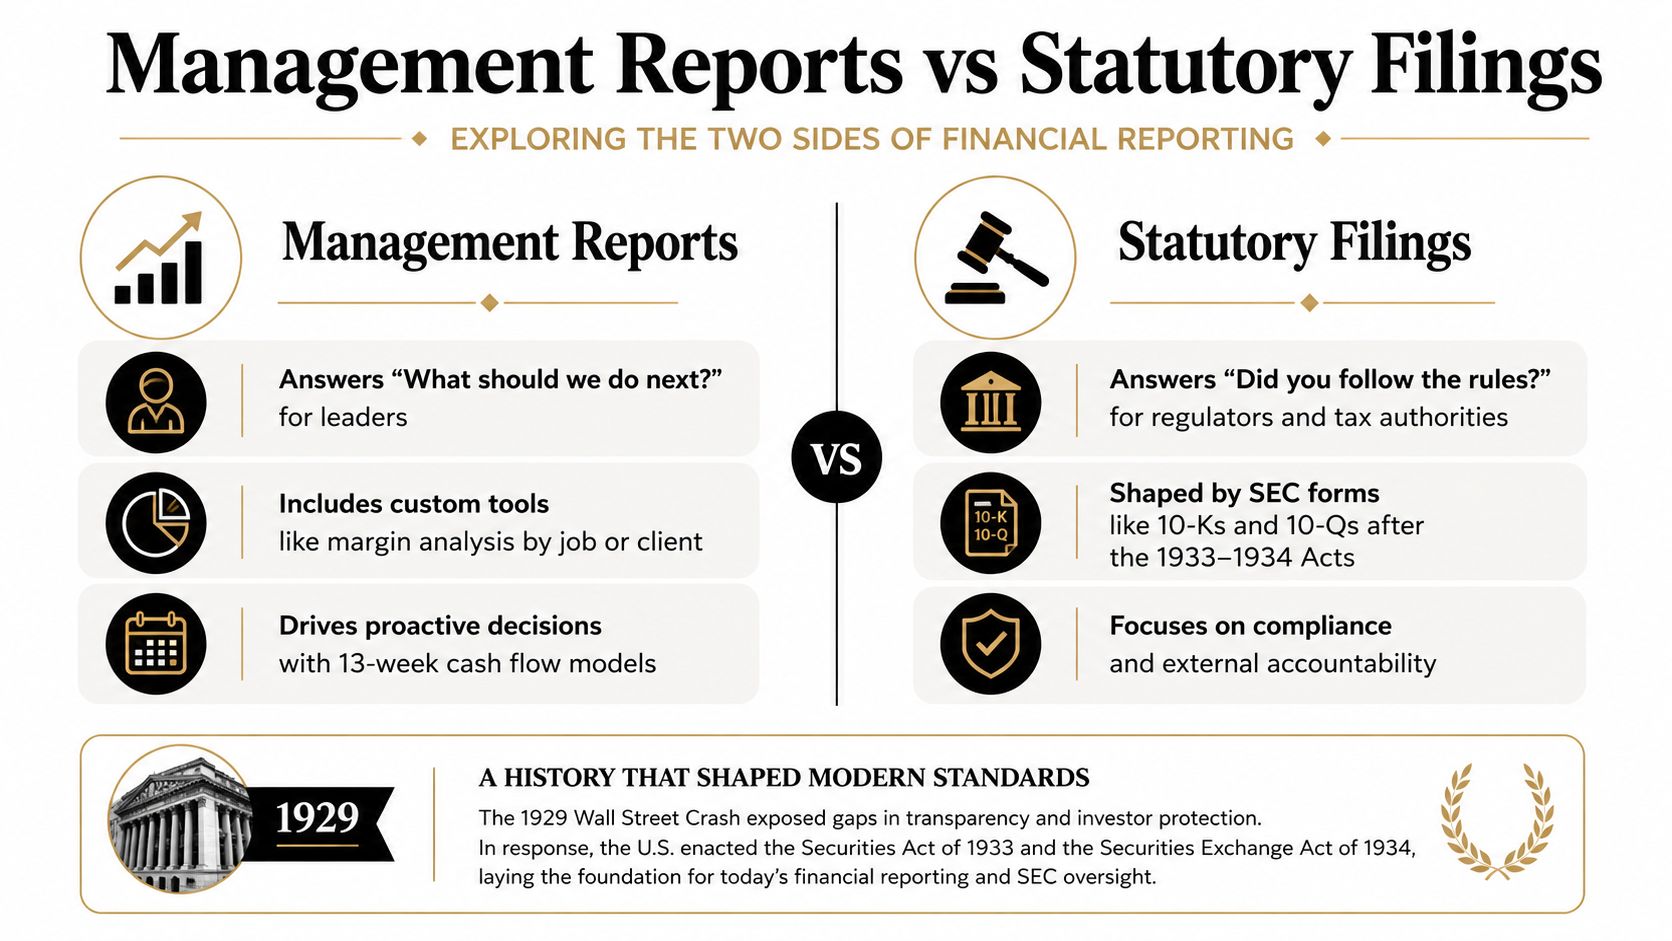
- Management reporting is for internal decision-makers. It answers the question: What should we do next? It's forward-looking, flexible, and designed to give leaders actionable insights.
- Statutory reporting is for external stakeholders like regulators, lenders, and tax authorities. It answers the question: Did you follow the rules? It's historical, standardized, and focused on compliance.
Why This Distinction Matters to Your Bottom Line
For a founder-led company, management reports are your operational command center. They show you which customers are most profitable and give you a clear view of your short-term cash runway, so payroll never becomes a surprise. Statutory reports, on the other hand, build external trust. A clean, audited financial statement can lower your perceived risk, resulting in better borrowing terms from a lender or a higher valuation from a potential buyer.
Management reporting turns accounting data into decisions. Statutory filings turn your financial position into external credibility.
Real-World Case Studies
- Management Reporting in Action: A services firm used a 13-week cash flow model to identify a seasonal accounts receivable crunch. This foresight allowed them to adjust their invoicing schedule, avoiding a $500,000 bridge loan and preserving thousands in interest payments.
- Statutory Reporting's Impact: A $40M distributor prepared audited financial statements before their annual lender review. The bank, seeing a clear and trustworthy financial picture, offered them significantly better borrowing terms, lowering their cost of capital.
Quick Comparison Table
| Feature | Management Reports | Statutory Filings |
|---|---|---|
| Primary Question | What should we do next? | Did we follow the rules? |
| Audience | Owners, operations, sales leaders | Regulators, lenders, tax authorities |
| Timeframe | Forward-looking (weekly, monthly, rolling forecasts) | Historical (quarterly, annually) |
| Key Tools | 13-week cash model, margin by job analysis, KPI dashboards | 10-K/10-Q reports, audited financial statements |
| Business Outcome | Improved cash flow, higher margins, better decisions | Established credibility, met compliance, secured financing |
How to Use Both Effectively
- Start with Data Integrity: Ensure your general ledger is reconciled with your bank statements. Without accurate data, neither report is reliable.
- Implement a Weekly Cash Check: Use a rolling 13-week forecast to maintain a real-time pulse on your liquidity.
- Maintain an Audit-Ready Close Process: A clean, timely month-end close ensures statutory filings don’t become a fire drill, freeing up your team to focus on growth.
Read also: Curious how strategic finance differs from traditional accounting? Dive into our guide on FP&A vs Accounting
Your Immediate Next Step
Block 90 minutes on your calendar this week. Pick one upcoming decision (e.g., a new hire, a capital purchase) and connect it to a management report, like your 13-week cash forecast. This simple habit transforms reporting from a chore into a strategic advantage that drives better cash flow and a stronger business.
Essential Reports and KPIs for Strategic Decisions
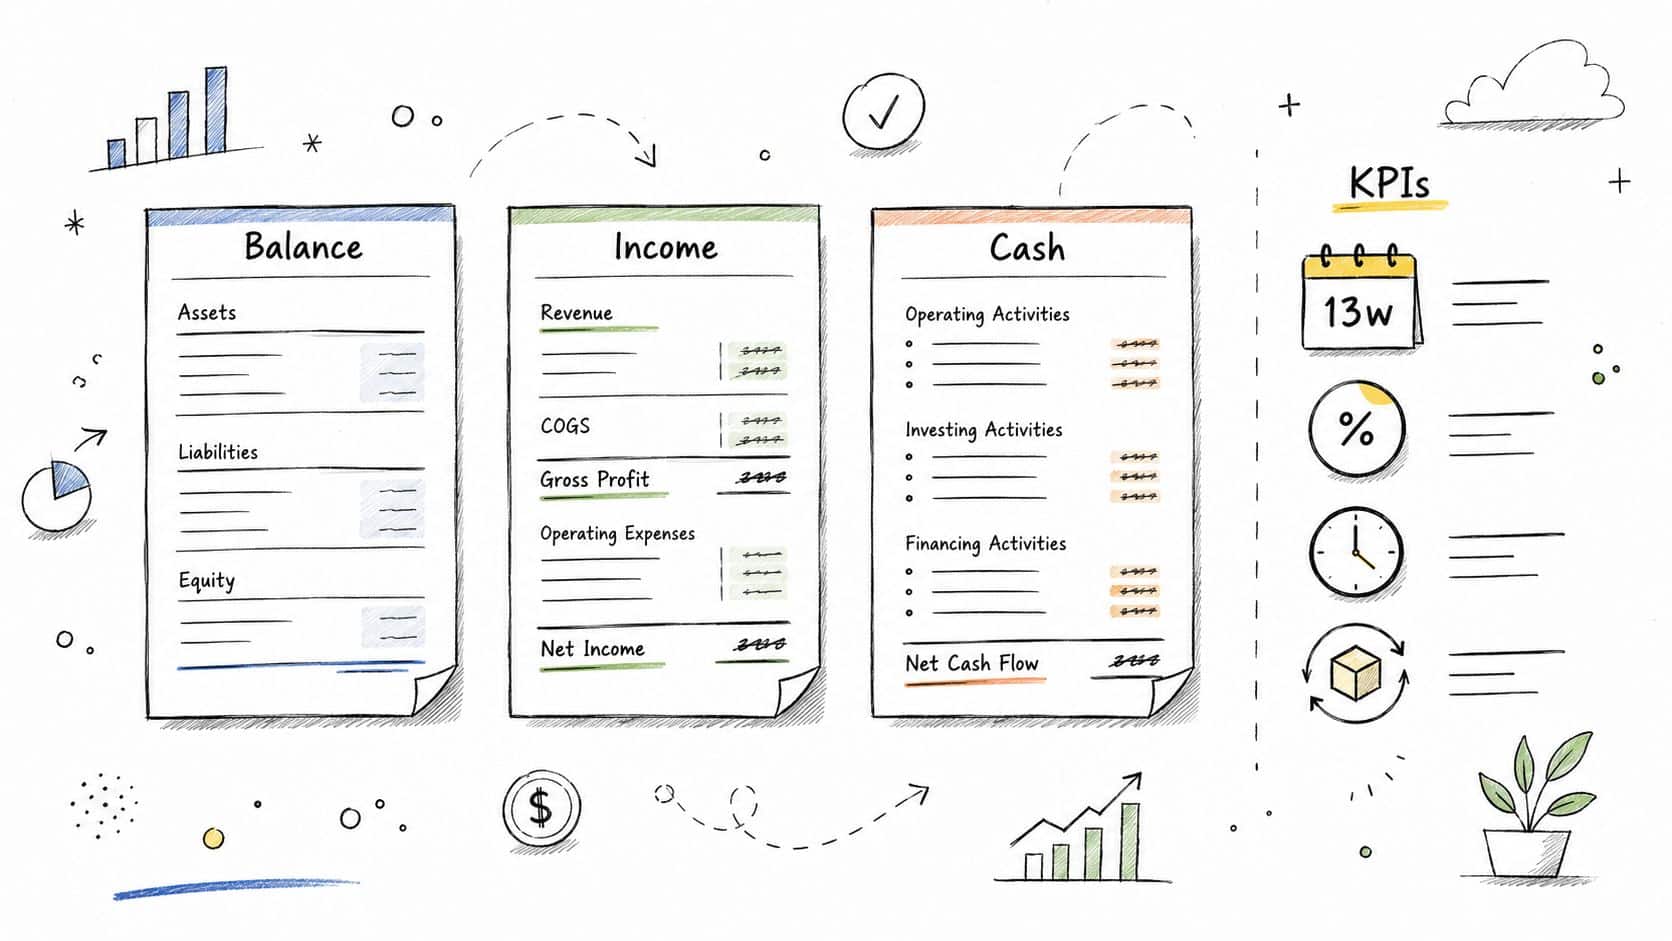
Let's move beyond the basics and focus on the reports and Key Performance Indicators (KPIs) that truly drive strategic decisions. While the "big three" statements (Balance Sheet, Income Statement, Cash Flow Statement) are foundational, the real magic for a founder is in the management reports you build on top of them.
Key Reports That Drive Action
- 13-Week Cash Flow Model: This is your most critical short-term tool. It predicts your cash balance week by week, allowing you to anticipate payroll needs and manage supplier payments.
- Real-world win: A client used this model to spot a $250,000 cash timing gap two weeks out, giving them enough time to accelerate collections and avoid a high-interest bridge loan.
- Margin Analysis by Job or Client: This report uncovers which parts of your business are actually making money.
- Real-world win: By analyzing job-level profitability, a construction firm discovered a specific service line was underpriced. Adjusting their quotes boosted overall gross margin by 3 percentage points, adding significant EBITDA.
- Monthly KPI Dashboard: This one-page summary tracks the vital signs of your business. It should include:
- Days Sales Outstanding (DSO): How quickly you collect cash from customers.
- Gross Margin % by Service Line: True profitability of your offerings.
- Working Capital Ratio: Your ability to meet short-term obligations.
- EBITDA Margin: A key measure of overall profitability and operational efficiency.
Good KPIs give you a seat at the negotiating table before lenders or buyers start asking questions.
Your Actionable KPI Dashboard
Use this table as a starting point for your own dashboard. Set thresholds to trigger specific actions.
| KPI | What It Tells You | Actionable Threshold |
|---|---|---|
| Days Sales Outstanding (DSO) | How fast customers pay you. | If DSO > 60 days, it’s time to tighten credit terms or ramp up collections. |
| Gross Margin % by Line | Profitability of each product/service. | If any line is < 20%, it needs immediate review for repricing or cost reduction. |
| Working Capital Ratio | Short-term liquidity health. | If the ratio drops < 1.2, you may need to free up cash or delay non-essential spending. |
| 13-Week Cash Coverage | Weeks of operating expenses you can cover. | If coverage falls < 6 weeks, it's time to activate your contingency plan. |
Case Study: How a KPI Focus Transformed Cash Flow
A services company with $35M in revenue saw its DSO creep from 42 to 68 days—a huge red flag indicating cash was getting trapped in accounts receivable.
Action Taken: They enforced net-30 payment terms on all new contracts and offered a 1.5% discount for early payment.
Numeric Outcome: They slashed their DSO by 12 days. This simple change accelerated collections and injected an extra $1.1M into their monthly cash flow, completely eliminating their reliance on a line of credit.
What to Build First: A 3-Step Plan
- Ensure Reconciled Monthly Statements: Accurate data is non-negotiable. Your reports are useless without it.
- Create a One-Page KPI Dashboard: Track cash, DSO, and gross margin. Review it weekly with your leadership team.
- Implement a Rolling 13-Week Cash Model: Update it weekly using your actual bank balance.
Quick tip: To track gross margin by client, create a simple P&L for each major client covering the last 12 months.
Quick tip: Automate your DSO calculation directly from your accounting software’s aged receivables report.
To see how financial reports become strategic tools, explore this resource on business intelligence reporting basics. For a deeper list of metrics, read our guide on The Financial Metrics Every Business Owner Should Track.
Your Move This Week: Take the first step. Run a bank-to-book reconciliation to confirm your cash balance. Then, build that one-page dashboard with cash, DSO, and gross margin. If you want an expert to set this up for you, a fractional CFO can build a system that keeps you out of crisis mode and ready for growth.
Implementing a Financial Reporting System That Drives Value
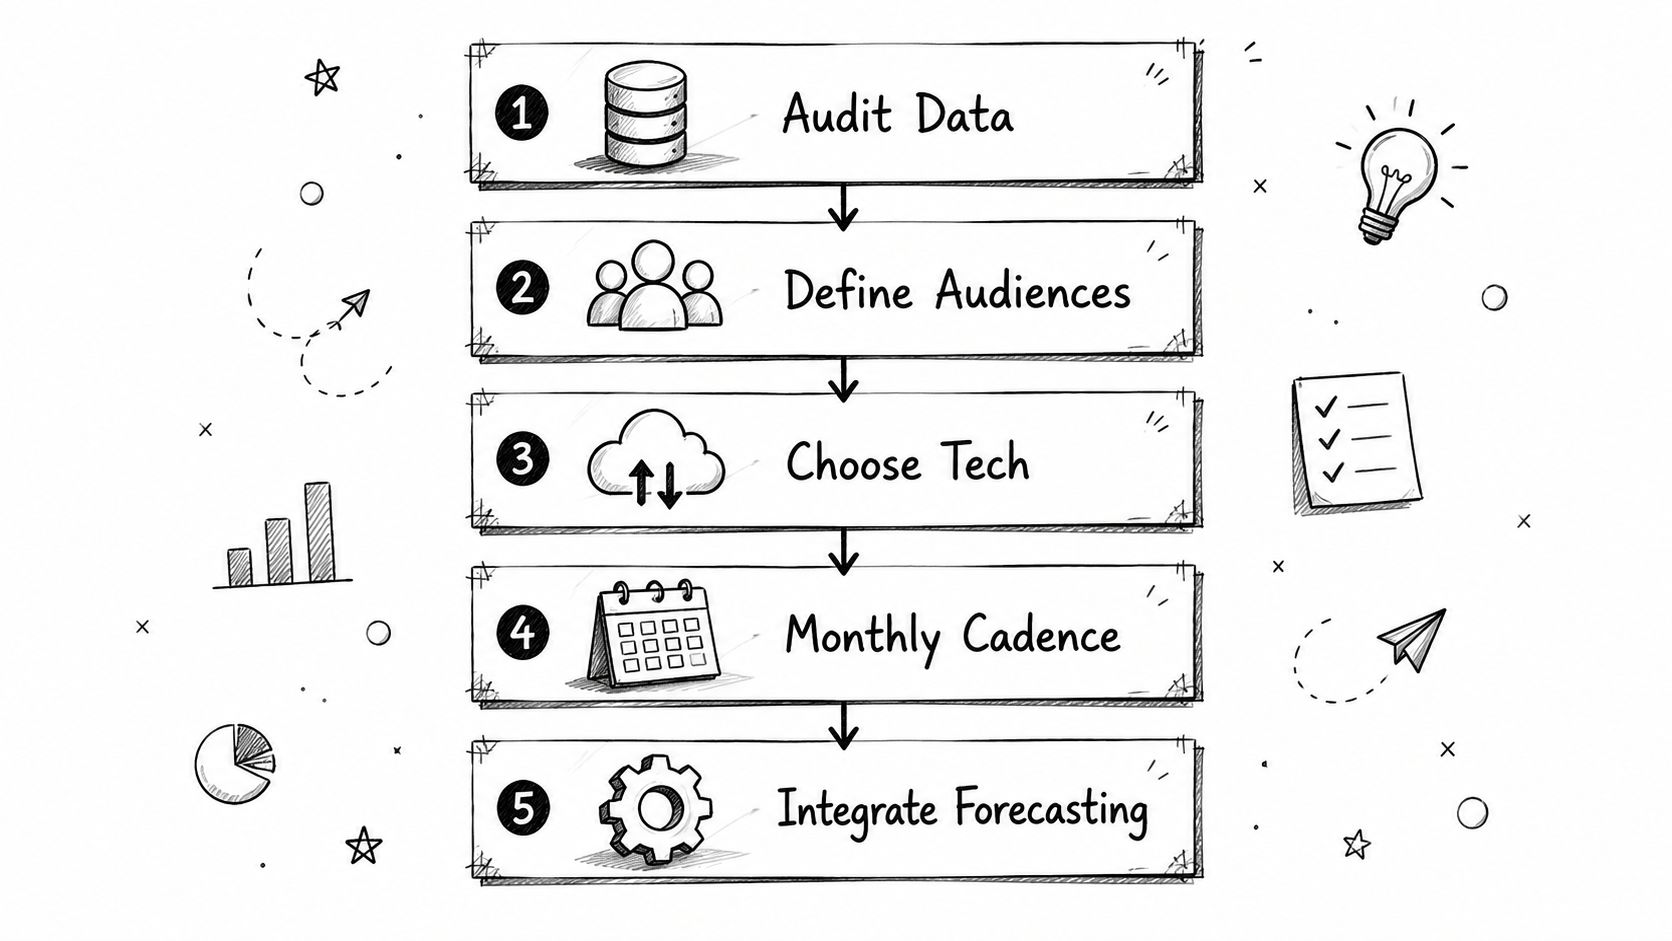
A fancy dashboard is useless if the data feeding it is wrong. The most common failure in financial reporting isn't complex software; it's a lack of basic data integrity. An unreconciled bank account can easily mask a future payroll shortfall or make your cash position look stronger than it is. Here’s a 5-step process to build a reporting system you can actually trust.
Step 1: Start with a Data Audit
Before you build anything, verify your numbers. You wouldn't trust a GPS using an old map, so don't trust reports built on unreconciled data.
Action: Pull your bank statements, accounts receivable aging report, and general ledger. Reconcile them. If they don't match, find out why before you proceed. This is the non-negotiable foundation.
Step 2: Define Your Audience and Their Questions
Your board, your sales manager, and your lender all need different information. A one-size-fits-all report usually serves no one.
Action: For each key stakeholder (CEO, department head, lender), list the top 3 questions they need answered. Design tailored report views for each. A report that directly answers a specific question gets used.
Step 3: Choose Integrated Tools
A disconnected tech stack creates manual work and introduces errors. Your accounting platform, ERP, and reporting tools should sync seamlessly.
Action: When selecting software like QuickBooks or an ERP, prioritize systems with strong, reliable integrations. The goal is a single source of truth, not three different versions of it.
Step 4: Set a Reporting Cadence That Matches Decision Speed
Many businesses fail by reviewing monthly reports while making daily cash decisions. This mismatch creates dangerous blind spots.
Action: Establish a dual cadence:
- Weekly: A tactical cash check-in using your 13-week cash flow model.
- Monthly: A strategic review with a one-page executive summary for leadership.
Step 5: Create a Forecasting Feedback Loop
Reporting shouldn't just look backward. Use your actual results to refine your forecasts.
Action: Compare your actual performance against your budget or forecast each month. The variance—the gap between what you predicted and what happened—is your most valuable learning tool. This continuous loop makes your future projections more accurate over time.
The 5-Step Framework at a Glance:
| Step | Focus | Key Action |
|---|---|---|
| 1. Data Audit | Accuracy First | Reconcile bank and AR to the general ledger now. |
| 2. Audience Definition | Tailored Insights | Create separate views answering each stakeholder's top questions. |
| 3. Integrated Tools | Eliminate Silos | Prioritize tech with reliable APIs to automate data flow. |
| 4. Reporting Cadence | Match Decision Speed | Combine weekly cash check-ins with monthly strategic reviews. |
| 5. Forecasting Loop | Continuous Improvement | Feed actuals back into rolling forecasts to get smarter every month. |
Case Study: From Messy Data to a $1.2M Cash Swing
A $30M services firm was struggling with inconsistent financial data. By standardizing their chart of accounts and implementing a weekly 13-week cash model, they gained clarity.
Discovery: Within two months, they uncovered a $200,000 receivable timing gap that had been hidden by messy data.
Numeric Outcome: By tightening their invoicing and collections process, they unlocked an additional $1.2M in available cash over the next quarter without adding a single new customer. That’s the power of trustworthy numbers.
Tools and Templates to Start Now
- One-Page Dashboard Template: Build a single view showing cash, DSO, gross margin by client, and 13-week cash runway.
- Reconciliation Checklist: Create a simple checklist to ensure bank accounts, payroll, and deferred revenue are reconciled monthly.
- Month-End Close Playbook: Assign clear owners and deadlines for closing tasks to shorten your close cycle by days.
When spreadsheets aren't enough, a fractional CFO can implement these systems for you, translating raw data into strategic decisions that increase cash flow and enterprise value.
Read also: Want to sharpen your approach to tracking variances? Check out our guide on Budget vs Actual Variance Analysis
Your Move This Week
Block 90 minutes on your calendar. Use that time to reconcile your main bank account and draft a one-page dashboard with cash and DSO. This single action will give you more clarity than you've had all year. If you want expert guidance, a fractional CFO can accelerate the process and ensure it leads to measurable results.
Leveraging Fractional CFO Services for Strategic Insight
Your business has outgrown a bookkeeper, but you’re not ready for a $200K+ full-time CFO. This is the gap where a fractional CFO provides immense value. They deliver high-level financial leadership on a flexible, part-time basis, focusing on the strategic numbers that drive growth and profitability.
At AmbitionCFO, our fractional CFOs focus exclusively on high-impact advisory—not bookkeeping or tax prep. We help you build and interpret the tools that matter: KPI dashboards, 13-week cash flow models, profitability analysis, and exit planning strategies.
How a Fractional CFO Transforms Your Reporting
- From Past to Future: They turn historical compliance reports into forward-looking decision tools with scenario analysis and rolling forecasts.
- From Messy to Meaningful: They standardize your chart of accounts so your KPIs are consistent and comparable over time.
- From Clutter to Clarity: They build a one-page executive dashboard that connects your cash position, margins, and DSO directly to the strategic decisions you need to make this week.
"Good reporting becomes a leadership tool — not an accounting chore."
Case Study: A $1.2 Million Cash Improvement
A $30M services firm engaged a fractional CFO to get control of their finances. The first step was implementing a weekly 13-week cash flow model.
Discovery: Within weeks, the model revealed a $200,000 cash gap caused by slow collections, which had been hidden in their monthly reports.
Numeric Outcome: By tightening their invoicing and collections cadence, they unlocked $1.2 million in working capital over a single quarter. That’s not a theoretical gain—that’s real cash on the balance sheet.
Your 4-Step Implementation Plan
- Audit Your Data: Reconcile your bank accounts to your books this week. Accuracy is the starting point for everything.
- Build a One-Page Dashboard: Track cash, DSO, and gross margin by client.
- Start Weekly Cash Check-ins: Use a 13-week cash model for tactical decisions, paired with a monthly strategic review.
- Engage Fractional CFO Support: An expert can operationalize your KPIs, drive accountability, and help you plan for a future exit.
For businesses needing strategic financial guidance without the full-time cost, understanding strategic financial leadership help is a game-changer.
Read also: Learn more about the role and tasks in our guide on What Does A Fractional CFO Do.
Your Next Move: Block 90 minutes on your calendar. Reconcile one bank account and sketch out a one-page dashboard. This might be the highest-ROI activity you do all quarter.
Frequently Asked Questions About Financial Reporting
Here are answers to the most common questions I get from founders about financial reporting.
How often should I review my financial reports?
For optimal control, use a dual cadence. Review liquidity and key operational metrics weekly. A rolling 13-week cash flow model is perfect for this. Then, conduct a deeper strategic review of your full financial statements monthly with your leadership team to discuss trends and make bigger decisions.
What is the difference between profit and cash flow?
This is the most critical concept for a founder to understand.
- Profit is an accounting calculation shown on your income statement (Revenue – Expenses = Profit).
- Cash Flow is the actual money moving into and out of your bank account.
A company can be highly profitable on paper but run out of cash due to slow-collecting receivables or high upfront inventory costs. Cash is the oxygen your business needs to survive.
| Profit (on Income Statement) | Cash Flow (in the Bank) | |
|---|---|---|
| What it measures | Financial performance and efficiency over a period. | Actual liquidity and ability to pay bills today. |
| Key risk if ignored | You can look profitable while heading for a cash crisis. | You might have cash but be masking deep-seated unprofitability. |
When should I hire a fractional CFO instead of just using my CPA?
A CPA is essential for tax compliance and historical accuracy. You should hire a fractional CFO when you need forward-looking strategic guidance. If you are building a 13-week cash flow model for the first time, planning a major capital investment, or starting to think about an exit in the next 3–10 years, a fractional CFO is your strategic partner. They help you see around corners, while a CPA ensures you followed the rules of the road.
Practical Steps You Can Take This Week
- Run a weekly bank-to-book reconciliation. This is the fastest way to ensure your cash numbers are real.
- Build a simple 13-week cash flow model in a spreadsheet. It doesn't need to be fancy to be effective.
- Calculate your gross margin by client. You'll likely be surprised by which clients are your most—and least—profitable.
A weekly cash check prevents surprises; a monthly strategic review drives growth.
A Real-World Example
A fast-growing services firm felt constantly cash-strapped despite strong profits. By implementing a weekly 13-week cash forecast, they identified a $200,000 gap caused by slow-paying clients. They tightened their collections process and unlocked $1.2 million in cash over the next quarter. Same clients, same business—just better visibility.
Ready to get this level of clarity for your business? AmbitionCFO specializes in building financial reporting systems that empower founder-led companies to make smarter, faster decisions.
Your Next Action: Visit https://www.ambitioncfo.com to schedule a consultation. Let's discuss what your numbers are trying to tell you and build a plan to turn those insights into cash.