

You're looking at a hiring decision, a new equipment purchase, or a contract that could change the shape of the business. The income statement says the work is profitable, yet cash feels tight. Accounts receivable keeps aging, payroll arrives on schedule, and the forecast you reviewed last quarter no longer matches what's happening this week.
The question isn't whether you know how to build financial models. It's whether your model can answer a decision before the cash leaves the bank. A useful model connects operating drivers to real cash dates, makes assumptions visible, and gives an owner enough confidence to act without pretending the future is certain.
Table of Contents
- Why Founders Need a Model Built for Decisions, Not Decks
- Designing the Architecture Before You Touch a Spreadsheet
- Building the 13-Week Cash Flow That Actually Predicts Cash
- Adding Scenarios and Sensitivity Without Breaking the Base Case
- Tailoring Drivers for Construction, Distribution, and Professional Services
- Validating the Model So You Can Defend the Numbers
- Embedding the Model Into Dashboards, Lenders, and Exit Planning
Why Founders Need a Model Built for Decisions, Not Decks
A specialty contractor once took a $1.4 million line-of-credit draw in March because the team hadn't reconciled projected retainage with actual accounts-receivable aging. By May, the business was close to missing a payroll run. The model had looked acceptable in a planning conversation, but it hadn't answered the question that mattered: when would collected cash arrive?
That distinction separates a deck model from a decision model. A deck model supports a board presentation or financing discussion. A decision model helps the owner decide whether to hire, how much to draw, what vendor terms to renegotiate, and when to pass on a job or contract.
Practical rule: If the model doesn't change a decision, it's probably reporting, not decision support.
The history of financial modeling helps explain why the distinction matters. Financial modeling became a formal discipline in the 1990s, and a systematic review found 296 publications in that decade, 747 in the 2000s, and 1,782 in the 2010s as better data access and computing made forecasting, scenario analysis, and risk modeling more practical (systematic review of financial modeling). Spreadsheet technology made that work broadly usable after VisiCalc's release in 1979, followed by Excel's Windows release in 1987 (history of spreadsheet-based financial modeling).
The technology isn't the problem. Conflating presentation confidence with operating accuracy is. A projection that earns a board nod can become a bait-and-switch when vendor terms change, a customer pays late, or a project's retainage remains outstanding.
| Attribute | Deck Model | Decision Model |
|---|---|---|
| Primary purpose | Explain the story | Guide the next action |
| Time horizon | Often annual or quarterly | Weekly near term, monthly and annual longer term |
| Detail | Summary assumptions | Drivers tied to operating activity and cash dates |
| Scenario use | Supports a narrative | Tests hiring, borrowing, pricing, and contract choices |
| Review standard | Looks polished | Is auditable, updateable, and stress-tested |
A practical model should sit alongside reliable reporting, not replace it. Owners who need a clearer view of how financial information supports decisions can use AmbitionCFO's overview of financial reporting fundamentals. For teams using automation or artificial intelligence, the same standard applies: an AI for financial analysis guide is useful only when the output remains traceable to trusted inputs and reviewable calculations.
Designing the Architecture Before You Touch a Spreadsheet
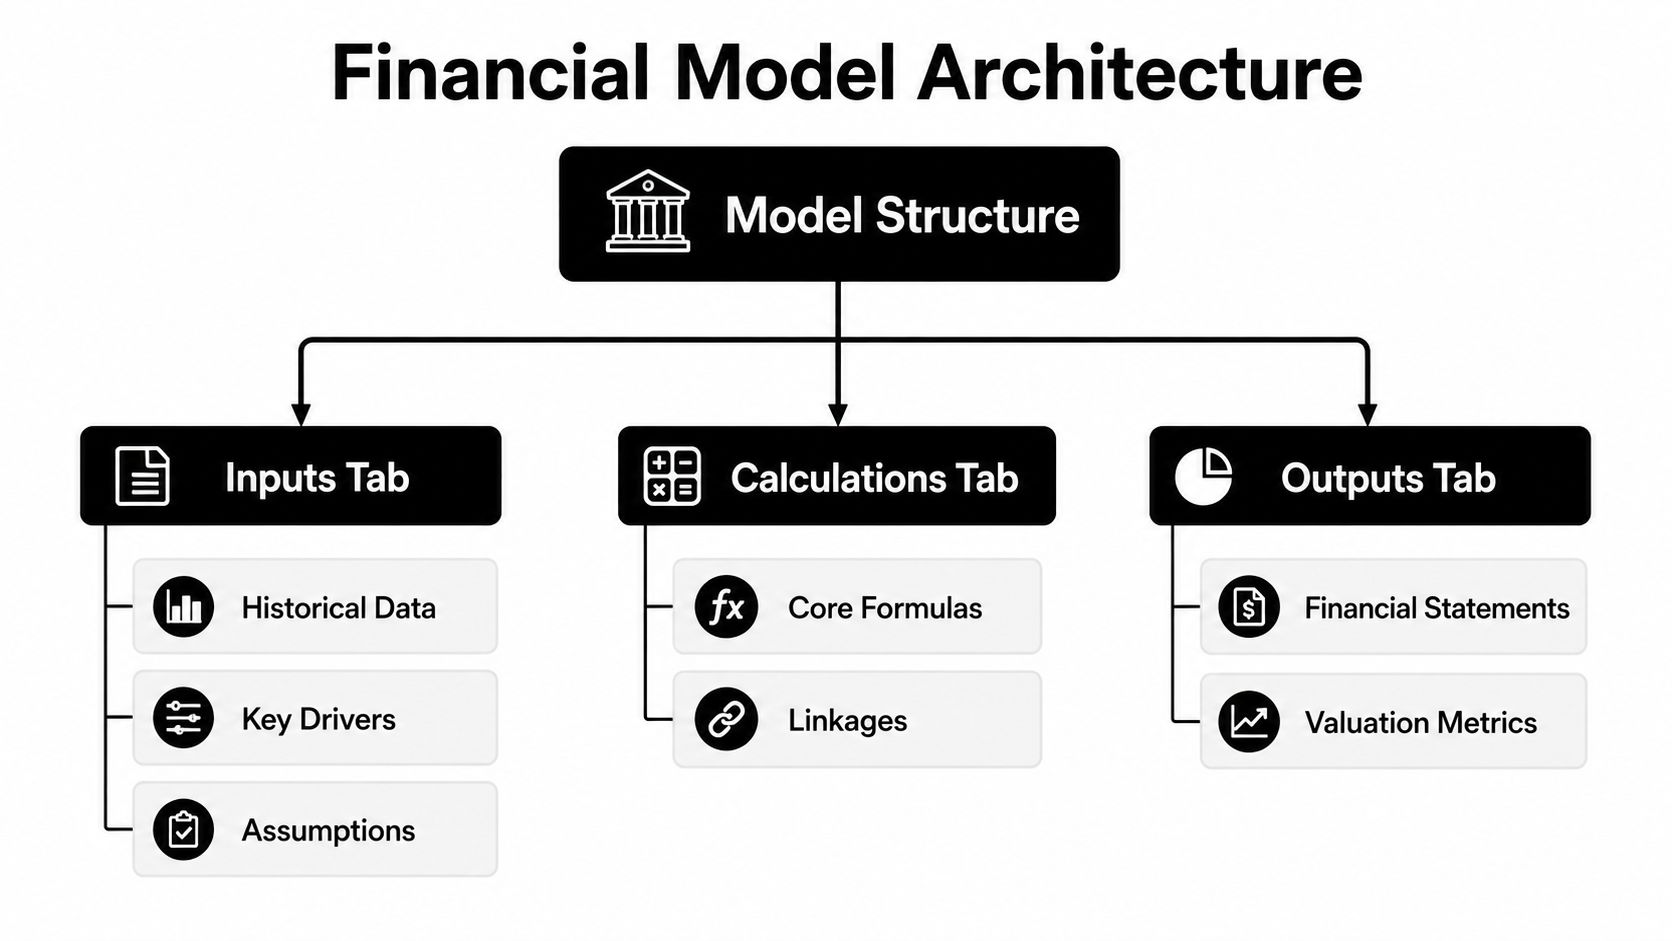
Open Excel only after you've decided what the model must answer and where each type of information belongs. The cleanest structure separates Inputs, Calculations, and Outputs. That separation reduces accidental hardcodes, makes review faster, and lets you change a business assumption without hunting through summary tabs.
Start with the three-layer structure
Inputs should contain historical data, operating drivers, assumptions, and control switches. Examples include customer payment timing, labor rates, price changes, headcount additions, inventory purchases, debt terms, and tax assumptions. Use consistent formatting and a clear label for whether each value is historical, management-entered, or linked from another system.
Calculations should contain the logic that turns inputs into outputs. You place ratios, depreciation, debt schedules, tax calculations, working-capital schedules, revenue ramps, and other supporting mechanics here. A department-level profit-and-loss schedule, headcount plan, or project forecast can live in a supporting tab and feed the calculation layer.
Outputs should present the income statement, balance sheet, cash flow statement, KPI dashboard, and decision summaries. Keep this layer readable. A lender, owner, or operating partner shouldn't need to trace through a dense calculation block to find projected cash.
The common violation is scattering hardcodes across output tabs. That creates multiple versions of the truth. If a price assumption appears in a dashboard, a revenue schedule, and a cash-flow tab, the model can produce a coherent-looking result while using inconsistent logic.
Test the flow with one controlled assumption
Suppose a distribution company wants to test a 2% price increase. Put the toggle and effective date in Inputs. The revenue schedule references that assumption, unit economics recalculate, gross margin updates, and the resulting cash from operations flows through the statements. No downstream formula should require manual editing.
That's the architecture test. If changing one driver requires editing several formulas, the model is too fragile.
A budget can also serve as a planning framework when it's connected to operational choices. Steingard Financial's discussion of budgeting as a roadmap offers useful context for treating the budget as more than a static spending limit. When the underlying systems need improvement, document the dependencies before rebuilding the workbook, using a structured approach such as upgrading a financial system.
Building the 13-Week Cash Flow That Actually Predicts Cash
A 13-week cash flow model answers a direct question: will weekly cash stay above zero, and when will the company need financing, collections action, or cost cuts? Build it from real cash receipts and disbursements, not accrual estimates. The core roll-forward is opening cash, weekly inflows, weekly outflows, and closing cash, with each closing balance becoming the next week's opening balance (13-week cash flow forecasting).
Start with columns for customer collections, other inflows, payroll, vendor payments, taxes, debt service, inventory purchases, capital spending, financing activity, net movement, closing cash, and covenant headroom. Put each item in the week when the cash is expected to move. Payroll belongs on the actual payroll date. Vendor payments belong on the expected payment date, not automatically on the invoice date. Receivables should be re-dated using aging, payment terms, and known slow payers (13-week cash flow model mechanics).
| Week | Opening Cash | AR Collections | Other Inflows | Payroll | Vendor Payments | Closing Cash | Covenant Headroom |
|---|---|---|---|---|---|---|---|
| Week 1 | Input | Customer-specific | Input | Actual date | Due-date schedule | Roll-forward | Minimum cash or covenant |
| Week 2 | Week 1 close | Aging-based | Input | Actual date | Due-date schedule | Roll-forward | Minimum cash or covenant |
| Week 3 | Week 2 close | Aging-based | Input | Actual date | Due-date schedule | Roll-forward | Minimum cash or covenant |
| Weeks 4–13 | Prior close | Updated weekly | Updated weekly | Actual date | Updated weekly | Roll-forward | Minimum cash or covenant |
Build payment timing into the grid
A more detailed schedule separates payments by confidence and expected timing. Scheduled payments may fall in weeks 1–2, approved open invoices in weeks 2–5, received but unapproved invoices in weeks 3–6, recurring payments across the full forecast, and open purchase orders converted into estimated cash payments in weeks 5–13 (detailed 13-week cash flow construction).
Consider an HVAC distributor with roughly $45 million in revenue. If its collection cycle produces a 28-day DSO, cash may reach a five-week trough before the second-quarter purchasing season begins. The model should show the expected collection week for each material receivable, then add factoring advances or revolver draws in the week those funds become available. The point isn't to predict a single perfect balance. It's to expose the timing gap early enough to negotiate terms or secure liquidity.
Update the model every Tuesday using the prior week's actual receipts and disbursements. Replace forecast values with actuals, explain variances, and roll the remaining weeks forward. That habit turns the workbook into a forward radar instead of a backward report. A structured operating process is more important than elaborate formatting, which is why a practical 13-week cash flow model should be treated as a weekly management tool.
For a clean presentation layer, a cashflow report UI block can help teams think through how cash information should be displayed for review. The underlying schedule still needs transaction-level timing and owner judgment.
Adding Scenarios and Sensitivity Without Breaking the Base Case
Scenarios earn their place when they change a decision. A base case, upside case, and downside case should share one calculation engine while using separate input blocks. A selector can switch the active assumptions, but the formulas should remain unchanged.
Start with plain-language assumptions. “Customers pay four days later” is more useful than “DSO stress variable.” “Gross margin falls because supplier pricing changes” is easier for a lender to challenge than a coded scenario name.
Keep the stress test narrow
A $40 million distribution business might test gross-margin compression against slower collections. The important variables are the ones that move the cash answer, such as gross margin, DSO, and backlog conversion. A sensitivity table can show the projected end-of-day cash in week 13 as gross margin changes and DSO extends.
| Gross Margin Scenario | DSO +0 days | DSO +4 days | DSO +8 days |
|---|---|---|---|
| Base margin | Model output | Model output | Model output |
| Margin compression | Model output | Model output | Model output |
| Upside margin | Model output | Model output | Model output |
The table should be populated by the workbook, not invented in the article or manually typed into the output. In Excel, a data table, scenario manager, or separate scenario selector can perform the mechanics. The method matters less than preserving a single source of calculation logic.
A sensitivity analysis changes one variable or a defined set of variables to show how the answer responds. A scenario analysis changes a coherent operating story, such as slower collections combined with supplier pressure and delayed backlog conversion. The distinction is explained in this guide to the difference between sensitivity analysis and scenario analysis.
The temptation is to model every possible driver. Resist it. KPMG recommends measuring absolute forecast error as the absolute forecast error divided by the realized amount, which gives teams a consistent way to compare forecast performance across periods and businesses (forecast accuracy guidance). KPMG also warns that excessive complexity can create spurious accuracy, where a model looks complex but becomes less reliable because people can't maintain or interpret it.
Use the scenario output to make a decision. If the downside case breaches minimum cash, pause hiring, renegotiate vendor terms, or price the contract differently. If no action changes, the scenario is decorative.
Tailoring Drivers for Construction, Distribution, and Professional Services
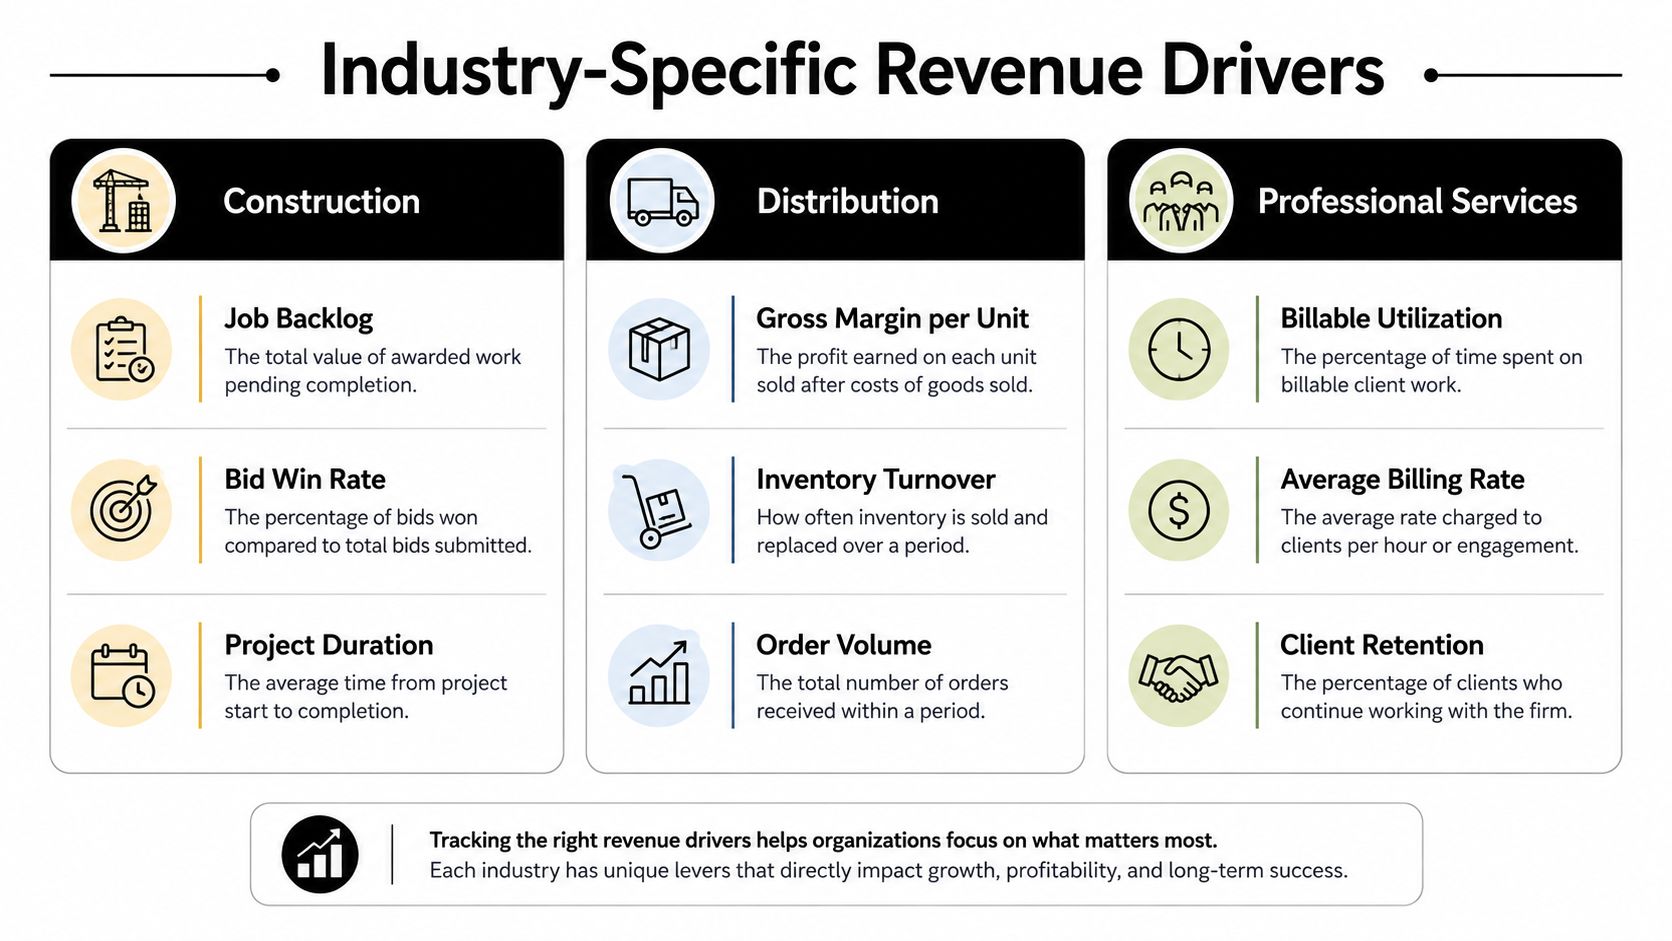
A model that treats revenue the same way across industries will mislead the owner. Construction, distribution, and professional services each convert activity into margin and cash through different operating mechanics.
Construction
Construction revenue depends on the project schedule and the cost required to finish the work. The model should track job cost-to-complete, retainage timing, WIP aging, approved change orders, and billing status. A profitable job can still consume cash when labor and materials are paid before progress billings or retainage collections arrive.
The weekly dashboard should surface:
- Backlog conversion: Which signed work will convert into billings and collected cash?
- Projected gross margin by job: Which jobs are drifting from estimate?
- WIP and retainage aging: Which balances are delaying cash?
The assumption most likely to sink the forecast is cost-to-complete. If the estimate is stale, revenue timing and margin both become unreliable.
Distribution
Distribution businesses live on the relationship between order volume, unit margin, inventory purchases, freight, and supplier terms. Revenue growth can increase the cash requirement when the company buys inventory before collecting from customers.
Track gross margin per unit, inventory turnover, order volume, aged receivables, and vendor payment timing. The dangerous assumption is inventory demand. Overestimating sales can leave cash trapped in stock, while underestimating demand can create service failures and rushed purchases.
Professional services
Professional services firms should model billable utilization, average billing rate, realization, client retention, and bench cost. Revenue depends on people's capacity and the percentage of recorded work that becomes collectible revenue.
The weekly dashboard should show:
- Billable utilization: How much available capacity is producing billable work?
- Realization: How much recorded work becomes billed and collected?
- Headcount cost per revenue dollar: Is the staffing plan ahead of demand?
The fastest forecast killer is usually the revenue ramp. Hiring ahead of signed work creates a cash burden even when the annual plan looks reasonable.
If each owner could watch one number on Monday morning, a contractor should watch projected cash after retainage timing, a distributor should watch inventory-adjusted cash availability, and a services firm should watch near-term billable capacity against committed payroll. Those numbers force attention onto cash-producing activity rather than vanity metrics.
Validating the Model So You Can Defend the Numbers
Most model failures are governance failures wearing a formula error. One cell may be wrong, but the deeper problem is often that nobody owns the assumptions, records changes, or challenges the story.
The warning signs are well documented. One cited study found that 94% of business spreadsheets contain critical errors, while another source reports that 88% of spreadsheets contain errors (financial modeling mistakes and controls). These figures describe spreadsheet error prevalence, not a guarantee that every model will fail, but they justify a serious review process.
Use three separate reviews
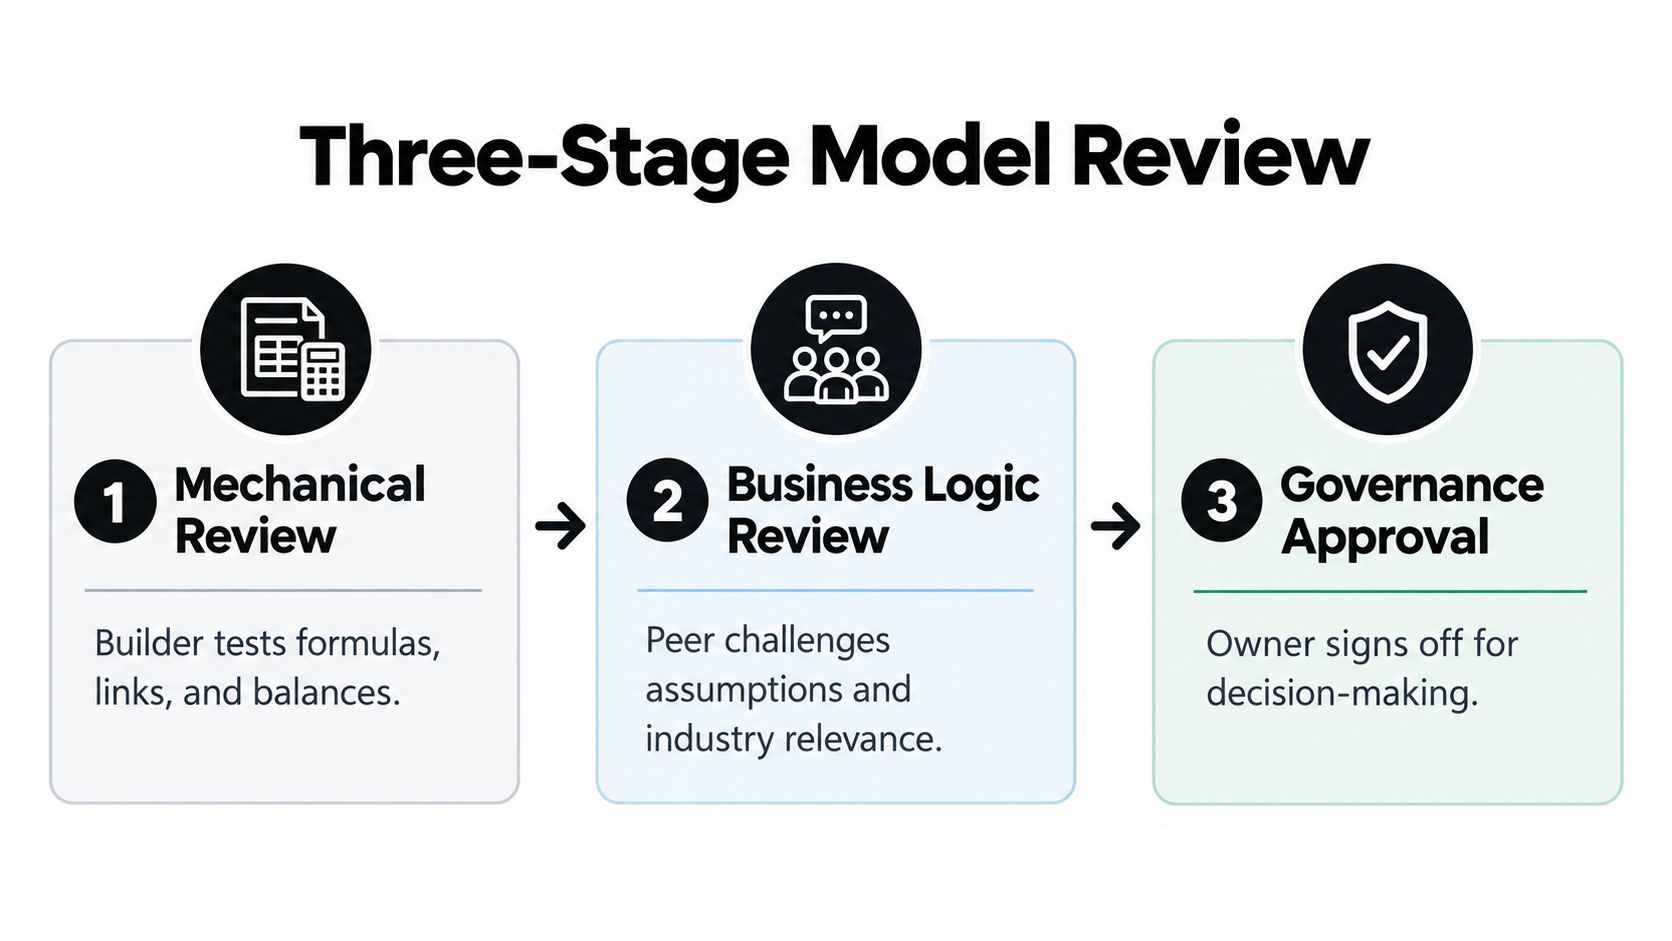
Mechanical review comes first. The builder checks formulas, links, balances, sign conventions, foot totals, and error flags. Reconcile net income to the cash flow statement, confirm that the balance sheet balances, and inspect every major subtotal.
Business logic review asks whether the model resembles the company. A peer should challenge job margins, collection timing, hiring dates, inventory assumptions, and backlog conversion. In construction, use the “phone-a-customer” test. If the model assumes a major receivable arrives in a particular week, can someone contact the customer and defend that timing?
Governance approval belongs to the owner. The owner signs off on the assumptions and the decision the model supports. Approval doesn't mean the forecast is certain. It means the business knows what it believes, why it believes it, and what would change the plan.
A three-stage workflow of formula auditing, sensitivity analysis, and peer review has been cited as capable of reducing error rates by up to 60% (model validation controls). Treat that as a control benchmark, not a promise.
Leave an audit trail
Create an assumptions log with the assumption name, value, source, owner, effective date, and reason for the change. Save versions with the period and status in the filename, then maintain a one-page changelog describing what changed and why.
If a lender opens the model in six months, the first broken assumption should be easy to find.
Ask that question every time you update the file. If a lender audits the model later, where will they break it first? The answer may be an unsupported collection assumption, a hardcoded summary figure, or an unexplained margin change. Fix that weakness today, while the evidence is still available.
Embedding the Model Into Dashboards, Lenders, and Exit Planning
A financial model becomes valuable when it creates a repeatable operating rhythm. Each week, leadership should review trailing-13 cash, AR aging buckets, gross margin by service line, headcount cost per revenue dollar, and the decisions attached to those numbers. The dashboard should show what moved, why it moved, and who owns the response.
A separate presentation may be appropriate for each audience, but the underlying calculations should come from the same controlled model.
| Audience | Model Output | Cadence | Decision It Drives |
|---|---|---|---|
| Owner and leadership team | Cash, margin, working capital, operating KPIs | Weekly | Hire, spend, price, collect, or defer |
| Lender | Debt service coverage ratio, borrowing-base reconciliation, forward-13 liquidity covenant view | Agreed reporting cadence | Draw, repay, amend, or preserve headroom |
| Board or operating partner | Forecast variance, scenarios, strategic drivers | Monthly or quarterly | Approve investment and adjust priorities |
| Prospective buyer | Quality-of-earnings adjustments, normalized EBITDA bridge, trailing-24-month revenue and gross-margin trends | Transaction process | Assess earnings quality and risk |
Prepare the model for external scrutiny
Lenders care about liquidity and repayment capacity. Give them a clear debt service coverage ratio, a borrowing-base reconciliation, and a forward-13-week view of liquidity covenant compliance. Don't send a polished output that can't be traced back to collections, payroll, inventory, and vendor schedules.
Buyers scrutinize the bridge from reported earnings to normalized EBITDA, the quality-of-earnings adjustments, and trailing-24-month cohort trends in revenue and gross margin. The model should explain whether performance comes from repeatable customer economics or a temporary project, pricing event, or staffing pattern.
For the owner, a practical KPI dashboard design approach can help convert the model into a focused management view. Keep the dashboard narrow enough that the leadership team can discuss each number and assign an action.
Before beginning a transaction process, have these four artifacts ready:
- A documented assumptions log with owners, sources, effective dates, and change notes.
- A reconciled 13-week cash flow showing actuals replacing prior forecast periods.
- A normalized earnings bridge that explains adjustments and supporting schedules.
- A scenario and sensitivity file showing the variables that could change liquidity, margin, and valuation.
For long-range capital decisions, model inputs and statements annually across the life of the investment. If an investment has no finite life, best-practice guidance uses a 30-year period, with terminal value added in the final year when the proposal extends beyond that period (Commonwealth financial management guidance). The same principle applies to exit planning: define the horizon, document the terminal assumptions, and make the result explainable.
AmbitionCFO builds 13-week cash flow models, operating forecasts, margin analyses, KPI dashboards, and exit-planning schedules for founder-led companies in construction, distribution, and professional services. If your current spreadsheet can't answer what to hire, collect, borrow, renegotiate, or decline this week, visit AmbitionCFO to discuss building a decision model around your actual cash dates and operating drivers.