

Most variance advice starts with the wrong conclusion: expenses under budget are good, revenue over budget is good, and the rest is just arithmetic. That shortcut can make a profitable month look healthy while your bank balance is heading toward a crisis. For a founder, actual vs budgeted analysis only earns its keep when it explains what happened to profit, what happened to working capital, and whether there's enough cash to meet the next obligation.
A construction firm can show $180,000 in favorable expenses while its line of credit is nearly maxed because customer retainage is still outstanding and large draws have shifted into the next quarter. Another company can be $90,000 over budget on labor because it hired and trained a crew that helped secure a high-margin contract. One label says “good,” the other says “bad.” Neither tells you whether management made the right decision.
Table of Contents
- Why a Favorable Variance Can Still Be a Red Flag
- The Core Vocabulary Every Owner Should Know
- Three Views of the Same Numbers
- The Four Variance Drivers That Matter Most
- Connecting Profit Variance to Cash Flow
- A Dashboard You Can Read in Five Minutes
- Turning Variance Review Into Forward-Looking Decisions
Why a Favorable Variance Can Still Be a Red Flag
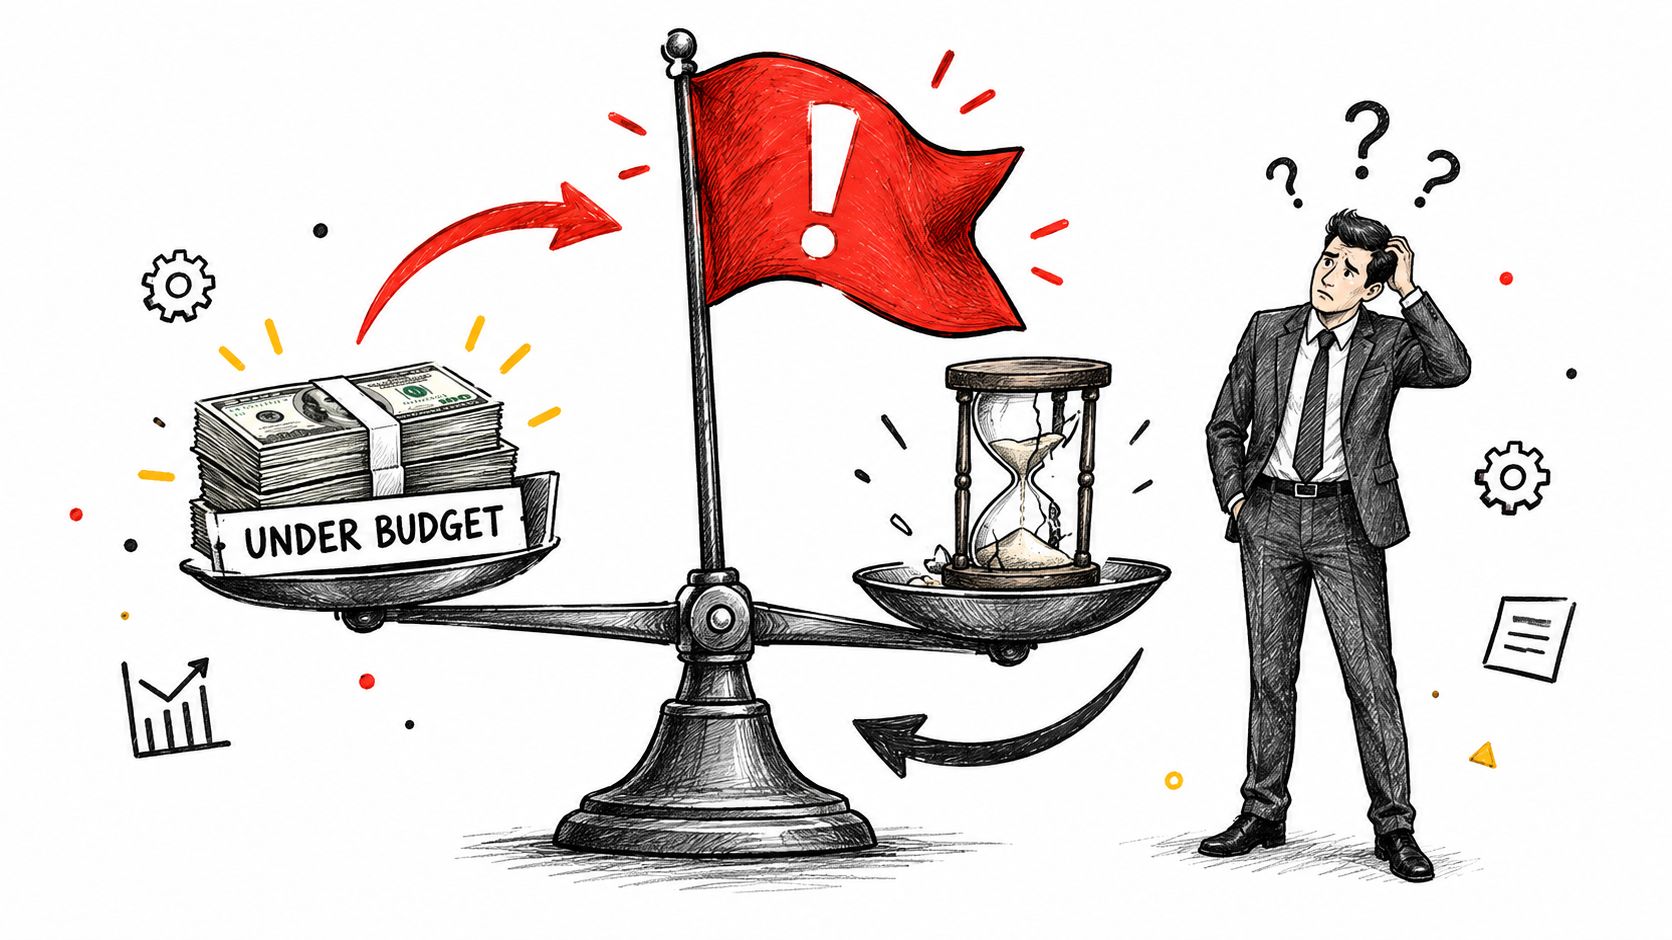
The owner sees expenses below budget and assumes the business is running efficiently. But the construction company's favorable expense variance came with a cash crunch: retainage hasn't been collected, and two major customer draws have been deferred. The income statement records performance over a period. It doesn't show, by itself, when cash will arrive or which bills are coming due.
That distinction matters in public-sector analysis, too. A study of U.S. cities found that expenditure variances measured against original budgets ranged from 7.7% unfavorable to 22.1% favorable, with a mean of 2.4% favorable. Against final budgets, the range was 13.4% unfavorable to 24.8% favorable, with a mean of 3.7% favorable. The wider range against final budgets reinforces why leaders need to know which benchmark they're using and what changed during the year (GAO's city budget-to-actual analysis).
A good-looking P&L can hide a bad cash position
Under-spending might mean the team avoided waste. It might also mean the company postponed maintenance, delayed hiring, or delivered less work than planned. Those choices can reduce costs today while weakening capacity or pushing revenue into a later period. A favorable variance deserves a question, not a congratulatory email.
Now consider the $90,000 unfavorable labor variance. If that extra labor funded a crew expansion that helped win a high-margin contract, the overspend may be a deliberate investment. The right follow-up is whether the crew is productive, the contract is profitable, and the company can fund the ramp-up. Calling the variance “bad” without that context could prompt management to cut the very capacity that supports future earnings.
Practical rule: Don't grade a month by the variance label. Ask what changed, when the cash moves, and whether the decision advances the company's plan.
A budget is an assumption set, not a financial fact. The GAO recommends comparing estimates with actual performance, documenting and reviewing variances, updating estimates as actual data becomes available, and retaining historical cost data for future estimates (GAO's cost-estimating guidance). For a founder-led business, that means using variance analysis to choose an action, not to assign a passing or failing grade.
The Core Vocabulary Every Owner Should Know
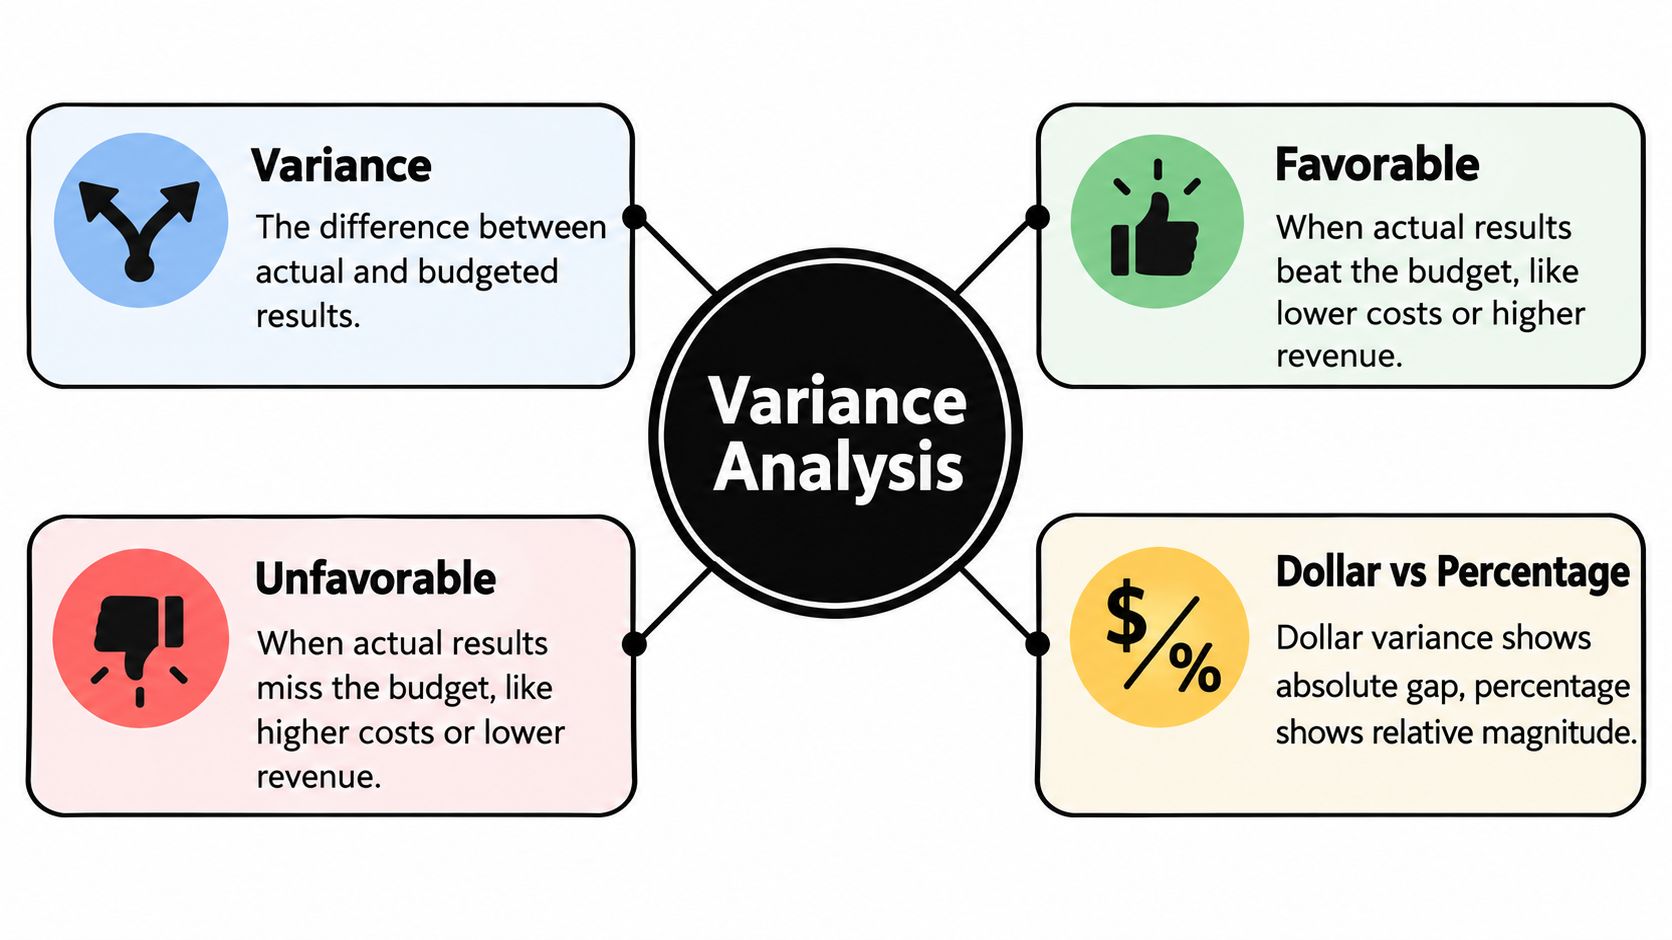
A variance is the difference between an actual financial result and its corresponding budget. Whether that difference is favorable or unfavorable depends on its effect on profit. Revenue above budget is generally favorable; expenses above budget are generally unfavorable. For other line items, check the business meaning before assigning a label.
Take revenue budgeted at $500,000 and actual revenue of $460,000. Actual revenue is $40,000 below budget, so the revenue variance is unfavorable. If expenses were budgeted at $300,000 and actual expenses came to $315,000, expenses are $15,000 above budget, also unfavorable. Those examples follow the standard convention used in managerial accounting (OpenStax's explanation of budgets and goal evaluation).
Use both dollars and percentages
The dollar variance tells you the size of the gap in cash terms. The percentage variance shows the gap relative to the budgeted amount. A $20,000 overrun on a $100,000 expense budget is a 20% unfavorable variance; a $200 difference on the same budget is 0.2%. The first deserves investigation sooner. The U.S. Small Business Administration recommends calculating both measures and focusing management attention on material exceptions rather than every small fluctuation (SBA guidance on budget and forecast mistakes).
Two benchmarks answer different questions. The original budget captures what you planned at the start of the period. The rolling forecast captures what you now expect, based on current information. Compare actuals with both: the original budget shows how far you've moved from the plan, while the rolling forecast supports decisions using today's assumptions.
A static budget assumes one activity level. A flexible budget recalculates expected revenue and costs using the activity level achieved. If a distributor plans for 10,000 units but ships 12,000, actual costs will naturally differ from a budget built for fewer units. A flexible budget estimates what those costs should have been for the higher volume, helping separate a demand shift from a purchasing or productivity problem (MIT's management accounting material on flexible budgets).
For owners building or refining a business plan, a complete funding guide for veterinary clinics can offer a useful example of how financial planning and operating assumptions fit together.
Three Views of the Same Numbers
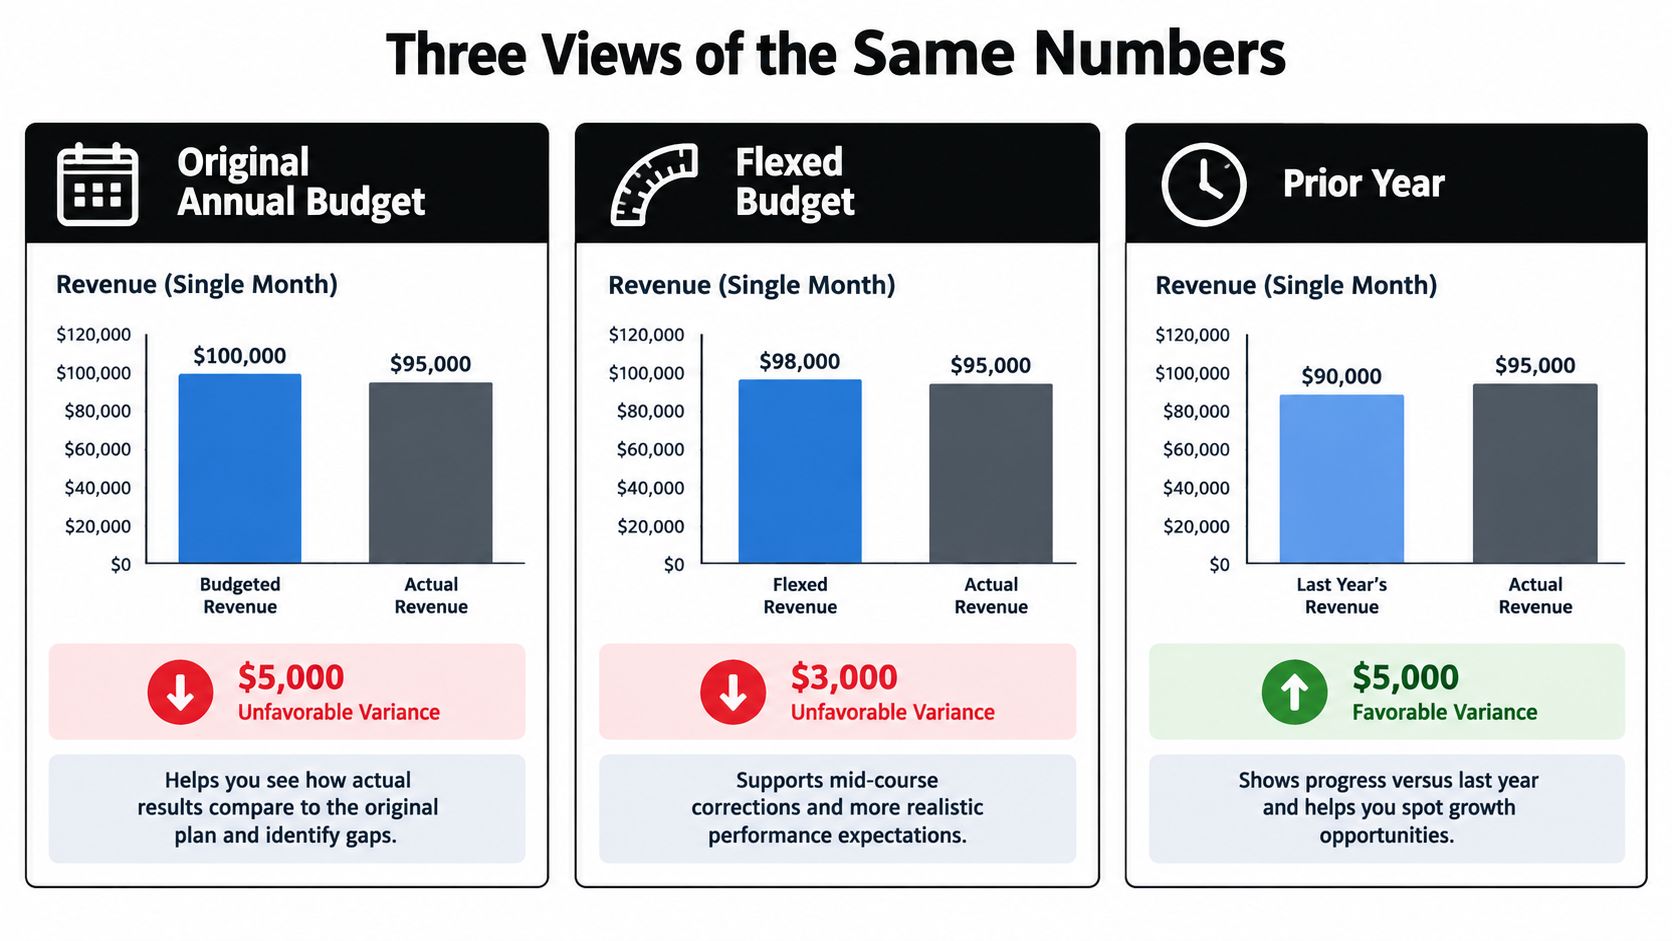
One variance report can tell three different stories, depending on the benchmark. Ask your finance team for the original budget, an activity-adjusted comparison, and the current forecast. Each view answers a different management question.
Consider a distributor that planned to ship 10,000 units but shipped 12,000. It reports an unfavorable cost variance against the original budget. That result matters, but it combines the effect of increased volume with any changes in purchase price, labor efficiency, or other costs. It doesn't yet tell you which problem to fix.
Original budget for accountability
The original-budget comparison answers: How did actual performance differ from the plan we approved? Keep it visible even after the forecast changes. Otherwise, repeated revisions can erase the history of planning assumptions and make it difficult to learn whether the team consistently overestimated sales or underestimated costs.
Flexed budget for operational control
The flexed-budget comparison adjusts expected results to reflect the activity achieved. If the distributor's costs exceed the flexed expectation, investigate purchasing, labor hours, or productivity. If costs align with it, the apparent overrun against the original plan may largely reflect the additional volume rather than poor control. The point is to judge execution against a fair activity-based expectation.
Rolling forecast for current decisions
The rolling forecast asks whether the company is still on track for its latest outlook. It guides hiring, purchasing, cash planning, and customer commitments. Don't treat it as a replacement for the original budget; use it as a current decision tool alongside the original and flexed views.
For a fuller explanation of how budgets and forecasts serve different purposes, see this guide to budget vs. forecast. Your accounting package may show only one comparison by default. Ask your team to show all three, and ask them to name the decision each one supports.
This video provides another perspective on interpreting financial results:
The Four Variance Drivers That Matter Most
A line labeled “unfavorable cost variance” isn't a diagnosis. It's a prompt to find the driver. In construction, distribution, and professional services, start with four possibilities: volume, price, mix, and timing.
Volume
Volume variance comes from doing more or less work than planned. A distributor shipping more units may spend more on freight and labor even when cost per unit is on target. A contractor completing fewer projects than expected may have a revenue shortfall despite controlling job costs. Check units shipped, jobs completed, billable hours, or customer demand before calling the cost overrun a management failure.
Price
Price variance shows that the amount paid or charged differs from the plan. If materials cost more than expected, review supplier pricing, purchase timing, and contract terms. If a professional-services firm bills lower rates than budgeted, check discount approvals and whether the rate card still reflects the work being sold. The response may be a supplier negotiation or a pricing update, not a blanket spending freeze.
Mix
Mix changes when the business sells a different combination of jobs, products, or services than planned. Revenue may hold steady while gross margin weakens because more sales came from lower-margin work. Review profitability by job, client, or product, then adjust sales targeting and contract selection. Company-wide averages can hide a meaningful shift in where the revenue came from.
Timing
Timing variance means revenue or expenses landed in a different period than expected. Retainage, late customer collections, accrued costs, prepaid expenses, and deferred revenue can all shift the reported result. Match the variance to invoices, payment dates, job progress, and supplier terms, then decide whether the issue calls for a collection push, billing change, or updated forecast.
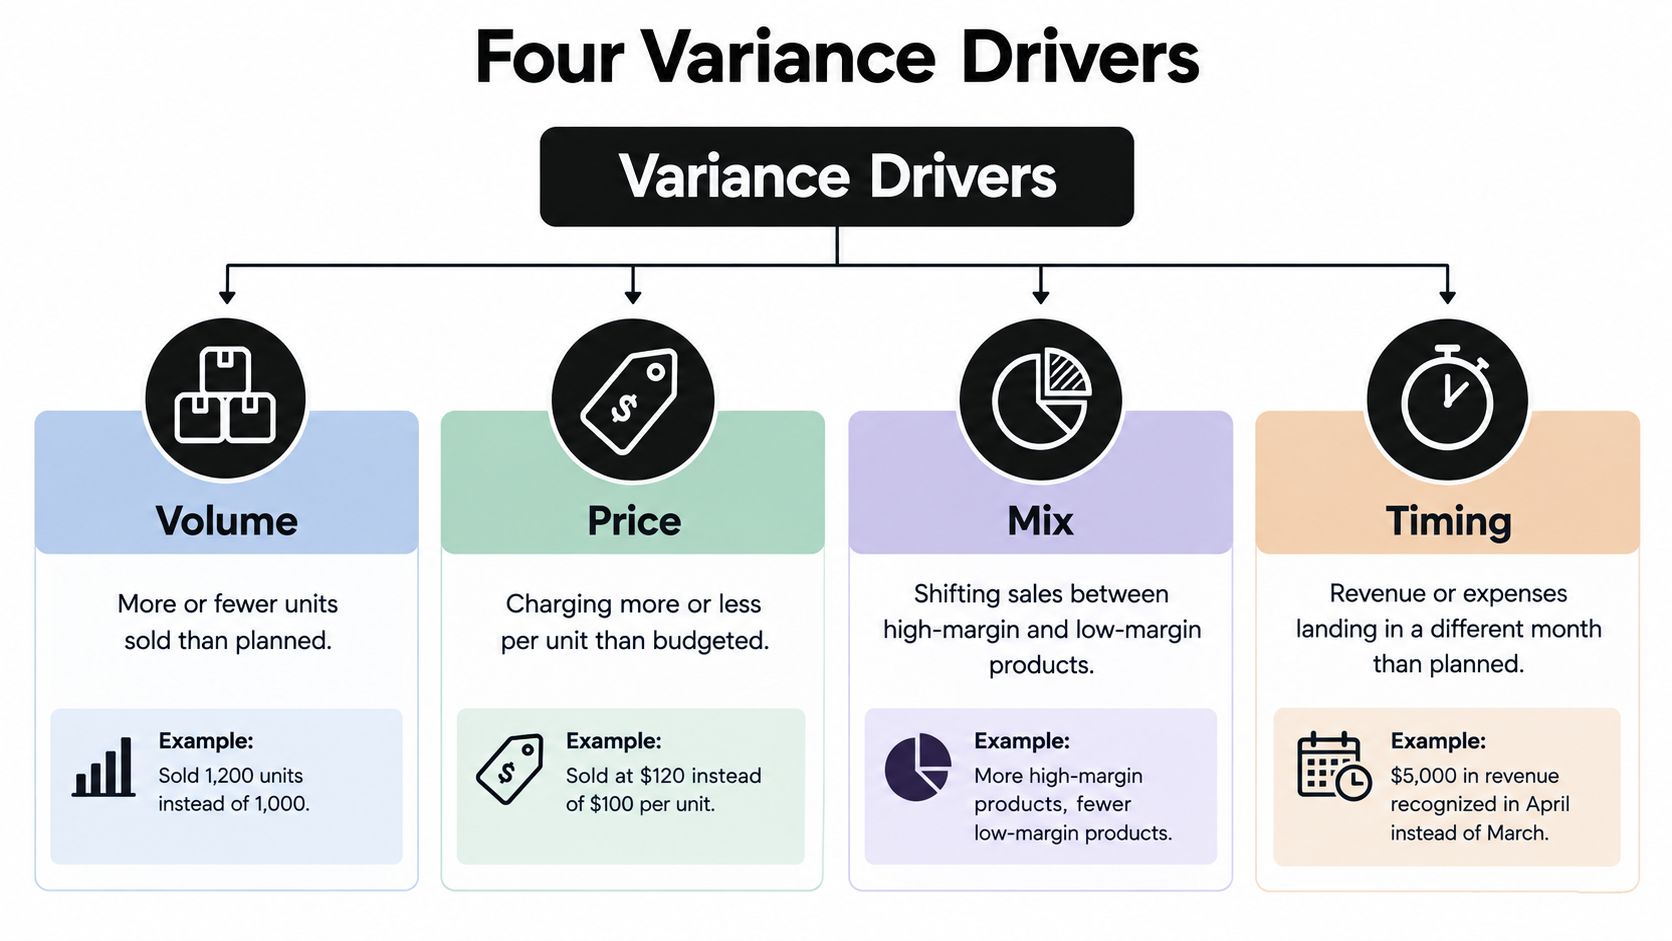
Map each material variance to one of these drivers before assigning corrective action. A deeper review of factors affecting cost can help your team distinguish a cost increase driven by activity from one caused by pricing or execution.
Connecting Profit Variance to Cash Flow
Profit and cash are related, but they're not interchangeable. A business can record revenue before collecting it, buy inventory before selling it, or pay down debt without that principal payment appearing as an operating expense. That's why a favorable P&L variance can sit beside a deteriorating bank balance.
Start with operating profit, then account for what changed in working capital. Receivables absorb cash when customers owe more than before. Payables preserve cash temporarily when the company owes suppliers more. Inventory uses cash as it grows. Other accruals and timing items can also push cash receipts and payments into a different period than the related revenue and expense.
Suppose a distributor books $850,000 in P&L profit but generates only $310,000 in operating cash. The difference is $540,000, tied in this example to growing inventory and slower-paying accounts receivable. The profit result still matters, but it doesn't tell the owner whether there's enough liquidity to make payroll or fund upcoming purchases. For a broader grounding in these cash-conversion movements, review what net working capital means.
Keep three decisions separate
A practical review separates profit variance, working-capital variance, and liquidity variance. Profit variance asks whether the business earned more or less than planned. Working-capital variance asks why cash is tied up in receivables, inventory, or supplier balances. Liquidity variance asks whether available cash and borrowing capacity can cover near-term commitments.
A cash forecast makes those questions concrete. The 2025 KeyBank survey found that 46% of small-business owners said they were certain they could cover one month of operating expenses in an emergency, while 33% wanted advisory support for cash-flow management and financial planning or forecasting (KeyBank's 2025 small-business survey). The lesson for your company isn't to copy a benchmark. It's to make sure your profit review is paired with a forward view of cash. A variance analysis data type guide can also help clarify how to classify forecast-versus-actual cash information.
Use these three rules at the next close:
- Check collections: Don't trust a favorable expense variance until you've checked customer receipts and overdue invoices.
- Reconcile revenue: Before acting on an unfavorable revenue variance, review backlog, bookings, job progress, and billing timing.
- Forecast cash: Run a 13-week cash forecast alongside the monthly variance report so leadership can see liquidity pressure before it arrives.
A Dashboard You Can Read in Five Minutes
A useful dashboard doesn't bury an owner in rows of unexplained numbers. It puts the most decision-relevant information on one page, with the cause and next action beside each material variance. You should be able to scan the results and know what needs a conversation.
Use five blocks:
- Summary scorecard: Show revenue, gross margin, operating profit, cash, and backlog against the relevant plan or forecast.
- Top variances: List the largest material items, with the operational cause beside each one.
- Profit-to-cash bridge: Explain the main movements from reported profit to operating cash.
- Forecast update: Show what has changed in the outlook and which assumptions were revised.
- Action list: Name the owner, next step, and due date for every decision that needs follow-through.
Each variance row should contain the line item, budget, actual, dollar variance, percentage variance, direction, operational cause, and action. The direction should reflect the effect on profit, not whether the arithmetic difference is positive or negative. Include only items that are material to a decision or recurring often enough to signal a pattern.
Set escalation triggers before the close
Some exceptions need a leadership conversation immediately, rather than a note for next month. Set and document your company's thresholds for collection delays, margin deterioration, and execution against backlog. The dashboard described here uses three example triggers: collections slipping more than 10 days versus terms, gross margin falling more than 200 basis points against plan, or backlog conversion dropping below 70% of forecast. These are operating thresholds from this dashboard design, not universal benchmarks. Adjust them to your contracts, cash cycle, and risk tolerance.
If a trigger fires, name the decision-maker and the next action. A threshold without an owner is just another number on the page.
You can build this layout in a spreadsheet or adapt an existing reporting system. The objective is a clear output, not a particular software product. For ideas on organizing measures into a visual report, this overview of business intelligence reports for auto shops offers a related example. A KPI dashboard guide can help you think through how to present measures consistently.
Turning Variance Review Into Forward-Looking Decisions
Variance analysis earns its place when it changes a decision. If the team spends the monthly review explaining last month but leaves the forecast untouched, it's keeping score, not managing the business. Use the pattern in the variances to decide what to price, hire, buy, or sell next.
Set a clear monthly cadence:
- By day five, close the books and confirm the source data is ready.
- By day eight, write variance commentary for material exceptions, including the operational cause.
- By day ten, complete the profit-to-cash bridge and identify working-capital pressure.
- By day twelve, review the dashboard with the people who can make the required decisions.
- By day fifteen, update the rolling forecast to reflect changed assumptions.
Then connect the pattern to the decision. Repeated price shortfalls on renewals point toward reviewing rate cards and discount discipline. Labor costs rising alongside confirmed demand may support hiring ahead of work, while rising labor costs without corresponding output call for a productivity review. Repeated equipment and repair variances can inform a capital purchase decision, but only after checking affordability and expected use. Persistent margin weakness in a type of contract should affect which work the sales team pursues.
A scenario-planning process helps owners compare options before committing resources. Use scenario planning to test what happens to cash and profit if hiring, pricing, timing, or demand shifts. Your past variance patterns give those scenarios a better starting point than guesswork.
Make the next close useful. Bring the original budget, current forecast, actual results, and cash outlook into one working session, then assign an owner to every material variance and decision. Update the forecast when the assumptions change, not merely when the calendar turns.
AmbitionCFO provides fractional CFO support for founder-led businesses, including variance analysis, financial forecasting, cash-flow modeling, and KPI dashboards. If you want to connect your monthly results to clearer cash and operating decisions, visit AmbitionCFO to discuss a working session using your existing financial data.