

You're three months into the year. Revenue looks fine on the profit and loss statement, but payroll feels tight, a supplier wants faster payment, and you're not sure whether to hire the next project manager or wait. Someone on your team says, "We're under budget," while someone else says, "The forecast changed." Those two statements can both be true, and they don't mean the same thing.
That's the practical problem behind the difference between budgeting and forecasting. One tool sets what you intended to fund and achieve. The other tells you where you're now headed. When you blur them, you lose accountability and you miss your chance to change course early.
Table of Contents
- What a Budget and a Forecast Each Do
- Budget vs Forecast Side by Side
- How Budget and Forecast Variances Work in Practice
- How to Build a 13-Week Cash Forecast
- Which Tool to Use in Each Situation
- Mistakes That Blur Budgets and Forecasts
- Set Up Both Tools This Quarter
What a Budget and a Forecast Each Do
Think of a road trip. Before you leave, you pick the route, decide where you'll stop, and set aside fuel money. That's your budget. Once you're driving, traffic builds, weather shifts, and your phone updates your arrival time. That's your forecast. You don't throw away the original plan because traffic changed. You use the new estimate to decide whether to reroute, stop sooner, or keep going.

What a Budget Is
A budget is a forward-looking financial plan that turns strategy into specific targets for a defined period, usually a fiscal year. A fiscal year is the 12-month period your business uses for financial reporting. It may match the calendar year, or it may start in another month.
Your budget sets expected revenue, staffing levels, operating costs, capital spending, and how resources will be shared across departments. Capital spending means money spent on long-lived items such as equipment or vehicles. Because leaders approve those numbers in advance, the budget becomes a commitment. You use it to coordinate departments, authorize spending, and measure performance against plan.
If you're building that plan from scratch, start with how to create a business budget and lock the approved version before the year begins.
What a Forecast Is
A forecast is an updated estimate of what is most likely to happen. It uses actual results so far, current operating conditions, historical patterns, and known changes such as a lost customer, a wage increase, or a delayed job. It isn't a wish and it isn't a target. It's your best current view.
Two terms help here. A variance is the gap between two numbers, such as actual results minus budgeted results. A driver is an operating factor that moves a financial result, such as backlog, utilization, labor hours, price, or collections. Forecasts change when drivers change.
Commitment versus expectation: The budget answers, "What do we intend to achieve and fund?" The forecast answers, "Given what we now know, where are we headed?"
Confusion is common. In Deloitte's planning research, 62% of respondents believed their organizations shared a common understanding of why they plan, budget, and forecast, down from 70% in its 2014 results. Budgets communicate and cascade short-term targets, while forecasts show the likely outcome on the current trajectory and help you make course corrections.
Keep both roles clear. Don't replace the budget every time conditions shift. Let the forecast show whether hiring, pricing, purchasing, project acceptance, or cash decisions need to change.
Budget vs Forecast Side by Side
A budget and a forecast answer different questions, so they need different controls. The table below sets the two roles next to each other.
| Criterion | Budget | Forecast |
|---|---|---|
| Core question | What do we intend to achieve and fund? | Where are we actually headed? |
| Main purpose | Commitments, resource allocation and accountability | Updated estimate for decisions and course corrections |
| When it is built | Once a year, before the fiscal year starts | Monthly, quarterly, or on a rolling basis |
| How often it changes | Rarely; kept as a benchmark | Whenever actuals or key drivers change |
| Typical horizon | Fiscal year (12 months) | Next 13 weeks, or a rolling 12 to 24 months |
| Main output | Revenue targets, headcount, spending limits, capital budget | Revised revenue, margin and cash outlook |
| How results are judged | Actual vs budget, measuring execution | Actual vs latest forecast, measuring accuracy and outlook |
| Usually owned by | Leadership with department heads | Finance working with operating leaders |
Use the table by asking which job you need done. The budget stays fixed so you can judge execution. The forecast moves so you can decide with current information. If you keep moving the budget, you lose your benchmark. If you never update the forecast, you steer with old assumptions.
Treat both as governance tools. A governance tool sets who decides what, and when. The budget governs commitments: payroll, purchases, capital, and the sales targets those commitments depend on. The forecast governs attention: it shows which commitments now need a second look.
That distinction gives you a clear rule for forecast changes. A forecast change should force a management decision when it crosses a threshold you set in advance. A cash forecast that drops below your minimum operating cash is a decision trigger. So is a backlog forecast that no longer supports the hours you have scheduled, or a margin forecast that falls below the level your pricing assumed. If the change stays inside those thresholds, the forecast explains a variance and no meeting is needed. If it crosses one, the forecast becomes an agenda item, and you decide whether to change the commitment, change the assumption, or accept the variance and monitor it. The threshold is what separates a variance note from a decision item.
Timing and Speed
Budgets take time because departments must agree on staffing, spending, and targets. The Association for Financial Professionals reported that the average time required to create a corporate budget was 8.7 weeks in 2025, compared with 8.5 weeks in 2022. That slow, stable cycle fits an annual commitment. It does not fit a midyear decision about a crew, a large order, or a price change.
Forecasts need to be faster. Many organizations still struggle to produce an out-of-cycle forecast, meaning one outside the normal monthly or quarterly cycle, even when conditions have clearly changed. For a construction or distribution business, a slow refresh can leave you reacting to a cash gap after it has already formed. Build a forecast you can refresh right after each monthly close, and a cash forecast you can update weekly.
Who Needs to Be in the Room
Forecast accuracy improves when operating leaders help build it. Finance cannot forecast backlog, utilization, or supplier lead times alone. Sales, operations, and project leaders own those drivers. When those leaders review the forecast together, they catch changes earlier and agree on which threshold has been crossed.
For owners who want a wider view of how these tools fit together, financial planning for growing businesses offers useful context on using both rather than choosing one.
If the question is about commitments and accountability, start with the budget. If the question is about what will happen next, start with the forecast.
That test settles most arguments. Approving headcount for next year is a budget question. Deciding whether to hire next month, given current backlog and collections, is a forecast question. You need both answers, but you should not ask one tool to do the other's job.
How Budget and Forecast Variances Work in Practice
Numbers make the distinction easier to see. Say a distributor budgets $12.0M in annual sales and authorizes $2.0M for inventory funding. Inventory funding is the cash tied up in stock waiting to be sold. At midyear, demand softens and supplier lead times lengthen, so the latest forecast shows $10.8M in sales and $2.3M of inventory funding.
That midyear comparison is forecast versus budget. It measures a change in expectation, not a final result. Sales are expected to fall $1.2M short, while inventory needs $300,000 more cash than planned. If you replaced the budget with the forecast, that gap would disappear from view. Keep the original budget visible so you can see what changed and decide whether to cut purchase orders, push collections, or revise sales efforts.
The Two Variance Rules
- Budget variance: Actual minus budget. It shows execution against the original plan.
- Forecast variance: Actual compared with the latest forecast. It shows planning accuracy and whether the outlook has changed again.
Build your worksheet with separate columns for budget, actual, latest forecast, dollar variance, and percentage variance, a layout explained further in actual vs budgeted reporting. Actual versus budget applies only once actual results exist for a period. Before that, you're comparing expectation with plan.
A Contractor Example With Margin
Say a contractor budgets $24.0M of revenue at a 20% gross margin. Gross margin is revenue minus direct job costs, divided by revenue. At 20%, gross profit is $4.8M.
After three months, actual labor productivity, material prices, approved change orders, and remaining backlog point to $22.0M of revenue at 17%. That's $3.74M of gross profit. The total gross profit gap is $1.06M.
Split the gap so you know what to fix. The $2.0M volume shortfall at the original 20% margin explains about $400,000. The three-point margin drop on $22.0M explains about $660,000. Volume may reflect delayed jobs or lower demand. Margin may reflect labor overruns or weak pricing. Each cause calls for a different response.
| Line item | Budget | Latest forecast | Dollar variance | Percentage variance |
|---|---|---|---|---|
| Distributor annual sales | $12.0M | $10.8M | -$1.2M | -10.0% |
| Distributor inventory funding | $2.0M | $2.3M | +$0.3M | +15.0% |
| Contractor revenue | $24.0M | $22.0M | -$2.0M | -8.3% |
| Contractor gross margin | 20% | 17% | -3 points | -15.0% |
| Contractor gross profit | $4.80M | $3.74M | -$1.06M | -22.1% |
Ask one question for each gap. Is it an execution problem, where your team missed the plan, or an assumption problem, where conditions made the plan unrealistic? That answer tells you whether to correct operations or change the decisions ahead.
How to Build a 13-Week Cash Forecast
Profit and cash don't move at the same time. You can book revenue today, pay crews this Friday, and collect from the customer 45 days later. A profitable company can still miss payroll when collections lag payroll, supplier bills, debt payments, or equipment purchases. A 13-week cash forecast tracks timing week by week so you see a gap before it hits.
This visual sums up the build before you work through the steps.
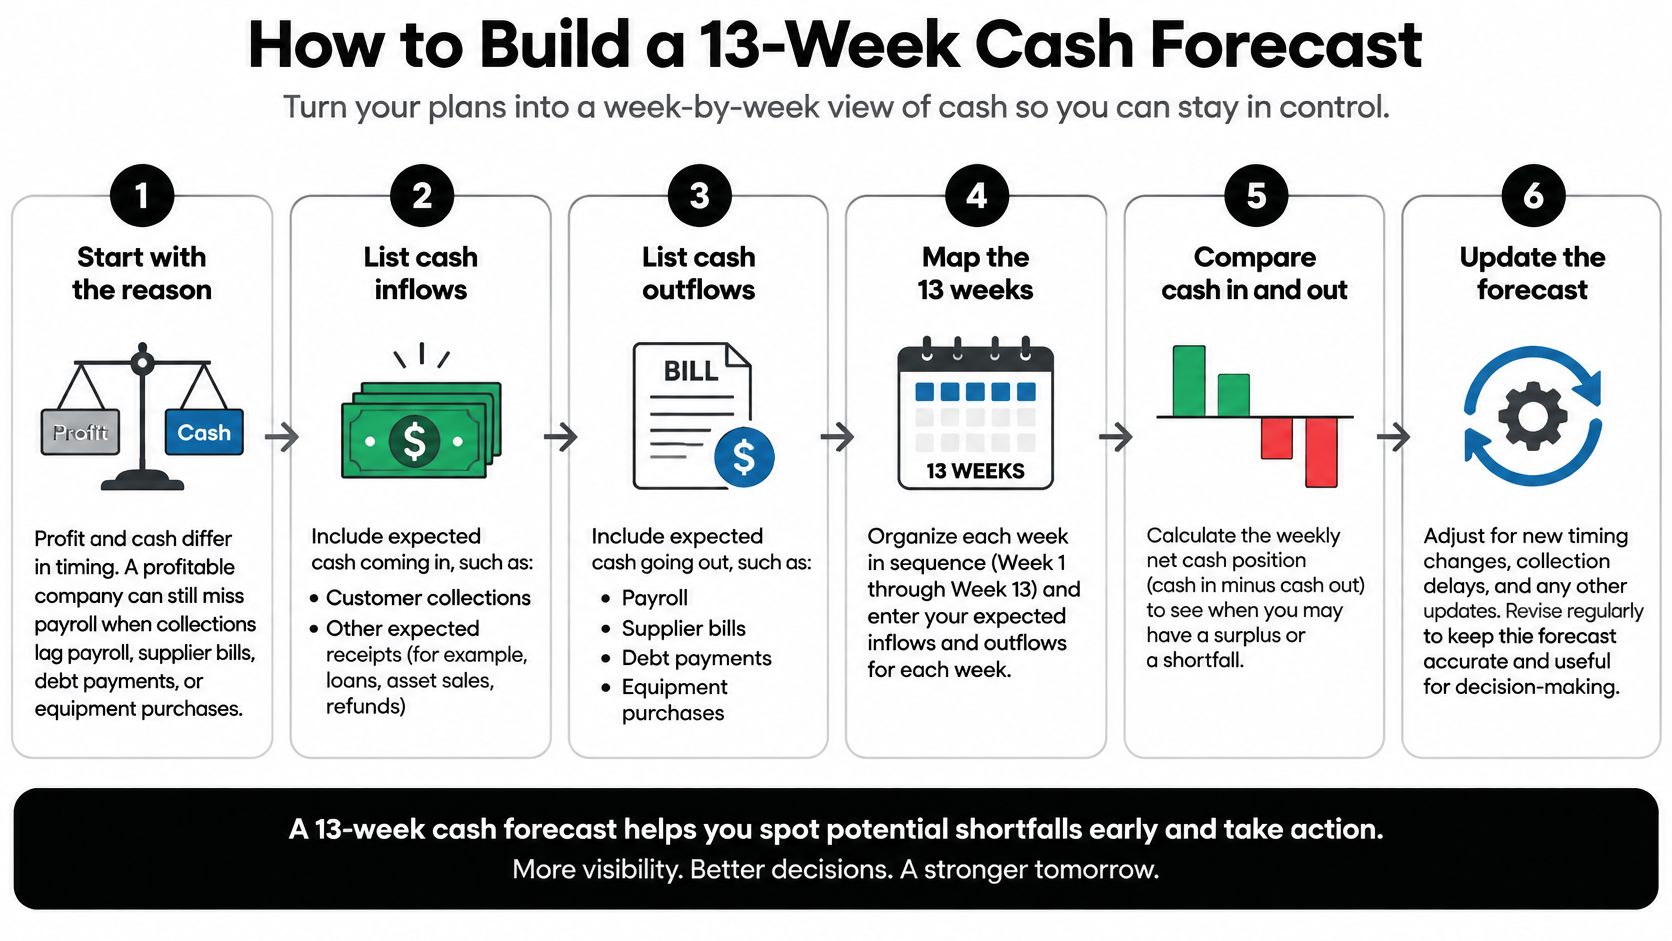
The Five Steps
- Record opening cash: Start each week with the cash balance you have. Every later calculation depends on this number being right.
- Forecast receipts by customer or invoice: Use expected payment dates, not invoice dates. For construction firms, account for retainage, the portion of payment the customer holds back until conditions are met.
- List cash payments by date: Include payroll and tax dates, supplier disbursements, debt service, and planned equipment purchases. Debt service means scheduled loan principal and interest payments.
- Calculate ending cash and compare it with your floor: Ending cash is opening cash plus receipts minus payments. Your minimum cash floor is the lowest balance you'll accept for safe operations, set in advance.
- Roll the model forward each week: Replace projections with actual receipts and payments, drop the finished week, and add a new week 13. The model stays current because it learns from what just happened.
Our detailed guide to a 13-week cash flow forecast walks through the worksheet layout if you want a template structure to copy.
A Worked Example
Say a company starts with $900,000, expects $500,000 of weekly receipts, and has $575,000 of weekly payments. Cash falls by $75,000 each week, so week 1 ends at $825,000 and week 2 should end at $750,000.
Now say a $400,000 customer payment slips from week 2 to week 3. Week 2 receipts drop to $100,000, the weekly decline becomes $475,000, and week 2 ends at $350,000 instead of $750,000. If your floor is $400,000, the model flags week 2 before cash gets there. Week 3 recovers when the payment lands, but you still need a plan for week 2. You can accelerate collections, negotiate supplier terms, defer discretionary spending, or arrange financing while you still have time.
This short video reinforces the weekly rhythm behind the model.
You know the model works when ending cash stays above your floor each week, or any gap shows up early enough for you to act.
Which Tool to Use in Each Situation
Use the budget to set commitments, the forecast to test decisions, and the cash forecast to protect liquidity. Liquidity means cash available to meet near-term obligations. That one rule covers most choices you'll face this year.
| Situation | Start with | Why |
|---|---|---|
| Setting next year's revenue and headcount targets | Budget | Creates the commitments the team is measured against |
| Deciding whether to add a crew or hire a project manager | Forecast with a capacity model | Shows margin and cash impact before resources are committed |
| Cash may run short within the next quarter | 13-week cash forecast | Shows the weekly cash position and gaps early |
| Buying or leasing equipment | Forecast, then cash forecast | Tests the margin effect and the cash outlay |
| Taking on a larger project | Forecast | Shows revenue timing, labor needs and collections |
| Year-end performance review | Budget variance, then forecast variance | Separates execution results from planning accuracy |
The Three Layers That Work Together
Growing businesses run best with three layers, each with its own horizon. Your annual budget handles accountability and authorization. Your rolling 12-month operating forecast supports earnings and capacity decisions, meaning whether you have the people and equipment to do the work profitably. Your 13-week cash forecast protects weekly liquidity.
The financial forecasting models you choose should match those layers rather than force one spreadsheet to answer every question. A capacity decision needs staffing and utilization drivers. A liquidity decision needs payment dates. Mixing them into one view usually hides the detail that matters.
At each monthly close, calculate revenue, gross margin, operating expense, EBITDA, working capital, and cash variances against both the budget and the current forecast. EBITDA is earnings before interest, taxes, depreciation, and amortization. Working capital is current assets minus current liabilities, a measure of short-term operating cushion.
Execution or assumption: Actual labor cost above budget points to an execution problem. Updated wage rates that make the original budget obsolete point to an assumption problem.
Those problems need different responses. An execution problem may need tighter scheduling or supervision. An assumption problem may need a pricing change, hiring delay, purchasing renegotiation, or capital deferral. Name the problem correctly before you assign the fix, or you'll correct people for conditions they didn't create.
Mistakes That Blur Budgets and Forecasts
A budget and a forecast are two different governance tools. The budget is the approved plan: revenue, headcount, spending, capital, and margin targets that leadership signs off on. It sets accountability. The forecast is the current expectation of how those numbers will land. It tests whether the plan's assumptions still hold. A rolling forecast, one updated as new data arrives, does not replace the budget. Many businesses still run a static annual budget alongside a rolling forecast, and that pairing is healthy when each tool has a clear job.
Blurring them creates six common mistakes. Each one weakens a different control.
Six Mistakes to Fix
- Replacing the budget with the forecast: The warning sign is that plan versus expectation gaps disappear. If only the latest forecast is visible, no one can see whether the original commitments were met. Keep both columns so the variance stays visible.
- Forecasting from the profit and loss only: Revenue can look strong while collections, inventory purchases, or retainage drain cash. Add operating drivers and a cash view. Retainage is money withheld until a project meets contractual milestones.
- Reviewing the budget once a year: A budget that is never compared with actual results is a file, not a control. Review variances at every monthly close.
- Updating the forecast with no trigger: A forecast that explains variances but prompts no action is just a moving report. Tie each major driver to a predefined response.
- Treating forecast accuracy as the goal: Teams that are rewarded for hitting a forecast can sandbag the numbers to look accurate. Judge the decision the forecast supported, not only the size of the miss.
- Building a cash forecast with no floor: Without a minimum cash floor, no warning is ever raised. Set the floor in advance and flag any week that falls below it.
The question worth asking is direct. When should a forecast trigger a decision rather than merely explain a variance? The rule is to set the threshold before you need it, on the drivers that change commitments.
Set the threshold before you need it. If backlog falls below an agreed level for two consecutive months, hiring pauses for review.
Other triggers work the same way. If the gross margin forecast falls below your threshold, a pricing review starts. If the cash forecast falls below your floor, an equipment purchase is delayed or a supplier renegotiation begins. The trigger should name the action, the owner, and the date.
A forecast is a governance tool for deciding what to do next. The budget governs commitments. The forecast governs response. When a driver crosses a line, the response should already be written.
Set Up Both Tools This Quarter
Treat the budget and the forecast as two governance tools with different triggers. The budget changes only when leadership approves a revision. The forecast changes whenever new data arrives, but it forces a management decision only when a driver crosses a threshold set in advance.
You don't need a complex system to start. You need a locked budget, a weekly cash view, a monthly variance worksheet, and three triggers with named owners.
Four Setup Steps
- Write and lock the annual budget: Set revenue, headcount, operating cost, capital spending, and gross margin targets. Once leadership approves it, keep that version as your benchmark. A later change requires a new approved version, not a silent edit.
- Build the 13-week cash forecast: Start from current receivables, payables, payroll dates, and tax dates. Set your minimum cash floor in advance, meaning the lowest cash balance you can operate with safely. The 13-week rolling forecast can show a cash crunch 8 weeks before it hits.
- Create the monthly variance worksheet: Use budget, actual, latest forecast, dollar variance, and percentage variance. Follow financial modeling best practices so assumptions sit in one place and formulas stay consistent.
- Set three decision triggers: Pick backlog, gross margin, and your cash floor, or the drivers that matter most in your business. Each trigger needs a named response, an owner, and a date. If a forecast change stays inside the threshold, record it in the worksheet. If it crosses, the owner acts.
For project work, the same separation applies to the approved project budget and the updated cost forecast. A contractor planning a build-out can avoid restaurant build-out budget overruns by keeping those two views apart as bids and change orders arrive.
AmbitionCFO works as a fractional CFO alongside your bookkeeper and CPA. The advisory sits above both and does not reconcile accounts or file taxes. It builds forecasts, budgets, and KPI reporting for construction, distribution, and professional-services businesses with $10M to $100M in revenue. KPI means key performance indicator, a small set of numbers you track to judge business health.
The first 30 days of an engagement are diagnostic, identifying the biggest financial leaks and opportunities. By day 60, initial fixes are implemented, and by day 90, a fully operational forecasting system and executive dashboard are in place.
If your budget says one thing and your cash balance says another, AmbitionCFO can help you build a locked annual budget, a rolling operating forecast, and a 13-week cash forecast with clear decision triggers. That structure shows you whether to hire, buy equipment, or take the next project before you commit resources. Visit us to start the conversation before your next major decision forces the answer.