

You're staring at three competing project bids, a bank line that may not renew, and a hiring decision that could either fuel growth or create a cash squeeze. The question isn't, “Which financial forecasting model is most advanced?” It's, “Can we make this decision without putting the company's cash, covenants, or exit value at risk?”
That distinction matters. A forecast is useful only when it changes what the owner does next. The right model shows whether you can add a crew, purchase equipment, fund inventory, renew a credit facility, or prepare the business for a sale. The wrong model produces polished spreadsheets that nobody trusts.
Financial forecasting has matured far beyond simple trend extrapolation. Its roots run through early economic forecasting, the Cowles Commission's formalization of structural estimation and forecasting in the 1940s, the broad adoption of ARIMA and exponential smoothing in the 1960s and 1970s, and advances such as vector autoregression, cointegration, state-space modeling, and ARCH modeling in the 1980s. (Oxford Reference overview of forecasting history) The methods are mature. SMB implementation is where most forecasts break.
Table of Contents
- Why Most Forecasting Models Fail the Owner Who Needs Them Most
- The Four Models Worth Knowing and What Each One Is Built to Do
- Matching the Right Model to the Decision You Actually Face
- How Construction, Distribution, and Services Use the Same Model Differently
- Inputs, Outputs, and a Realistic Build Sequence
- The Four Mistakes That Quietly Kill Forecast Accuracy
- Choosing Your Model and Your Next 90 Days
Why Most Forecasting Models Fail the Owner Who Needs Them Most
A founder-led contractor I worked with once had a familiar problem. Three large bids sat on the desk, each with a plausible margin, while the company's bank line approached renewal. The owner wanted to know whether taking the work would create enough contribution to justify another superintendent and equipment purchase, or whether the projects would consume cash before customer payments arrived.
The existing forecast couldn't answer. It was an annual spreadsheet built from prior-year totals, updated once, and then filed away. The owner went back to gut feel, which wasn't an intelligence problem. It was a model-design problem.
The enterprise template trap
Templates designed for large finance departments often overwhelm a smaller operator. They contain too many tabs, use reporting periods that don't match the business's decision cycle, and separate financial results from the operational drivers that create them.
A $15M operator doesn't need a miniature version of a $50M enterprise planning system. The owner needs a model that connects:
- Revenue to operating activity, such as jobs, units, utilization, or billable hours.
- Costs to controllable inputs, such as labor, materials, vendor terms, and headcount.
- Profit to cash, including collection timing, inventory purchases, debt service, and capital spending.
- Forecasts to actuals, so assumptions improve rather than drift.
When the forecast appears only once a year, last month's actuals never get compared back, and the owner can't see which assumptions changed, the spreadsheet loses authority. People stop using it because it doesn't help them decide.
Practical rule: If the forecast doesn't change a hiring, pricing, purchasing, borrowing, or investment decision, it's a reporting exercise, not a management tool.
Reverse-engineer the model from the decision
Start with the decision, then select the model. Hiring a salesperson requires a view of ramp time, quota, compensation, pipeline, and cash impact. Buying an excavator requires utilization, financing, maintenance, revenue lift, and downside demand. Planning an exit requires durable margins, cash conversion, debt capacity, and operational dependency on the owner.
That reversal is the central discipline. A forecasting accuracy framework can improve the review process, but accuracy alone won't rescue a model built around the wrong question.
The Four Models Worth Knowing and What Each One Is Built to Do
You don't need every forecasting method discussed in finance textbooks. Four practical models cover most decisions in founder-led construction, distribution, and professional services businesses.
Driver-based forecasting
A driver-based model links financial outcomes to operating inputs. Revenue might come from units sold, average price, billable hours, utilization, or project progress. Costs might depend on headcount, production volume, subcontractor commitments, or vendor pricing.
Its job is to answer, “What changes financially if this operating assumption changes?” The operating owner should help define the drivers because a bookkeeper may know what was recorded without knowing what will create next month's revenue.
Rolling forecasting
A rolling forecast continuously updates a fixed forward horizon. A common structure covers 12 to 18 months, adding a new period and removing the oldest period as each month or quarter closes. (IBM's definition of rolling forecasts) It's designed to prevent the annual budget from becoming stale.
Its reader is usually the owner, leadership team, lender, or board. Its job is to answer, “What does the next operating cycle look like if current conditions continue?”
Scenario planning
A scenario model tests different versions of the future against one decision. Build a base case, an upside case, and a downside case, then change the assumptions that matter. For a new crew, those may include start date, utilization, pricing, backlog conversion, and payroll.
Scenario planning is not permission to create arbitrary optimism. Each scenario should have a trigger and an action. If backlog falls below an agreed level, hiring pauses. If utilization reaches the required threshold, the equipment purchase proceeds.
13-week cash flow forecasting
A 13-week cash flow forecast tracks weekly cash inflows and outflows over a short horizon. It focuses on actual cash movement rather than accrual accounting and helps identify liquidity shortfalls before they happen. (13-week cash flow explanation)
This is the model a bank, owner, or turnaround adviser reads when payroll, supplier payments, or covenant pressure is immediate. It answers, “Will we have enough cash each week to meet our obligations?”
| Model | Job to Be Done | Horizon | Primary Reader |
|---|---|---|---|
| Driver-based | Connect operating decisions to revenue, cost, profit, and cash | Monthly, extending forward | Owner and operating leaders |
| Rolling forecast | Keep the broader plan current as actual results arrive | 12 to 18 months | Owner, leadership, lender, or board |
| Scenario planning | Test a specific decision under different assumptions | Decision-dependent | Owner and decision team |
| 13-week cash flow | Protect near-term liquidity and working capital | Weekly, 13 weeks | Owner, CFO, lender, or treasury lead |
Use the difference between a projection and a forecast to keep the language clear. A projection often describes what could happen under stated assumptions. A forecast should represent what the business currently expects, based on updated information.
Matching the Right Model to the Decision You Actually Face
Model selection becomes easier when you judge each option by decision speed, data requirements, and failure risk, rather than by theoretical sophistication.
| Model | Decision speed | Data requirements | Common SMB failure |
|---|---|---|---|
| 13-week cash flow | Fast | Moderate | It shows liquidity pressure but not long-term capital economics |
| Driver-based model | Moderate | Moderate to high | The model breaks when the driver map is wrong |
| Rolling forecast | Moderate | Moderate | The process becomes stale if actuals aren't loaded consistently |
| Integrated three-statement model | Slower to build | High | It becomes a reporting artifact when operating assumptions are weak |
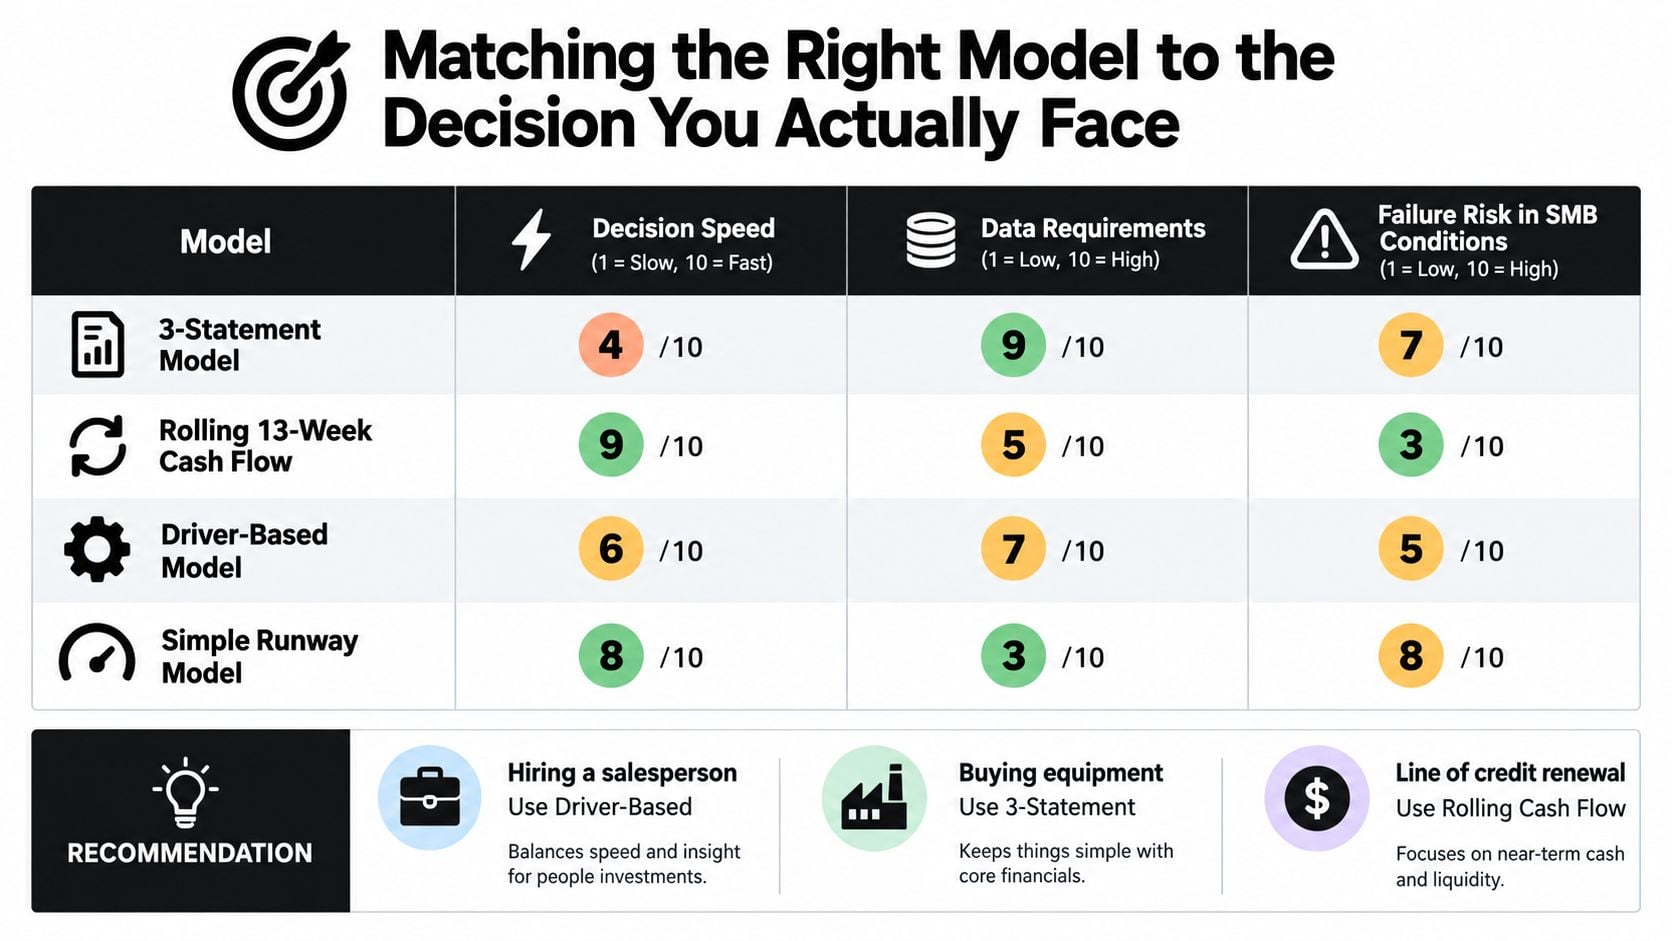
A distribution owner deciding whether to hire a salesperson should use a driver-based model with a sensitivity layer. Model the salesperson's start date, ramp time, compensation, expected sales activity, gross margin, and collection timing. The sensitivity layer shows how the decision changes if the ramp is slower or the margin is weaker.
An owner considering a $400K excavator needs scenario planning around utilization and revenue lift, connected to an integrated financial model. The question isn't whether the equipment creates accounting depreciation. It's whether the company can fund the purchase, keep utilization high enough, and preserve covenant headroom if work arrives later than expected.
A company facing tight banking covenants or seasonal payroll gaps should start with 13-week cash flow. It's quick to build and immediately useful for payment timing, but it's a poor capital allocation tool. It won't tell you whether a multiyear equipment decision creates durable value.
Annual board reporting and investor updates call for a rolling forecast. It provides a consistent forward view, while scenario planning adds decision-specific stress tests. For a deeper distinction between changing one assumption and modeling a coherent future, use this guide to sensitivity analysis and scenario analysis.
Decision rule: If the decision affects cash in the next few weeks, use 13-week cash flow. If it changes operating capacity, use driver-based forecasting. If it commits capital or debt, add scenarios and an integrated financial view. If it affects leadership reporting, maintain a rolling forecast.
How Construction, Distribution, and Services Use the Same Model Differently
The model skeleton can stay consistent across industries. The drivers cannot.
Consider three founder-led businesses with different operating mechanics. The construction general contractor uses backlog burn-down, percent-complete billings, and committed subcontracts. The distributor relies on inventory turns, vendor payment terms, and gross margin by product line. The professional services firm models billable utilization, new-hire ramp time, and pipeline coverage.
Construction
The contractor's most important cash signal is the gap between work performed, billings, collections, and retainage. A project can show accounting revenue while cash remains trapped in receivables. The monthly model tracks backlog conversion, percent complete, billing schedules, subcontractor commitments, and expected collections.
The owner changed the decision rule for taking new work. A project with attractive gross margin no longer automatically gets accepted if its billing profile creates a cash crunch before retainage releases.
Distribution
The distributor's model follows product demand through inventory purchases and customer collections. Inventory turns, vendor payment terms, purchase timing, and gross margin by SKU expose products that look profitable in the P&L but absorb cash.
The owner now reviews purchasing and pricing together. A low-margin product line with slow movement can trigger a price change, tighter buying discipline, or a deliberate exit from the range.
Professional services
The services firm drives revenue from billable utilization, ramp time for new hires, rate realization, and pipeline coverage. The forecast showed that hiring two senior consultants ahead of a pipeline dip would breach the line rather than boost EBITDA. The owner delayed the hires and tied future recruitment to signed work and utilization thresholds.
| Industry | Top 3 Drivers | Primary Cash Signal | Decision the Model Changes |
|---|---|---|---|
| Construction | Backlog burn-down, percent-complete billings, committed subcontracts | Collection timing versus job commitments | Which projects to accept and when to staff |
| Distribution | Inventory turns, vendor terms, gross margin by product line | Cash tied up in inventory and receivables | What to buy, reprice, or discontinue |
| Professional services | Utilization, hiring ramp, pipeline coverage | Payroll ahead of collected revenue | When to hire and which work to pursue |
The lesson is simple. Industry dictates the drivers, not the structure. Each business can use linked P&L, balance sheet, cash flow, and scenario logic, but each owner should monitor the operational KPI that moves cash.
Inputs, Outputs, and a Realistic Build Sequence
A finance-light team doesn't need perfect data to start. It needs consistent data, clear ownership, and an honest record of what the numbers mean.
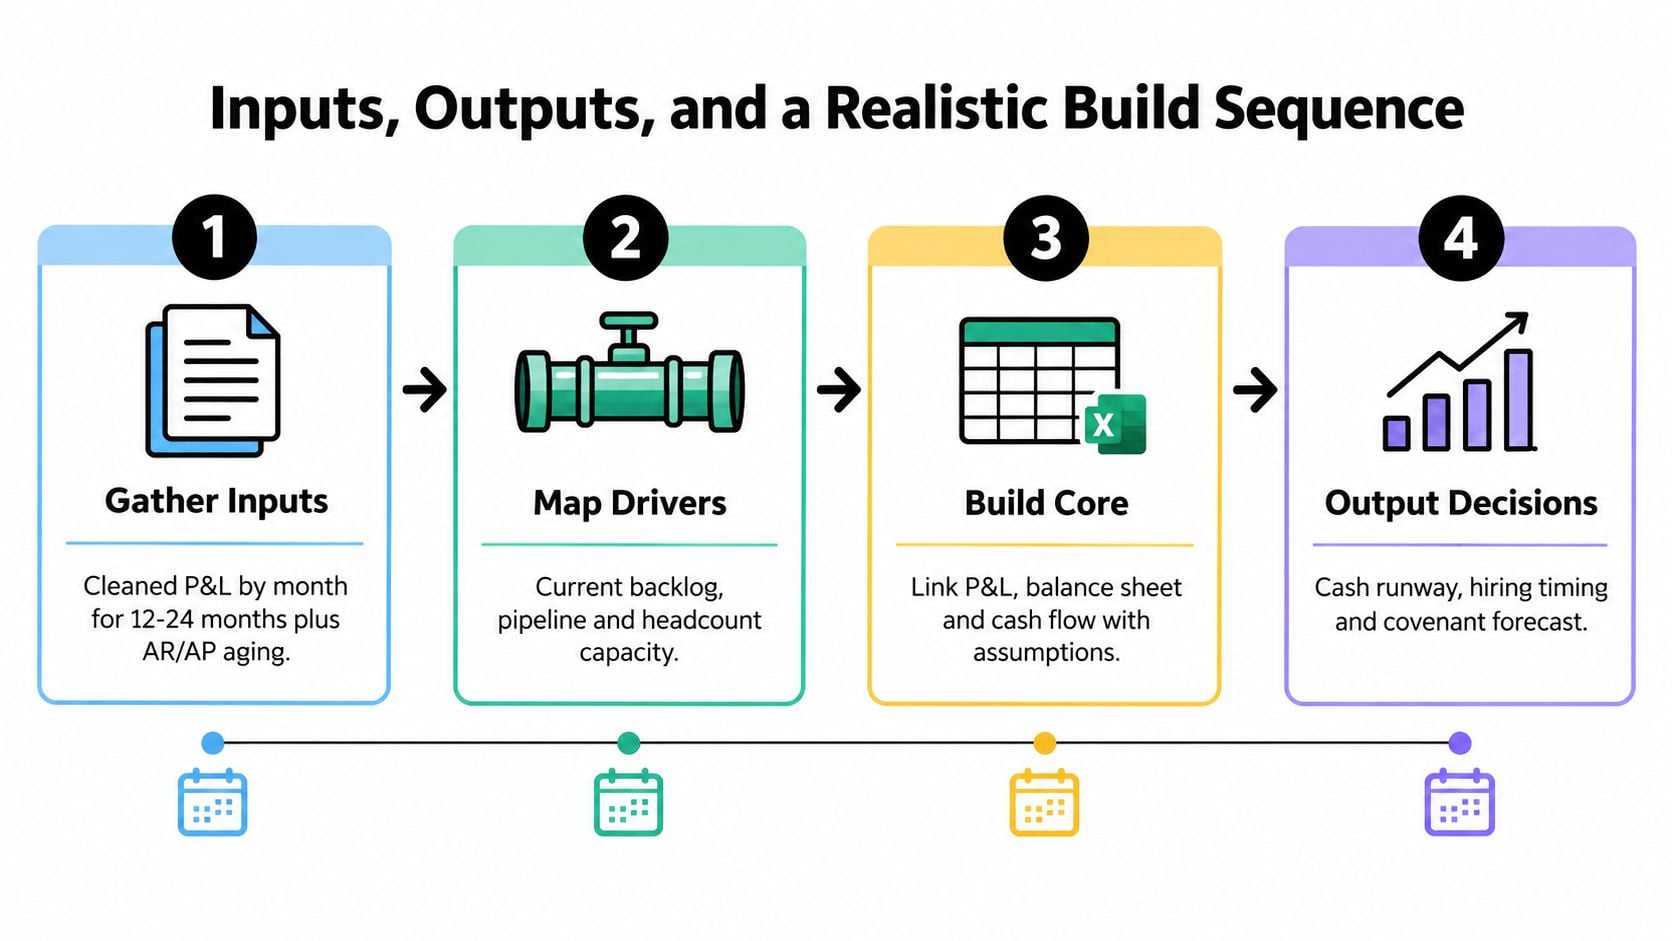
Gather these inputs first:
- Historical P&L: Cleaned monthly results for the prior 12 to 24 months.
- Working capital: Accounts receivable and accounts payable aging, plus collection and payment patterns.
- Forward activity: Current backlog, pipeline, open orders, or contracted work.
- Capacity: Headcount plan, hiring timing, utilization, and production constraints.
- Capital structure: Debt schedule, interest, principal payments, and covenant requirements.
- Operating drivers: Three to five measurable inputs tied directly to revenue or major costs.
The output should include a monthly P&L, cash flow waterfall, runway view, covenant headroom, and variance report. For variance analysis, calculate dollar variance as Actuals minus Budget, then calculate variance percentage as (Actuals / Budget) – 1. (Variance mechanics and rolling forecast practices)
A four-week build sequence
Week 1 focuses on historicals. Pull the data, reconcile it to the general ledger, and fix chart-of-accounts inconsistencies. If labor, subcontractors, and overhead move between accounts each month, the model will create false trends.
Week 2 maps the drivers. Sit with the operating owner, sales lead, project manager, or service-line leader. Define how each driver creates revenue, cost, working capital, or capacity. Don't let the bookkeeper build this alone.
Week 3 builds the core. Link the P&L, balance sheet, and cash flow. Add a base case, upside case, and downside case using the same logic layer. Driver-based forecasting works because it turns the forecast into a living model that updates when operating inputs change. (Driver-based forecasting implementation guidance)
Week 4 tests the model. Backtest it against prior months, explain major variances, train the people who will update it, and lock the monthly close cadence. The first version won't be elegant. It needs to be traceable and useful.
For broader research on financial filings, earnings releases, and market context, a hedge fund intelligence hub can supplement internal operating data. It won't replace clean company-level inputs, but it can help leadership frame external assumptions.
A structured financial modeling build process prevents the spreadsheet from becoming a collection of disconnected formulas. The hard work is not typing formulas. It's agreeing on definitions, owners, timing, and decision thresholds.
The Four Mistakes That Quietly Kill Forecast Accuracy
Most forecast failures come from ordinary design errors, not advanced statistical problems.
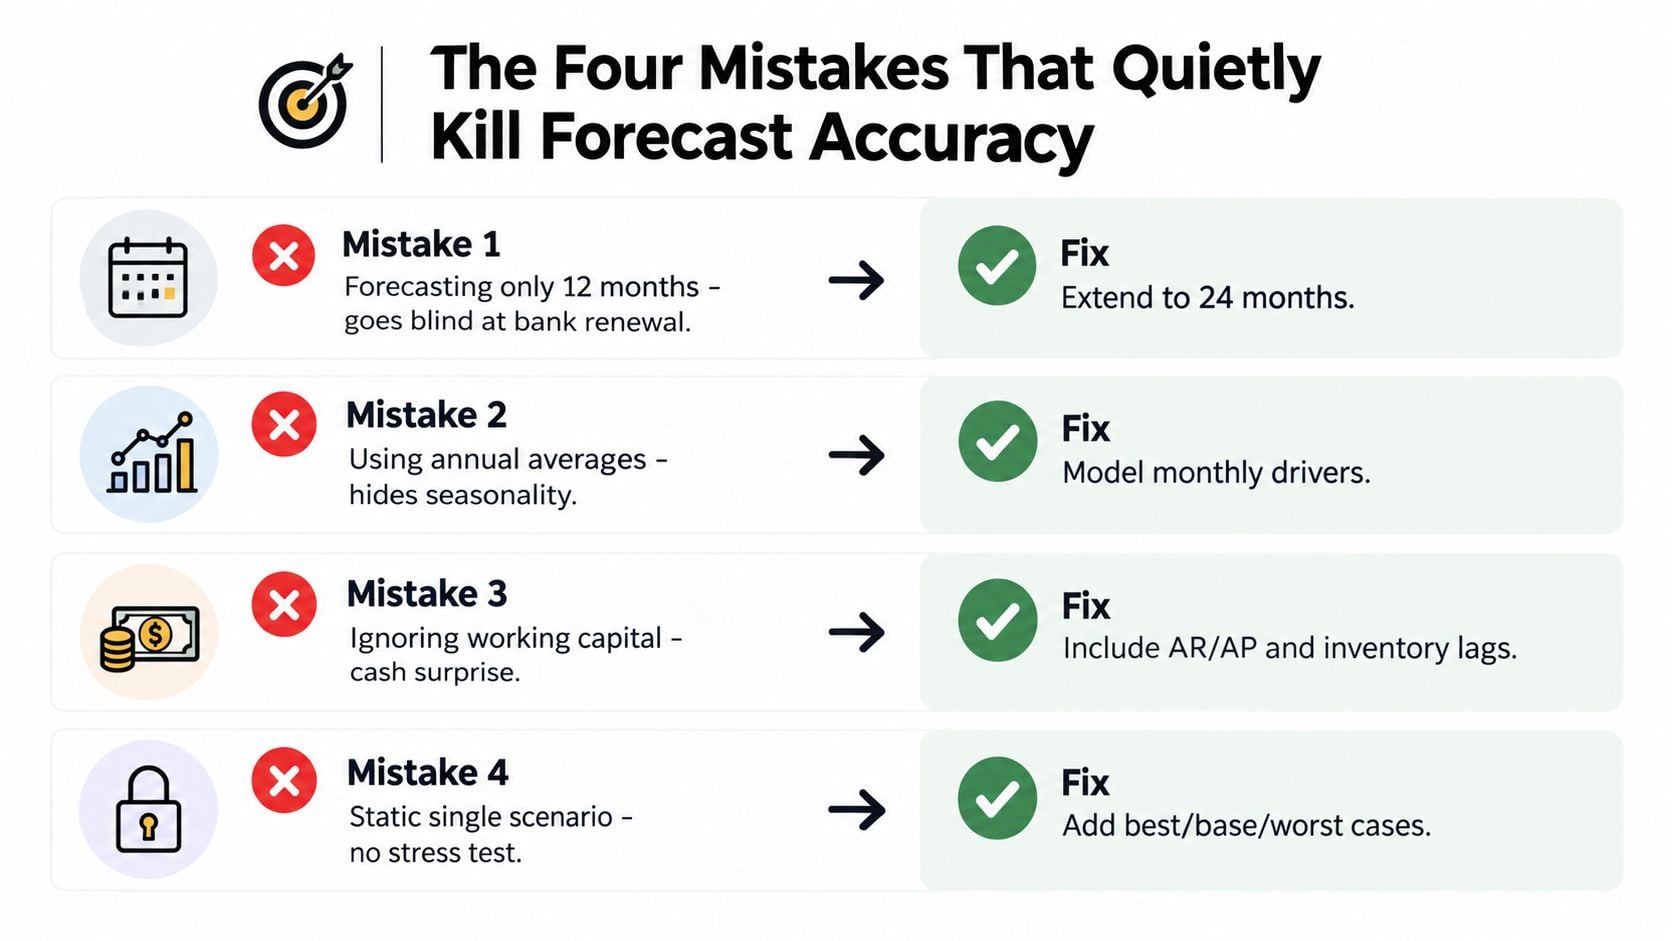
Mistake one is stopping the view too early
A model that looks only 12 months ahead can go blind when bank renewals, tax planning, or major capital commitments sit beyond the visible horizon. Extend the forecast to 24 months and stress-test the back half. The objective is not false precision. It's early visibility into structural pressure.
Mistake two is trusting accrual P&L alone
A profitable month can still create a cash shortage when receivables collect late, inventory arrives early, or vendors tighten terms. Add a parallel cash view and reconcile it to the accrual P&L every month. Owners need both profitability and liquidity to make sound decisions.
Mistake three is skipping the variance loop
A forecast that never gets compared with actuals cannot learn. Set a 10% variance threshold to trigger an assumption review, then determine whether the difference came from timing, amount, volume, price, or an incorrect driver. The calculation itself is straightforward, but the management conversation is where value appears.
Mistake four is allowing drivers to drift
A services company may continue using an old utilization assumption even after staffing mix and project demand change. A distributor may retain an inventory assumption that no longer reflects vendor terms. Re-anchor each major driver every quarter with the operating owner, not just the finance person.
Rolling methods also need sensible history windows. A Kansas City Fed study found that a 10-year shrinkage forecast was as accurate as the top-ranked recursive forecast, with an RMSE ratio of 1.007, while a rolling forecast based on 40 observations had an RMSE ratio of 1.027. The study found that shorter arbitrary rolling windows became less accurate as the window shrank. (Kansas City Fed research on forecast windows)
The practical conclusion is not to worship one window length. Preserve enough history to retain signal, then refresh assumptions when the business changes.
Choosing Your Model and Your Next 90 Days
The right financial forecasting model depends on the decision in front of you. Hiring, equipment, exit timing, and credit renewal each require a different emphasis, even when they share the same underlying financial statements.
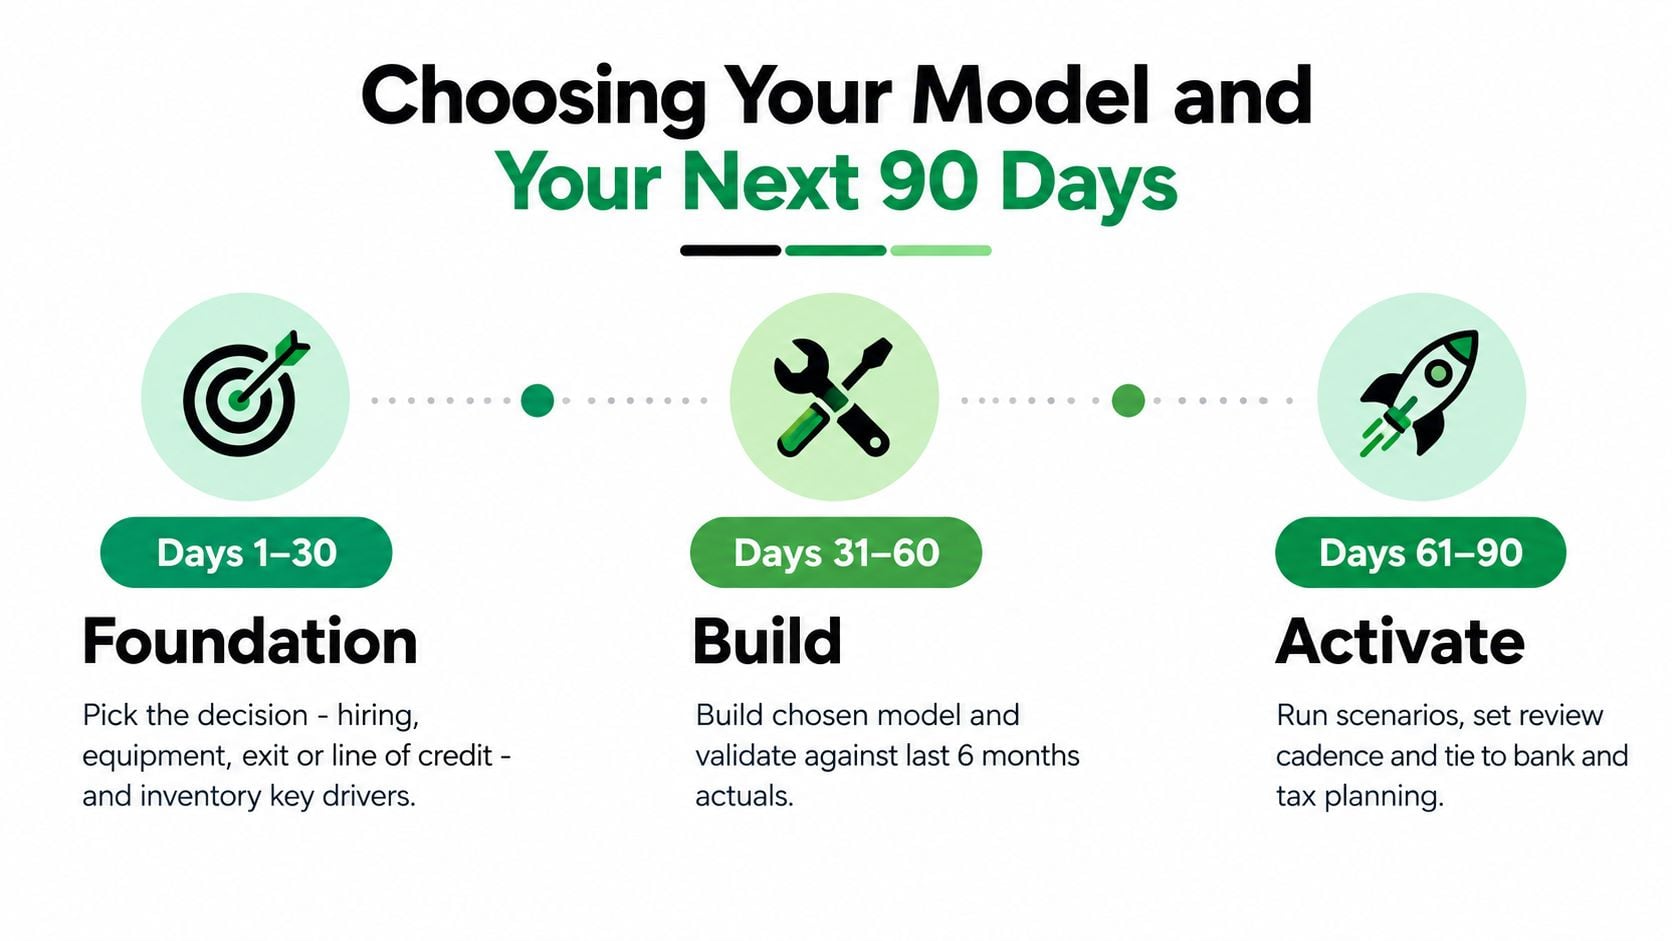
Days 1 to 30 establish the foundation
Pick one decision. Inventory the drivers that influence it, then pull 24 months of actuals where available. Clean the chart of accounts, identify working-capital timing, and document which numbers are reliable versus estimated.
Days 31 to 60 build the decision model
Build the chosen model in a structured template. Validate each driver against historical variance, then run base, upside, and downside scenarios. If liquidity is the immediate concern, start with a 13-week cash flow model. If the decision concerns capacity or capital, connect the operating drivers to a broader P&L, balance sheet, and cash view.
Days 61 to 90 activate the process
Set a weekly or monthly variance review based on decision speed. Assign ownership to a finance lead, establish the close-to-forecast handoff, and pressure-test the output with a fractional CFO or FP&A consultant. A forecast earns trust when leaders use it in operating meetings, not when it sits untouched in a shared folder.
A fractional CFO engagement should be explicit about scope. Expect a diagnostic of the decision and data, a prioritized driver map, a working forecast or cash model, scenario outputs, a variance-review cadence, and a handoff plan sized to the team. AmbitionCFO works with founder-led companies on cash flow management, profitability improvement, forecasting, KPI reporting, and exit planning. Book a 45-minute diagnostic to map your decision to the right model and leave with a practical build sequence.
AmbitionCFO helps founder-led construction, distribution, and professional services companies build operating forecasts, 13-week cash flow models, margin analyses, KPI dashboards, and exit-planning schedules. Visit AmbitionCFO to book a 45-minute diagnostic and turn the decision on your desk into a model your team can use.