

At 7:30 a.m., a founder opens two spreadsheets before approving a major equipment purchase. The 13-week cash forecast says payroll is covered through Friday. The 12-month projection warns that working capital gets tight later in the year. She doesn't have a math problem. She has a governance problem: which model should control the decision?
That question sits behind most projection vs forecast confusion. Lenders, bookkeepers, boards, and leadership teams ask for both because they answer different questions. One tells you whether the business can fund its immediate obligations. The other tests whether a strategic choice creates value under a defined set of assumptions.
The practical rule is simple. Use a forecast to control cash. Use a projection to approve capital and strategy. If you use the wrong model, you can either overreact to short-term noise or trust an attractive long-range story that the bank balance can't support.
Table of Contents
- Why Two Models Show Up on Every Owner's Desk
- What a Forecast and a Projection Actually Are
- Side-by-Side Criteria That Drive the Choice
- Real Decisions in Construction, Distribution, and Professional Services
- Building a 13-Week Cash Forecast and a Scenario Projection
- Plugging Forecasts and Projections Into Your FP&A Cadence
- When to Reach for Each Tool and Your First 90 Days
Why Two Models Show Up on Every Owner's Desk
The founder with the two open tabs needs to decide whether to approve a $140,000 equipment deposit. The cash forecast focuses on committed customer receipts, payroll, vendor payments, debt service, and the next few weeks of liquidity. The projection asks a different question: if the equipment increases capacity, changes labor needs, or improves margins, does the business become more valuable over the planning horizon?
Neither model is wrong. The danger comes from asking one model to do the other model's job.
A construction company may use a forecast to see whether customer draws arrive before subcontractor payments and retention obligations. Its projection can test whether taking on additional work requires new crews, equipment, or working capital. A distributor may need the forecast to time inventory purchases against collections, while the projection evaluates the profit impact of warehouse expansion or a supplier agreement. A professional services firm can use a forecast to protect payroll during a weak billing month, then use a projection to evaluate utilization, hiring, and partner compensation.
This is also why finance leadership and accounting aren't interchangeable. Accounting records what happened. FP&A helps management decide what happens next. The distinction becomes clearer in this explanation of FP&A versus accounting.
The governance test: Put the model in the meeting where its answer can change an action. Cash decisions belong to the forecast. Capital decisions belong to the projection.
A forecast that ignores a future capacity constraint can make a business look safe while it misses a growth opportunity. A projection that ignores near-term payment timing can approve a profitable investment that creates a liquidity crisis. Owners need both, but they need clear ownership, update rules, and decision rights for each one.
What a Forecast and a Projection Actually Are
A forecast is a near-term estimate of what management currently expects to happen, updated as actual results arrive. A projection is a scenario model built around hypothetical assumptions, designed to answer a “what if” question rather than describe the most likely path. SVA's finance guidance explains this distinction between expected outcomes and hypothetical scenarios.
Forecast methodology
Build the forecast around recent facts and committed activity. A useful operating forecast normally includes:
- A rolling weekly cadence: Refresh it as actual bank activity, collections, payables, and pipeline information change.
- Driver-based inputs: Use accounts receivable aging, committed customer milestones, payable due dates, payroll dates, debt service, and known taxes.
- Limited scenario logic: Keep the primary view focused on the most likely near-term outcome. Add risk flags rather than burying the operating answer inside multiple hypothetical branches.
- Variance accountability: Compare the forecast with actual results and assign an owner to every material miss.
The forecast is a control instrument. It should help the owner decide whether to delay a purchase, accelerate collections, change payment timing, draw on a line of credit, or protect a cash buffer.
Projection methodology
Build the projection around assumptions management wants to test. Revenue may depend on pipeline conversion, pricing, churn, utilization, contract timing, or expansion. Costs may depend on headcount, compensation, facility commitments, equipment, financing, and supplier terms.
A projection typically runs monthly or quarterly and includes branches such as Base, Downside, and Upside. It can support capital budgeting, market expansion, hiring plans, acquisition analysis, downturn stress tests, covenant planning, and exit preparation. Planful describes the projection as a scenario-driven model that extends beyond the immediate operating horizon.
The mistake many teams make is treating the projection as if it were a promise. It isn't. A projection shows what could happen if the assumptions hold. A forecast shows what management currently believes is most likely based on actual performance and near-term evidence.
The time horizon reinforces the difference. Professional guidance often describes forecasts as covering roughly 1 to 12 months, while projections are commonly used for 1 to 5+ years or beyond the next four quarters, as summarized by Abacum's comparison of forecasts and projections. Longer horizons require more assumptions, so the model should carry more scenarios and less false precision.
Side-by-Side Criteria That Drive the Choice
Owners don't need another definition. They need a decision filter that tells them which file to open before a meeting. Use the table below as the starting point.
Projection vs Forecast at a Glance
| Criterion | Forecast | Projection |
|---|---|---|
| Time horizon | Near term, often the next quarter or year | Longer term, often beyond the next four quarters |
| Update cadence | Regularly, often weekly or on a fixed operating schedule | When strategic assumptions change, with monthly or quarterly refreshes |
| Primary inputs | Bank activity, receivables, payables, committed payroll, debt, and known obligations | Revenue growth, margin, hiring, capital structure, pricing, capacity, and working capital assumptions |
| Accuracy tolerance | Judged against actual results and variance explanations | Judged by scenario logic and decision usefulness |
| Scenario depth | Limited, with emphasis on the most likely outcome | Multiple branches such as Base, Downside, and Upside |
| Decision type served | Payroll, vendor payments, cash buffers, collections, and borrowing | Capex, hiring, expansion, acquisitions, covenant planning, and exit timing |
| Owner involvement | Reviews actions and approves short-term interventions | Approves assumptions and selects the scenario used for planning |
NetSuite's overview also separates forecasting for the next quarter or year from projections that extend beyond the next four quarters. That distinction matters, but horizon alone doesn't settle the issue. A six-month model can still be a projection if it tests a hypothetical hiring plan. A 12-month model can still be a forecast if it updates from actuals and represents management's current best estimate.
Forecasts control cash. Projections create capital.
The differentiator most articles miss is accountability. Forecasts are judged against actuals. If receipts arrive late or payroll exceeds plan, someone explains the variance and changes the next operating action. Projections aren't judged because the business was supposed to hit every hypothetical branch. They're used to understand how changing an assumption affects a decision.
That distinction prevents two expensive errors. First, don't use an optimistic projection to authorize a purchase that the cash forecast can't fund. Second, don't let a temporary collection delay force you to cancel a long-term investment without testing its economics in a projection. For deeper model design, separate sensitivity analysis from scenario analysis using this guide to the difference between sensitivity analysis and scenario analysis.
Real Decisions in Construction, Distribution, and Professional Services
These industries aren't interchangeable, but the pattern is consistent. Cash conversion timing determines whether the forecast or projection owns the decision.
Construction
A general contractor is deciding whether to self-perform a $1.4M tilt-up or subcontract the work. The 12-month projection should test expected margin, equipment needs, headcount, supervision, insurance, and the effect on future capacity. The owner wants to know whether self-performance creates enough economic value to justify the added complexity and capital.
The 13-week forecast answers a narrower question. Will the next customer draws arrive in time to cover payroll, subcontractor obligations, materials, retention, and other payables? A project can produce an attractive projected margin and still create a cash squeeze because billing and payment timing don't line up. Construction owners can use this cash flow management resource for contractors to keep the near-term liquidity question separate from project economics.
Distribution
A wholesaler is weighing a 6% volume rebate against a 4% early-pay discount. The projection should calculate the annual EBITDA effect under expected purchasing volume, inventory turns, pricing, and customer demand. That model owns the commercial choice.
The forecast checks whether the additional inventory commitment can survive the next eight weeks of slow-season collections. If the rebate requires a large purchase before receivables convert, the business may need to negotiate terms, stage orders, or decline the rebate despite its projected benefit. The projection owns the annual economics. The forecast owns the liquidity exposure.
Professional services
A 22-person consultancy is considering a $600K senior hire. The projection should model utilization ramp, billable rate, compensation, recruiting costs, partner payouts, and the timing required for the hire to become productive. It should show Base, Downside, and Upside outcomes rather than one confident line.
The forecast answers whether payroll clears the May 15 covenant test and whether collections support the hiring decision before the revenue ramp appears. That immediate cash and covenant answer belongs to the forecast. The projection owns the strategic hiring case.
Decision Owner by Industry
| Industry | Decision Moment | Use the Forecast For | Use the Projection For |
|---|---|---|---|
| Construction | Self-perform or subcontract a major job | Draw timing, payroll, retention, and payables | Margin, equipment, headcount, and capacity |
| Distribution | Accept a supplier incentive | Inventory funding and collection timing | Annual EBITDA and purchasing economics |
| Professional services | Approve a senior hire | Payroll coverage and covenant timing | Utilization, ramp, pricing, and partner payouts |
The owner should leave each decision with two explicit answers: what happens to cash soon, and what happens to value over time. One model rarely answers both well.
Building a 13-Week Cash Forecast and a Scenario Projection
Build the cash forecast first. Strategic decisions are easier to evaluate when the owner knows the operating floor.
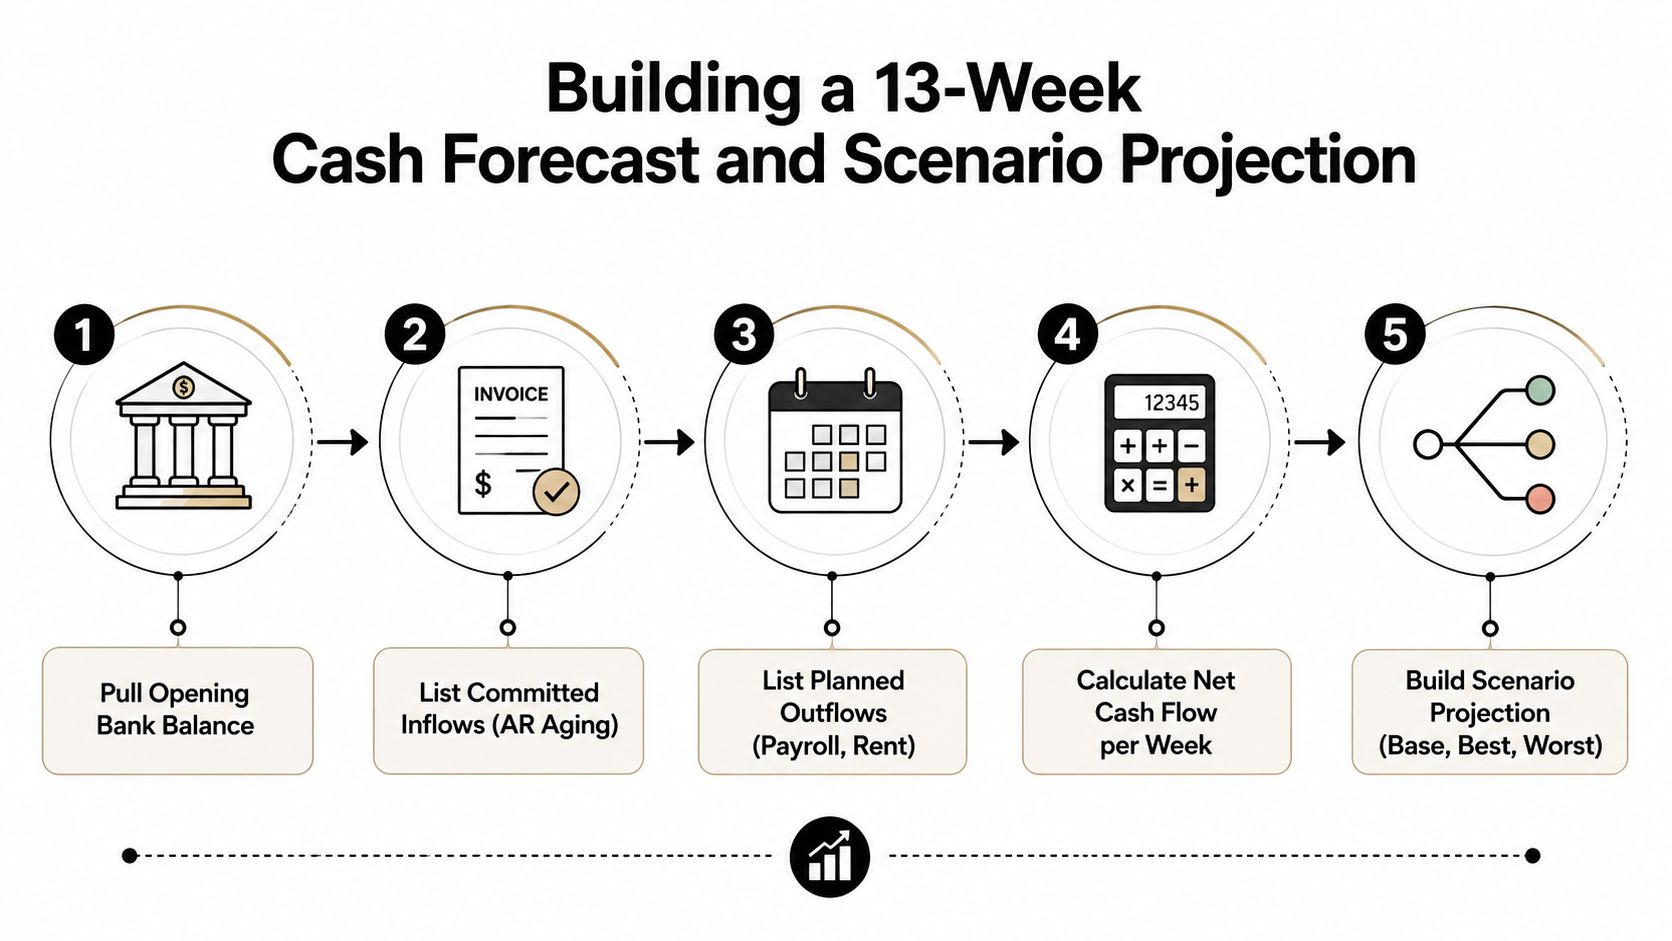
The 13-week forecast
Use a weekly grid and complete the following steps:
- Pull the opening bank balance. Start with actual available cash from the bank feed, not the balance carried in an old spreadsheet.
- List committed inflows by week. Include the accounts receivable aging, contracted milestones, deposits, and customer receipts with a realistic collection date.
- List outflows by week. Enter fixed payroll dates, accounts payable by due date, debt service, tax payments, rent, and other committed obligations.
- Calculate net cash flow. Add inflows, subtract outflows, and calculate the closing balance for every week.
- Flag the low point. Identify the week with the smallest closing balance and decide what action protects liquidity.
Use weekly actuals from the bank feed, refresh the AR aging on Mondays, pull the payroll register from the payroll system, and reconcile debt payments to the loan documents. Update the model every Friday and review it every Monday. The review should end with an action list, not a discussion about spreadsheet formatting.
Owners who need a more detailed operating framework can use this 13-week cash flow guide. For revenue-driven businesses, the SaaS and e-commerce forecasting guide adds useful context on connecting revenue drivers to a forward view.
The cash forecast can be monthly, weekly, or daily depending on operating needs. Near-term cash flow forecasting is commonly structured over 30, 60, 90, or 180 days, according to NetSuite's cash flow forecasting guidance. The specific window matters less than using a consistent operating rhythm.
The 12-month projection
Create three columns labeled Base, Downside, and Upside. Drive revenue from pipeline coverage and churn assumptions. Drive costs from the headcount plan and contract escalators. Flex working capital days in each scenario so the model shows how slower collections or higher inventory requirements affect cash.
Your monthly output should include:
- Profit and loss: Revenue, gross margin, operating expenses, and operating profit by month.
- Cash: Opening cash, operating movement, investing activity, financing activity, and ending cash.
- Covenant headroom: The remaining room under the relevant lender tests after each scenario's assumptions.
Rebuild the projection monthly after the close and re-flex it quarterly. Don't overwrite the prior version. Preserve the assumptions that supported each major capital, hiring, or financing decision so the leadership team can later compare the decision logic with the result.
Plugging Forecasts and Projections Into Your FP&A Cadence
Each model earns its place in a different meeting. If both appear in the same meeting without distinct outputs, the team will argue over which number is “right” instead of deciding what to do.
Weekly cash review
The Monday cash review uses the 13-week forecast. The owner reviews the low point, confirms collections actions, approves payment timing, and assigns responsibility for any financing or spending decision. The meeting should produce an actions list that keeps the closing balance above the company's minimum threshold.
Set a variance band that triggers a re-forecast. For example, the team might require an immediate refresh when actual receipts, payroll, or vendor payments move outside the agreed operating tolerance. The threshold should be documented in the model governance page, not left to personal judgment.
Monthly close review
The monthly close review reconciles actuals to the projection. Management updates the Base, Downside, and Upside columns using fresh pipeline, headcount, margin, and working-capital data. The purpose isn't to punish the projection for missing a hypothetical outcome. It is to determine which assumptions changed and whether the strategic decision still holds.
Businesses that have outgrown disconnected spreadsheets can evaluate moving off spreadsheets with Lucentive when they need a more controlled budgeting and planning workflow.
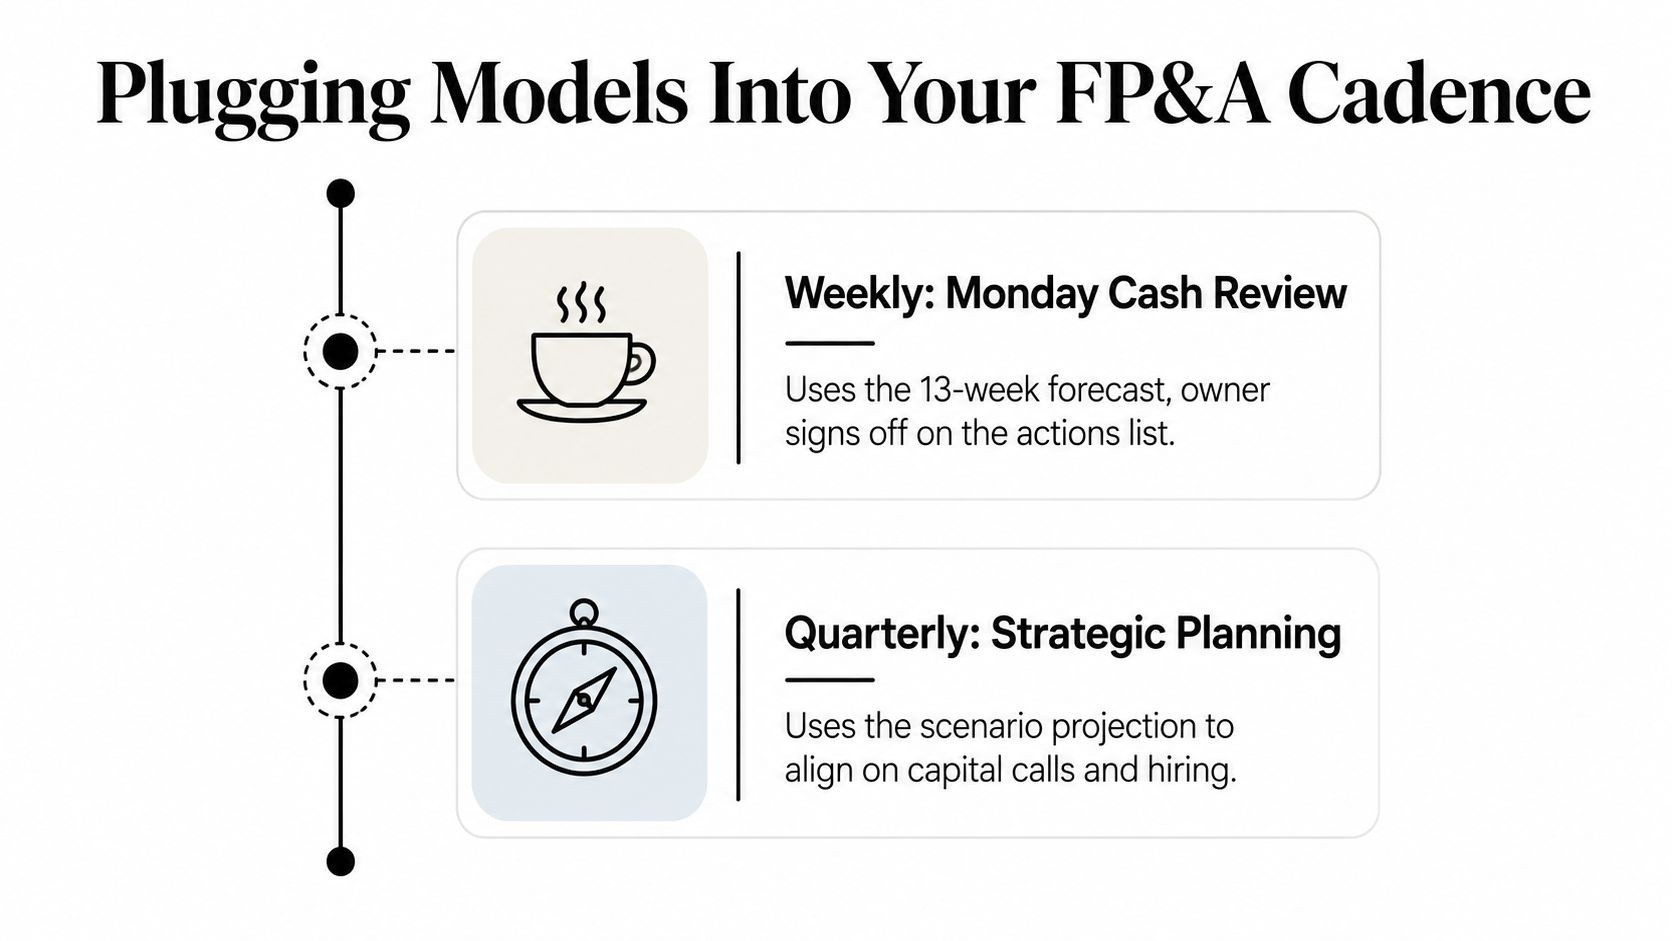
Quarterly leadership meeting
The quarterly leadership meeting uses the projection to decide capex, hiring, pricing, expansion, and financing actions. The owner should approve the scenario that becomes the basis for the bank covenant submission, with the assumptions and risks clearly documented.
Annual planning
The projection feeds the annual budget, exit valuation model, and owner compensation plan. It also provides a consistent narrative for lenders, board members, and advisors. Annual planning shouldn't replace the rolling forecast. It should establish the strategic assumptions that the forecast tracks as the next operating periods arrive.
One rule keeps the two models connected: the forecast's first 13 weeks must tie back to the projection's Base scenario within a stated tolerance. If they don't, the team needs to explain whether the difference comes from timing, changed assumptions, a data error, or a genuine change in the business.
When to Reach for Each Tool and Your First 90 Days
Reach for the forecast when the decision affects the next 1 to 13 weeks. That includes payroll, vendor payments, line-of-credit draws, collections, debt service, and the minimum cash buffer.
Reach for the projection when the decision affects the next 6 to 36 months. That includes capital calls, hiring plans, debt covenants, expansion, acquisition preparation, and exit valuation work. The rule is concrete: if a wrong number could cause an overdraft, forecast. If a wrong number could cause a bad capex or sale decision, project with scenarios.
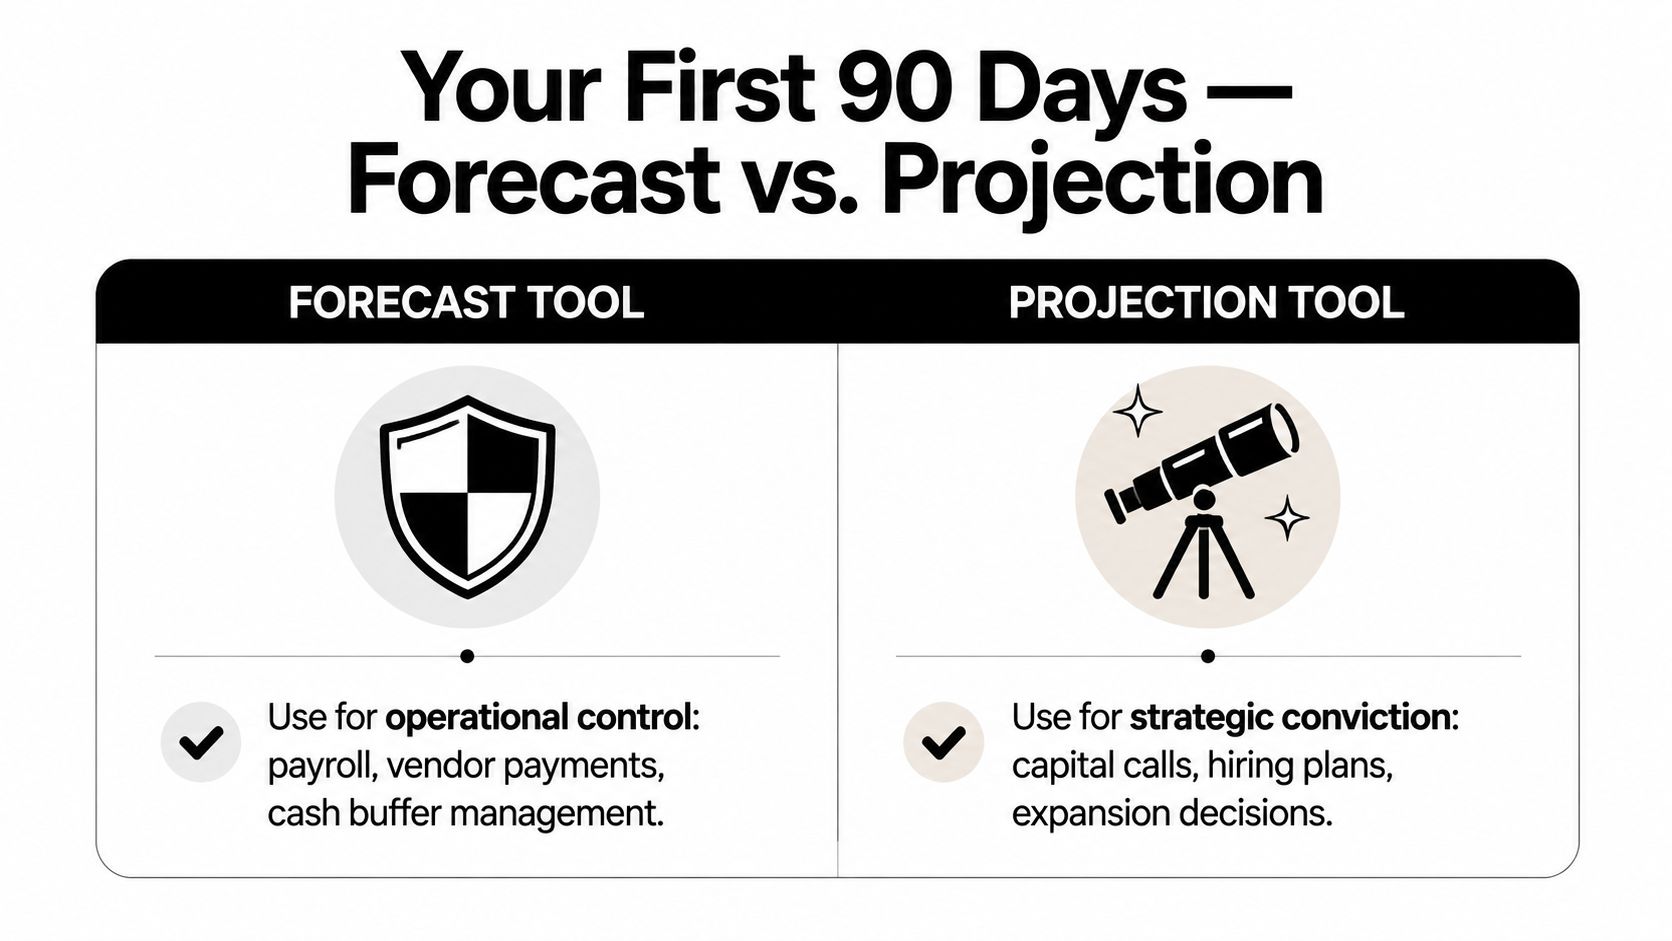
Days 1 to 30
Lock the 13-week cash forecast. Assign one accountable owner, connect the model to the bank feed, establish the AR and AP refresh process, and document the minimum cash threshold. Review it every Monday and record the action taken for every material risk.
Days 31 to 60
Add the 12-month scenario projection with Base, Downside, and Stretch cases. Connect revenue to pipeline coverage and churn. Connect cost to headcount and contractual increases. Use the projection to evaluate the next capex and hiring decisions instead of relying on a single budget line.
Days 61 to 90
Wire both models into the monthly FP&A meeting. Retire the older spreadsheet that duplicates one of the models. Set quarterly checkpoints tied to board, lender, and advisor updates. Confirm that the forecast's opening period reconciles to the projection's Base case within the agreed tolerance.
Use this one-page operating checklist:
- Data sources: Bank feed, AR aging, AP due dates, payroll register, debt schedule, pipeline, headcount plan, and contract assumptions.
- Owner assignments: One person owns the forecast refresh, one person validates actuals, and the owner approves actions.
- Variance triggers: Document the tolerance that requires a re-forecast and the person responsible for explaining the miss.
- Decision rights: Forecast controls near-term cash actions. Projection controls strategic capital and hiring decisions.
- Exit readiness: Maintain a current projection that supports valuation discussions, transition timing, lender conversations, and owner compensation planning.
- Review checkpoints: Confirm monthly close updates and quarterly scenario reviews are on the leadership calendar.
The objective isn't to maintain two impressive spreadsheets. It's to give every important decision a model with the right horizon, inputs, accountability, and consequence.
AmbitionCFO works with founder-led businesses on 13-week cash flow modeling, financial forecasting, scenario planning, profitability analysis, and exit planning. If your team is using one spreadsheet to manage both payroll risk and long-term capital decisions, visit AmbitionCFO to discuss a finance system built around the decisions your business needs to make next.