
Your forecast says cash will be fine next quarter. Then a large job starts late, materials were ordered too early, receivables slip, and suddenly your line of credit is doing the heavy lifting. That's the moment most founders start asking the right question.
How accurate should our forecast be, and what do we need to change to trust it?
If you run a construction, distribution, or services business, forecasting accuracy isn't an academic metric. It decides whether you hire too soon, buy too much, miss payroll pressure early warnings, or commit capital based on a model that was never reliable in the first place. The fix usually isn't one better spreadsheet. It's better segmentation, cleaner history, the right metric, and realistic expectations by time horizon.
Table of Contents
- Understanding Forecasting Accuracy
- Measuring Forecasting Accuracy
- Diagnosing Common Forecast Errors
- Improving Forecasting Accuracy with Best Practices
- Industry Considerations for Construction Distribution and Services
- Implementation Checklist and Metrics Tracking
- Next Steps to Enhance Your Forecasting Accuracy
Understanding Forecasting Accuracy
A bad forecast rarely looks dangerous on the day you approve it. It usually looks reasonable.
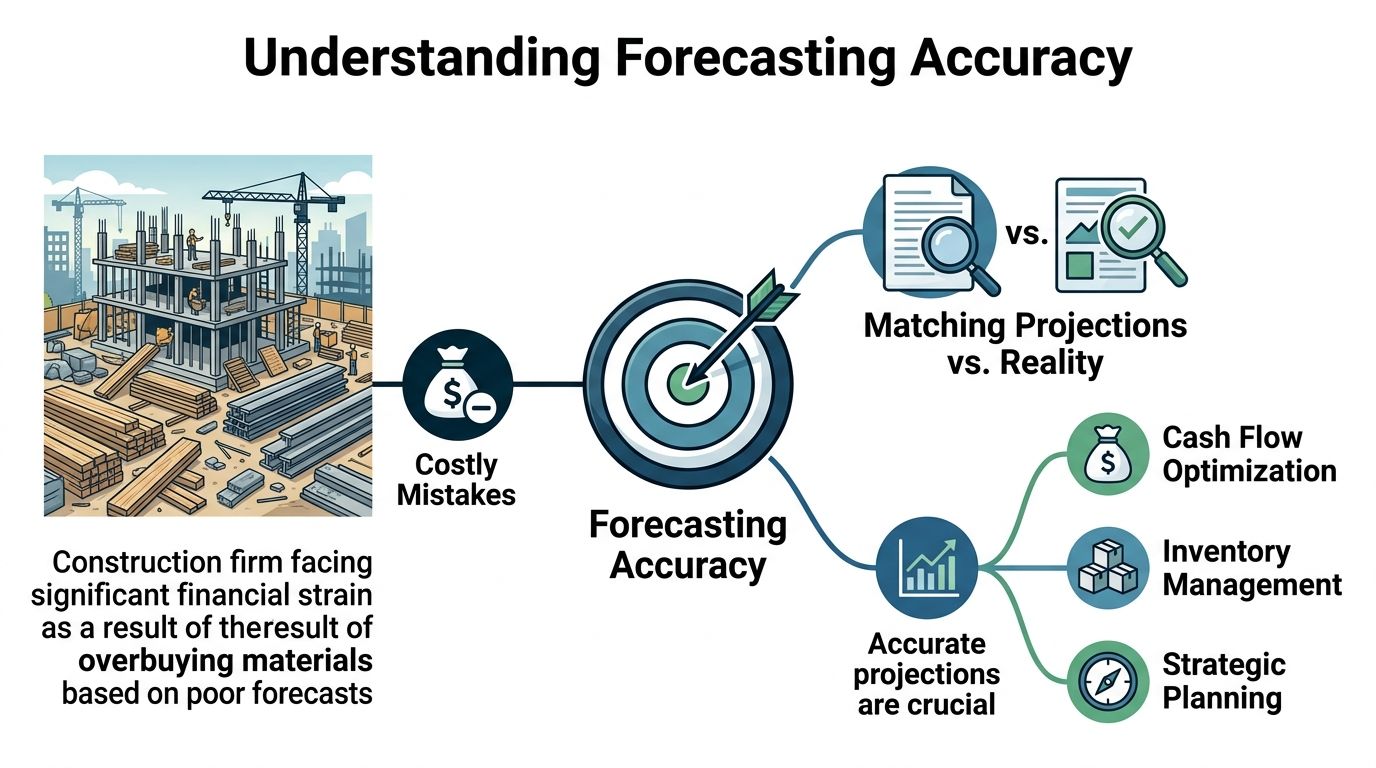
A construction firm buys ahead for several projects based on a demand plan that assumes smooth timing. One project gets delayed, another changes scope, and cash gets trapped in materials that won't turn into billings soon. The issue isn't only purchasing. The issue is that leadership treated the forecast as truth when it was really a rough estimate with hidden volatility.
Forecasting accuracy is how closely your projection matches what happens. In business terms, it answers one question: Can I rely on this forecast to make decisions about cash, inventory, staffing, and capital?
Why it matters to founders
Forecasting accuracy sits underneath nearly every major financial decision:
- Cash flow planning: You need to know whether projected inflows will arrive when payroll, debt service, and vendor payments hit.
- Working capital control: If the forecast overstates demand, you tie up cash. If it understates demand, you miss revenue and create operational fire drills.
- Capital decisions: Equipment purchases, hiring, and expansion plans all depend on whether the forecast is dependable enough to support commitment.
Practical rule: Don't ask whether your forecast is “good.” Ask whether it's accurate enough for the decision you're making.
That distinction matters. A forecast that's useful for a yearly strategic plan may be useless for a near-term cash decision. And a portfolio-wide benchmark is often misleading. In supply chain settings, stable, high-volume products can achieve 85% to 95% accuracy, intermittent items usually land in the 50% to 70% range, and fresh or weather-sensitive products tend to sit around 70% to 80%, which is why segmentation matters so much (RELEX on forecast accuracy by demand type).
The mental model that helps
Treat every forecast as a mix of signal and noise.
Signal is the repeatable pattern in the business. Noise is the volatility you can't model cleanly, or haven't cleaned out of the data yet. Founders get into trouble when they assume all variance is operator error. It isn't. Some forecast error is structural. Some is avoidable. Your job is to tell the difference fast.
Measuring Forecasting Accuracy
Most companies measure forecasting accuracy badly before they ever try to improve it. They use one metric for everything, mix sales with demand, ignore bias, and then wonder why the dashboard doesn't help anyone make decisions.
What the metric should answer
Your metric should match the business problem.
If you're tracking inventory or purchasing, use true demand, not just recorded sales. The standard formula is Forecast Accuracy = 1 – (|Forecast – Actual| / Actual) × 100, and it should use actual demand rather than sales figures so stockouts don't distort the result (ORM Technologies on the forecast accuracy formula).
If you forecasted 1,000 units and only sold 500 because you stocked out, using 500 as the “actual” gives you a false read. The market wanted more than you supplied.
Key accuracy metrics
Here's the short list I recommend most founders use.
| Metric | Calculation | When to Use |
|---|---|---|
| Forecast Accuracy | 1 – (|Forecast – Actual| / Actual) × 100 | Best for a simple business-facing view of how close forecasted demand was to reality |
| MAPE | Mean of absolute percentage errors | Useful when actual values are comfortably above zero and you want an average percentage error view |
| MDAPE | Median(|(Actual − Forecast) / Actual|) × 100% | Better for volatile, short, or intermittent series where outliers can distort the mean |
| Forecast Bias | Directional tendency to over-forecast or under-forecast | Essential when you need to know whether misses are random or systematically one-sided |
MAPE stands for Mean Absolute Percentage Error. It's widely used because it's intuitive. Lower is better. But MAPE breaks down when actual values get close to zero.
MDAPE stands for Median Absolute Percentage Error. When actual values can be close to zero, MAPE fails, making MDAPE more stable for volatile series. MDAPE is calculated as Median(|(Actual − Forecast)/Actual|)×100% (explanation of MAPE vs MDAPE).
If you have lumpy demand, small job-based revenue streams, or low-volume SKUs, stop pretending MAPE alone tells the truth.
Bias matters just as much as accuracy. A model that misses high one month and low the next might average out acceptably. A model that consistently over-forecasts is dangerous because it pushes inventory, labor, and spending decisions in the wrong direction.
For planning teams, realistic monthly and weekly error bands vary by demand pattern. Stable, high-volume products often achieve MAPE in the 10% to 20% range at the monthly horizon, seasonal or promotional items at the weekly horizon tend to land in the 20% to 35% range, and slow-moving or intermittent demand items often exceed 40% MAPE regardless of model sophistication (R4 on demand-pattern-specific MAPE ranges).
For finance teams, that means one thing. Build segmented benchmarks, not one vanity number. If you're already reviewing budget variance, fold forecasting accuracy into the same discipline using a consistent budget vs actual variance analysis process.
Diagnosing Common Forecast Errors
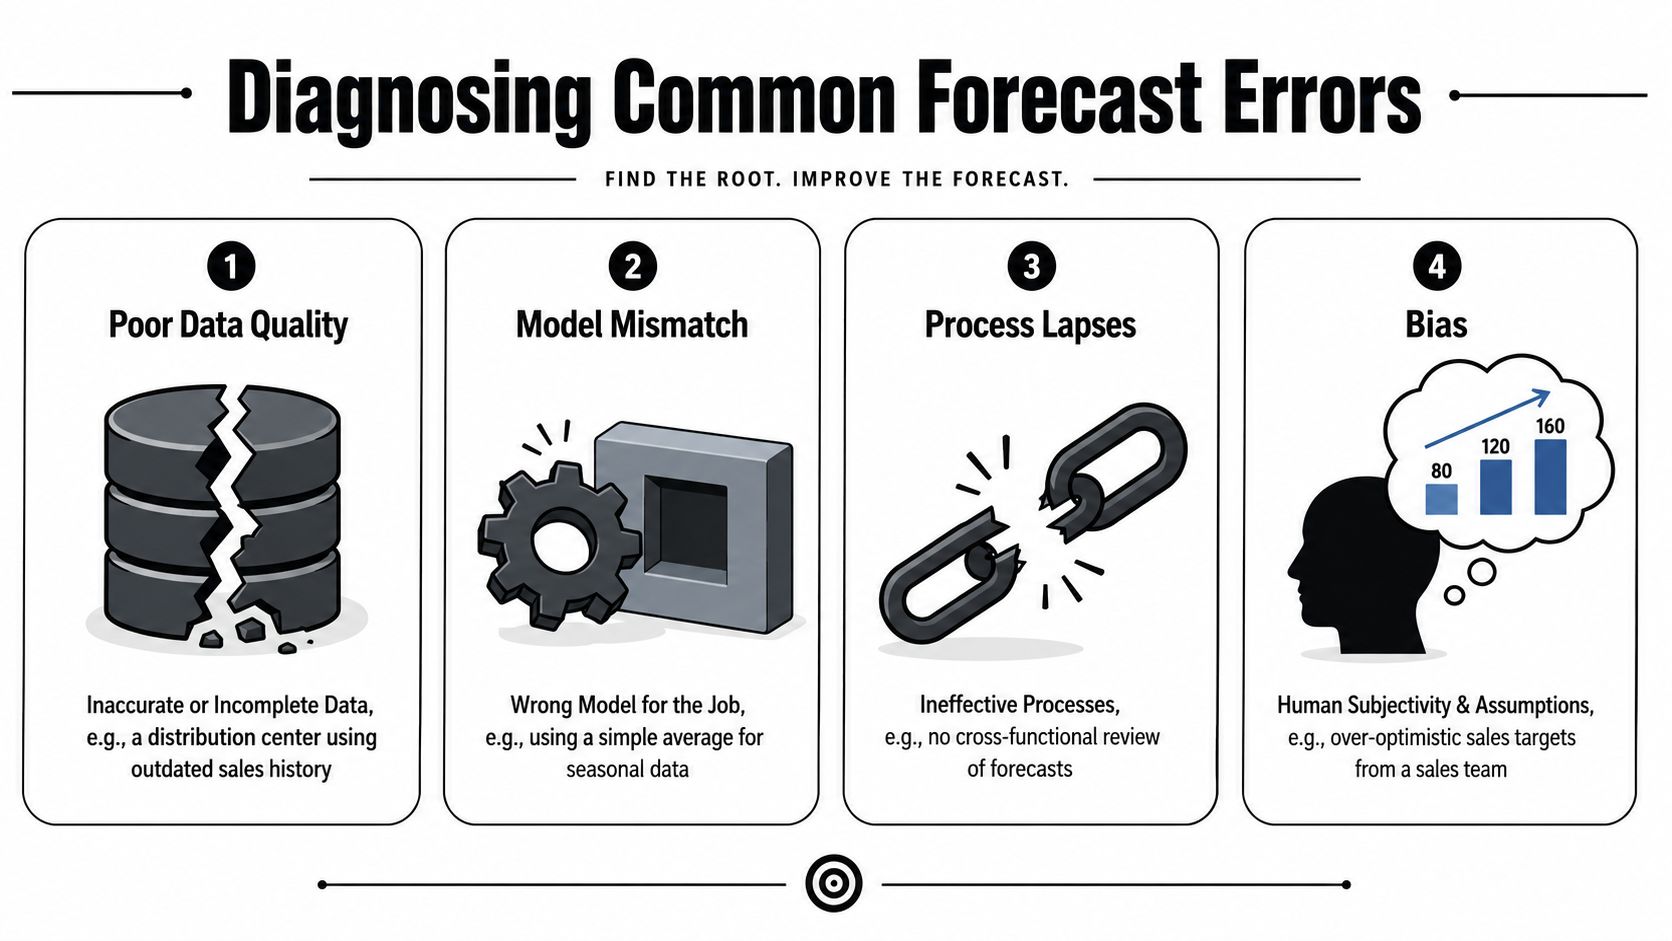
When founders tell me their forecast “just isn't reliable,” the underlying problem usually falls into one of four buckets. Data is dirty. The model doesn't fit the pattern. The process is loose. Or bias is baked into the inputs.
Four failure points that show up repeatedly
- Poor data quality: A distribution business pulls “history” from a system that changed item codes, excluded lost sales, and mixed one-time promos with baseline demand. The forecast was wrong before anyone opened Excel.
- Model mismatch: A services firm uses a simple rolling average even though demand rises and falls with renewal cycles, project starts, and seasonal client budgets.
- Process lapses: Sales, operations, and finance never review assumptions together. Everyone updates their own version. Nobody owns the final call.
- Bias: Sales sandbags one quarter and overcommits the next. Operations pads demand. Finance cuts the middle and calls it consensus.
These failures don't create the same damage. Dirty history raises noise. Model mismatch creates repeatable error. Process gaps delay correction. Bias pushes decisions consistently in the wrong direction.
How to review forecast versus actuals correctly
Run a root-cause review by segment, horizon, and owner. Don't review one giant company total. That hides where the problem starts.
Use this sequence:
- Split the forecast by segment: Product family, branch, service line, customer class, or project type.
- Compare at the right horizon: Weekly for short-cycle decisions, monthly for broader planning, longer views for strategic scenarios.
- Separate error from bias: A miss is not always a bias issue. A repeated directional miss is.
- Assign a financial consequence: Which errors caused excess cash use, missed sales, idle labor, or delayed purchasing decisions?
Forecast bias deserves its own line item. Over-forecasting drives excess inventory costs, while under-forecasting causes missed sales. Measuring both sides helps you prioritize improvements where financial impact is highest (Manhattan Associates on forecast bias and cost impact).
The fastest way to improve forecasting accuracy is to stop treating every miss as equal. Some misses are annoying. Some are expensive.
If your forecast misses keep creating liquidity stress, connect the review directly to your cash flow problems and solutions framework. That forces the team to focus on consequences, not excuses.
Improving Forecasting Accuracy with Best Practices
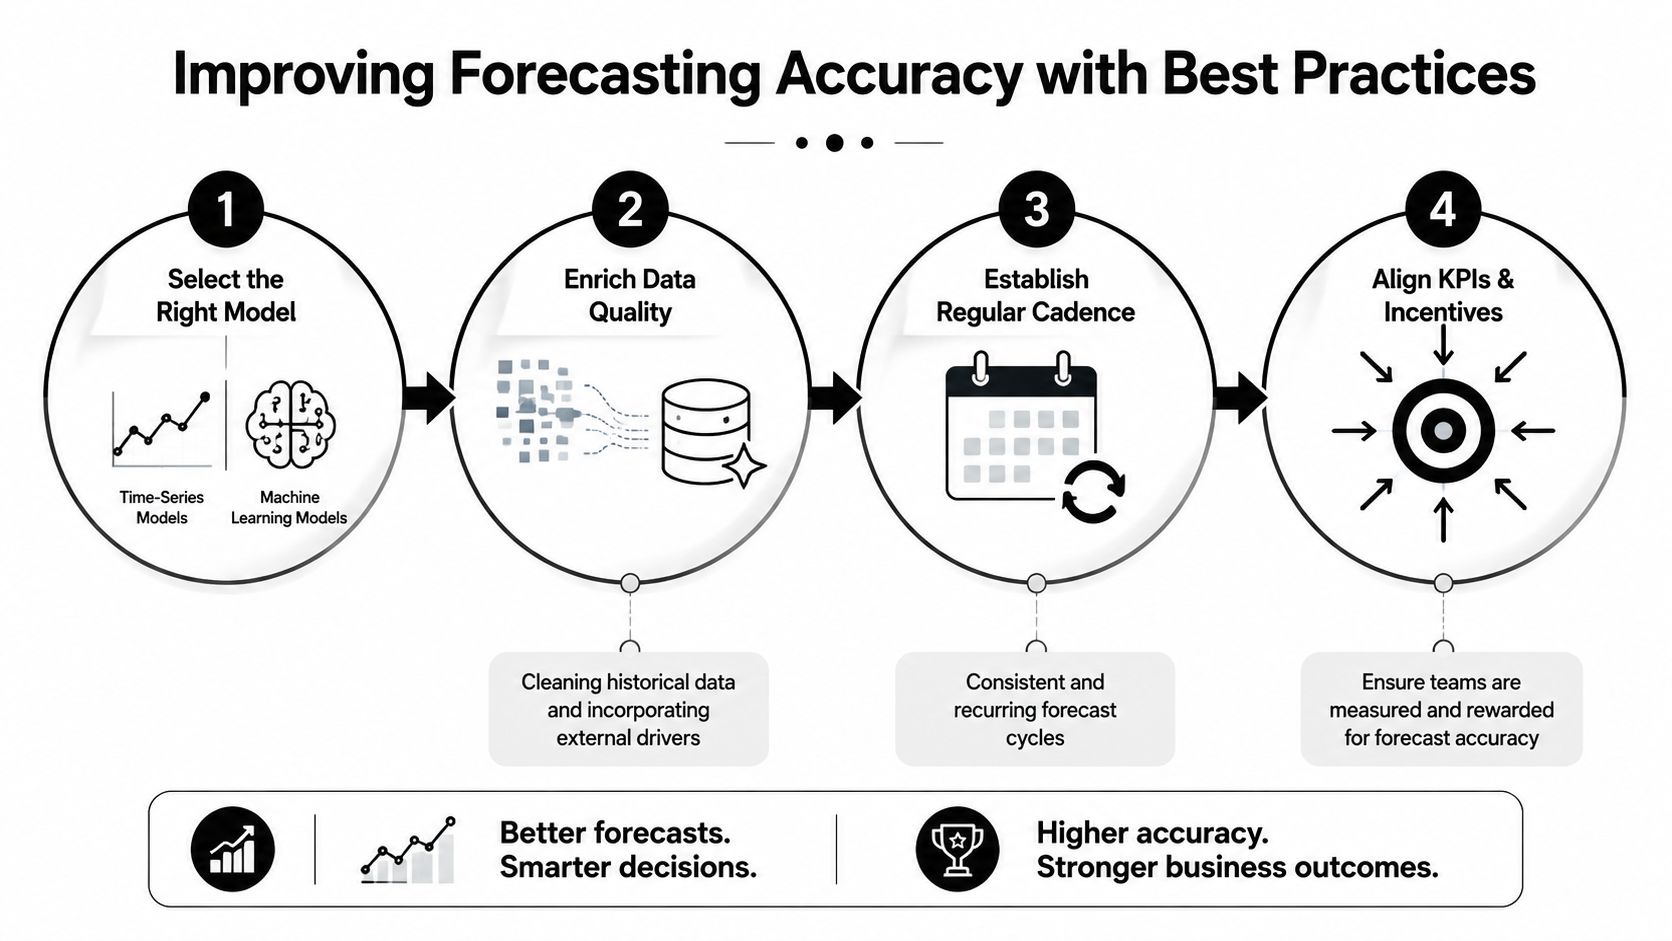
Most businesses don't need a more elaborate forecasting story. They need a tighter forecasting process. Start with fit, then data, then cadence, then tooling.
Start with the model that fits the data
Choose the model based on data shape, not software marketing.
Seasonal models like ETS or SARIMA need 24 months of monthly data to capture annual seasonality well. ARIMA generally needs 30 to 60+ observations, and LSTM models usually need over 500 observations. Best practice also points to using the most granular practical history and aiming for at least two years of demand history (historical data requirements for forecasting models).
That means:
- Use simpler time-series models first when your history is clean and patterns are understandable.
- Avoid forcing advanced AI on thin data. That's how founders end up with elegant nonsense.
- Separate baseline demand from event-driven demand when promotions, projects, or one-off contracts distort the pattern.
For many mid-sized firms, a disciplined manual scenario process still beats an overfit model. Human judgment matters when short-term cash flow depends on known contract wins, job timing changes, or customer-specific behavior that hasn't shown up in historical data yet (discussion of when human overlay still matters).
Here's a useful primer if your team needs a quick visual refresher before revising its process:
Clean the history before you optimize the model
Forecasting accuracy improves when the past is polished first.
That means removing obvious distortions, labeling exceptional events, correcting timing errors, and reconciling master data. Signal-to-noise ratio matters more than brute volume. A cleaner dataset with clear seasonality can outperform a larger messy one.
Use a short data cleanup checklist:
- Tag anomalies: One-time project wins, unusual weather periods, extraordinary promotions, and stockouts need labels.
- Fix timing mismatches: Revenue booked late and demand recorded early will break pattern detection.
- Align granularity: Don't mix daily operational data with monthly financial assumptions without a deliberate rollup method.
Operator warning: Don't spend on machine learning until you trust the transaction history feeding it.
Build a review cadence that forces learning
Forecasts improve when the team learns from misses on a schedule.
Set a regular forecast-vs-actual review. Finance should own the scorekeeping. Sales, operations, and delivery should own the assumptions behind their numbers. Review the biggest misses, the directional bias, and the financial consequence. Then update the model or rule set.
A strong cadence includes:
- A frozen forecast cut-off: Stop endless mid-period edits.
- One owner by segment: Someone has to explain the miss.
- A short root-cause code list: Timing, quantity, pricing, lost demand, scope change, external event, or bad input.
If your reporting pack is inconsistent, fix that before you chase accuracy gains. Strong forecasting sits on top of disciplined financial reporting best practices.
Use AI selectively, not blindly
AI can help. It isn't magic.
Machine learning systems reduce errors by 20% to 50% over spreadsheets or manual judgment, shifting traditional MAPE from 15% to 40% down to 5% to 15%, with ROI in 12 to 24 months (machine learning versus traditional forecasting benchmarks). That can be worth it when you have high-volume, long-lead-time items or costly forecasting mistakes.
But implementation costs are real, and the return depends on where accuracy improvements release cash, protect margin, or improve service. If you're a founder-led firm with mixed demand patterns and limited clean history, a segmented process with scenario planning often produces a better result than pushing everything through one model.
Industry Considerations for Construction Distribution and Services
A founder looks at one company-wide forecast accuracy number and thinks the process is under control. Then a project start slips in construction, a buyer overstocks slow-moving distribution items, and a services team misses a hiring window because expected work landed a month late. The average looked fine. The operating decisions did not.
Forecast accuracy falls apart by horizon and by business model. A 30-day view should be held to a tighter standard than a 90-day or 180-day view. Construction, distribution, and services each break for different reasons, so each needs its own benchmark, review cadence, and forecast design.
Construction needs timing discipline more than a prettier revenue forecast
Construction forecasts fail when teams treat backlog like guaranteed cash by month. It is not. Sequencing is the issue. Job starts move, change orders lag, procurement commitments hit before billing catches up, and labor needs bunch up fast.
Run construction forecasting in layers:
- Committed backlog by month, based on current schedules and billing terms
- Probable awards separately, with clear confidence assumptions
- Cash needs by labor, materials, equipment, and subcontractors, not one rolled-up cost line
- Long-lead purchases tied to project confidence and release dates
Then judge accuracy by horizon. Near-term forecasts should focus on schedule adherence, billing timing, and cash conversion. Longer-range forecasts should focus on backlog quality and bid-to-book conversion. For operating reviews, tie forecast discussions to the field data inside a construction KPI dashboard for project and financial performance. That will expose forecast risk faster than a clean monthly P&L.
Distribution needs segmented benchmarks, not one company target
Distribution teams usually set one accuracy target and call it discipline. That creates bad buying behavior.
Use separate standards for at least three groups: core repeat items, seasonal or promotion-driven items, and intermittent or special-order demand. Then set different expectations by horizon. Near-term demand for core items should be materially tighter than the same items at a quarterly horizon. Intermittent demand should never be judged by the same threshold as fast movers because the purpose of the forecast is different. For core items, you are protecting service and inventory turns. For intermittent items, you are usually sizing risk and reorder logic.
That distinction matters. If leadership pushes buyers to hit the same accuracy target across every SKU class, they will protect themselves with extra stock on the wrong items and still miss service on the right ones.
A better operating rule is simple:
- Core repeat items: track weekly and monthly accuracy separately
- Seasonal items: compare forecast to season profile and event timing, not just aggregate volume
- Intermittent and special-order items: focus on bias, stockout risk, and order timing more than raw percentage accuracy
- Supplier-constrained items: review forecast quality alongside lead time volatility and fill-rate performance
Services businesses need pipeline timing and capacity alignment
Services firms rarely have a product forecasting problem. They have a timing and staffing problem.
Revenue can look on plan while delivery capacity is already offside. A deal slips two weeks. A renewal closes late. A project starts before the right team is staffed. Margin drops even though the top-line forecast still looks acceptable.
Build the forecast around demand conversion and delivery capacity:
- Renewals, expansions, and new work as separate streams
- Expected start dates and ramp curves, not just contract value
- Utilization, billable headcount, and hiring lead times in the same view
- Role-specific capacity gaps, especially for scarce technical or client-facing positions
Here again, use horizon-specific standards. Short-range accuracy should answer whether staffing and delivery plans are right for the next month or quarter. Longer-range accuracy should show whether the pipeline supports hiring and margin plans without forcing bench cost or burnout.
The point is straightforward. Do not ask one forecast process to serve three different businesses. Construction needs schedule and cash timing accuracy. Distribution needs segmented item-level benchmarks by demand pattern and horizon. Services needs workload and capacity visibility before revenue recognition makes the problem obvious.
Implementation Checklist and Metrics Tracking
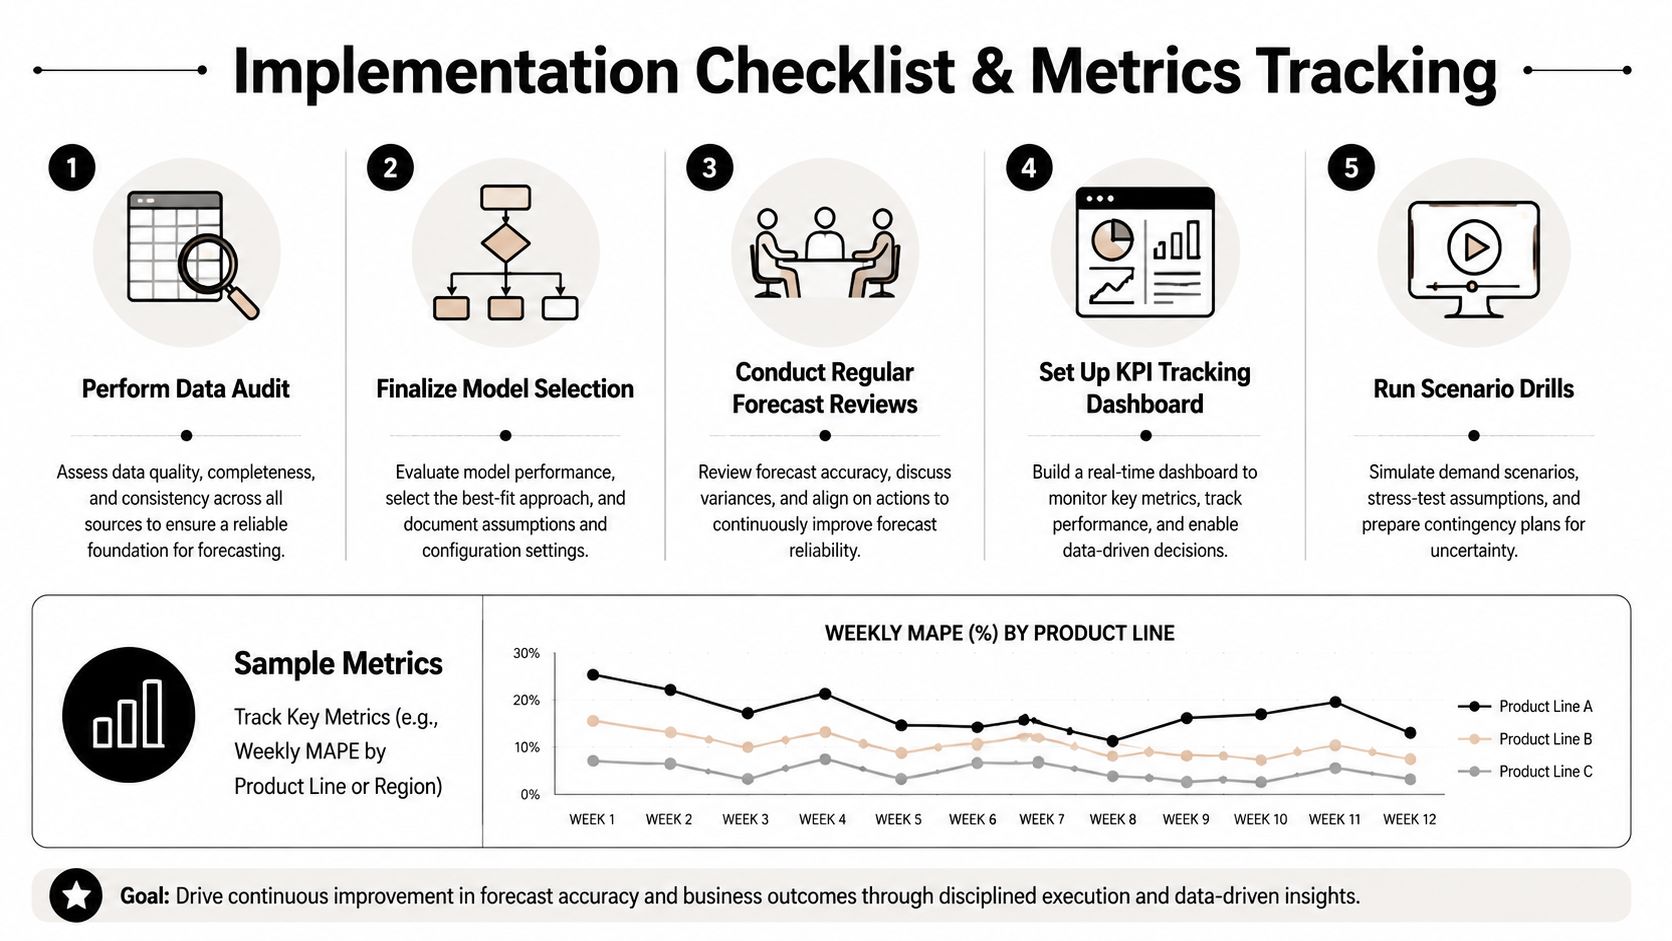
Most forecasting improvement efforts fail because nobody turns the ideas into an operating rhythm. You don't need a giant transformation project. You need a sequence, ownership, and a dashboard that shows whether the process is getting better.
A practical rollout sequence
Use this checklist in order.
Perform a data audit
Pull the history you use for forecasting. Check completeness, coding consistency, stockouts, timing issues, and major anomalies.Finalize model selection
Pick the simplest model that matches the pattern. Different segments may need different models or even manual overlays.Conduct regular forecast reviews
Set a recurring meeting with one version of the numbers, one owner per segment, and explicit root-cause notes for major misses.Set up a KPI dashboard
Track accuracy and bias by segment and by horizon. If the dashboard only shows one company-wide total, it won't drive better decisions.Run scenario drills
Pressure-test what happens if demand slips, a project moves, a customer delays, or a purchasing commitment lands earlier than planned.
What to put on the dashboard
A key concept that is often missed is forecast accuracy degradation. Forecasts naturally get weaker as the horizon extends. Accuracy often decays beyond 4 to 12 weeks, so businesses should set horizon-specific benchmarks and track degradation curves tied to decision triggers (SPS Commerce on forecast accuracy degradation).
That means your dashboard should include:
- Accuracy by horizon: Don't blend short-term and long-term forecasts into one score.
- Bias trend: Show repeated over-forecasting and under-forecasting separately.
- Segment-level performance: Product line, region, customer type, service line, or project class.
- Forecast versus actual review notes: Not just the metric. The cause.
A twelve-month forecast can be useful and still be wrong in ways that would be unacceptable at thirty days. That isn't failure. That's horizon reality.
You also need to align the forecast horizon with the decision. Purchasing might need a shorter operational view. Capacity planning may need a broader window. Cash planning needs both.
If you want the dashboard to influence management behavior, pair it with a small set of company-level financial metrics every business owner should track. That keeps forecasting connected to cash, margin, and working capital instead of leaving it as an isolated FP&A exercise.
Next Steps to Enhance Your Forecasting Accuracy
Forecasting accuracy improves when leadership gets serious about three things. Measure the right way. Segment the business properly. Review misses with discipline.
That's the core playbook.
What to do this week
If you want immediate traction, do these three things first:
- Pick one metric set: Use forecast accuracy plus bias. Add MDAPE if your actuals can get close to zero or demand is intermittent.
- Segment the forecast: Don't let stable and volatile revenue streams share one benchmark.
- Schedule a forecast-versus-actuals meeting: Review the last closed period and force every major miss into a root-cause category.
Then look at your forecast by horizon. Separate what needs to be accurate in the near term from what only needs to be directionally useful over a longer planning window. Founders often call a model “bad” when it's just being used for the wrong decision.
What better forecasting changes in the business
When you improve forecasting accuracy, the business gets calmer.
Cash planning becomes more credible. Inventory and purchasing decisions improve. Hiring gets less reactive. Capital spending gets easier to justify. Banks, investors, and buyers take your numbers more seriously because your team has a track record of calling reality with discipline instead of explaining misses after the fact.
That matters even more if you're planning expansion, a management transition, or an eventual exit. Buyers and lenders don't just look at historical results. They look at whether management understands the business well enough to predict what comes next.
One more hard truth. You probably do not need a perfect forecast. You need a forecast that is reliable enough for the decision in front of you. Chasing precision everywhere wastes time. Building trustworthy ranges where they matter enables effective action.
Start with a worksheet if that helps. Use the checklist above. Build the dashboard. Force a real review meeting onto the calendar. If your current process still depends on gut feel, disconnected spreadsheets, or one company-wide forecast number, fix that now.
If your business has outgrown basic budgeting and you need sharper forecasting for cash flow, growth decisions, or exit planning, talk with AmbitionCFO. A fractional CFO can help you build a forecast process that management can effectively use, not just admire in a spreadsheet.