

Your business shows positive operating cash flow. Can you spend that cash, pay down debt, or take a distribution? Not always, and that is the gap most owners miss.
Operating cash flow vs free cash flow is not a contest to pick the higher number. The first tells you whether operations generate cash. The second tells you what remains after you reinvest in the assets that keep revenue coming in. Even then, basic free cash flow can leave out lease principal, acquisition payments, and required debt payments.
Use both numbers, then reconcile to a third one that matters most for decisions: owner-available cash.
Table of Contents
- Operating Cash Flow and Free Cash Flow Side by Side
- How to Calculate Both From Your Cash Flow Statement
- Why Positive Free Cash Flow Can Still Overstate Cash
- What Public Company Reports Show About the Gap
- Which Number to Use for Each Decision
- Building a Monthly Cash Check You Can Repeat
- Using the Gap for Profitability and an Exit
- Confirm Your Owner-Available Cash Before You Decide
Operating Cash Flow and Free Cash Flow Side by Side
Operating cash flow is cash from core activities after changes in receivables, payables, inventory, and other operating accounts. It shows whether customers, jobs, and day-to-day spending produce cash before you buy long-term assets.
Free cash flow is what remains after spending on assets needed to maintain or grow the business. That spending is usually capital expenditures, or capex, such as equipment, vehicles, software, and buildings bought with cash.
Operating Cash Flow vs Free Cash Flow at a Glance
| Criteria | Operating cash flow | Free cash flow |
|---|---|---|
| What it measures | Cash from core operations after working capital changes | Operating cash left after spending on assets needed to maintain or grow the business |
| Typical formula | Net cash provided by operating activities | Operating cash flow minus capital expenditures |
| Includes capex | No | Yes |
| Standardized | Yes, a standard cash flow statement subtotal | No, a non-GAAP measure defined by each company |
| Best used for | Judging how well operations convert profit to cash | Judging cash for debt paydown, growth and distributions |
That difference in standardization matters. Finzer's operating cash flow guide is a useful primer if you want the operating side in plain language before you build your own reporting.
Free cash flow is not a standardized GAAP measure, and an SEC filing describing free cash flow as a non-GAAP measure cautions that it is not an alternative to GAAP cash flow from operating activities. One company subtracts only capex. Another also subtracts intangible assets, distributions to noncontrolling interests, or selected nonoperating payments.
Practical rule: Operating cash flow shows how well the business runs. Free cash flow shows how much cash you can use after reinvestment.
Track both every month, using the same definition. Write that definition on your report, showing operating cash flow, property and equipment purchases, software purchases, other adjustments, and the resulting free cash flow.
How to Calculate Both From Your Cash Flow Statement
Start with the statement your accounting system already produces. You pull two lines, then do one subtraction.
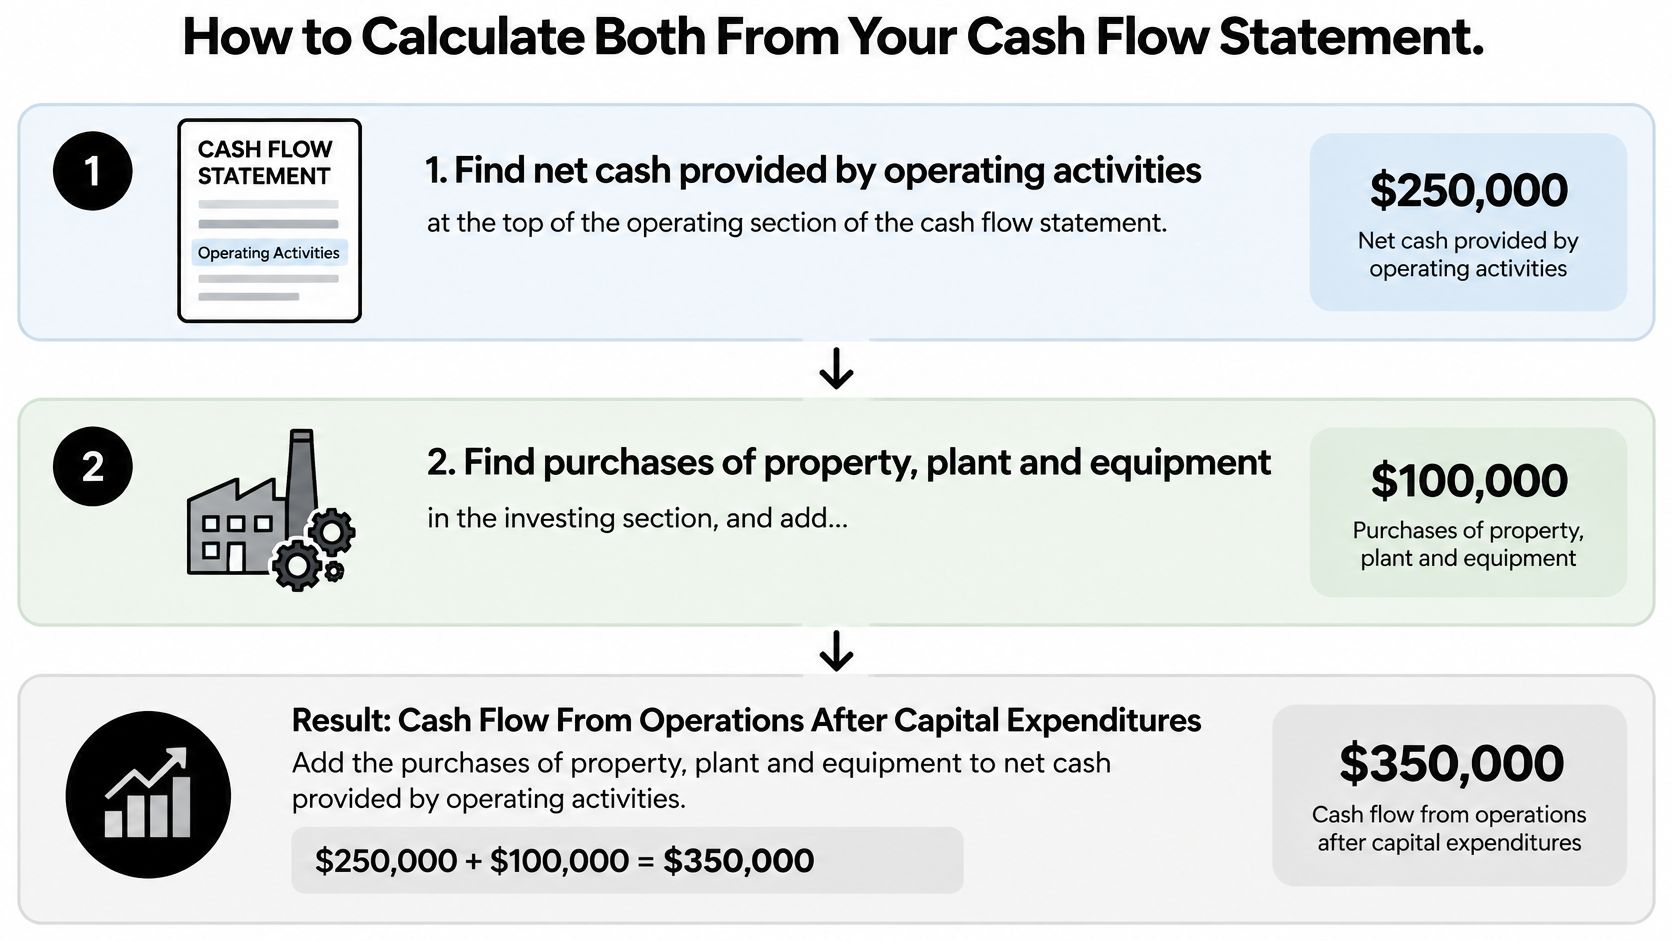
Four Steps to Get Both Numbers
Find net cash provided by operating activities. This subtotal sits at the end of the operating section. It is operating cash flow, already adjusted for receivables, payables, inventory, and noncash items.
Find capex in the investing section. Look for purchases of property, plant, and equipment. Include software or other intangible purchases you capitalize, because they use cash the same way trucks and machinery do.
Subtract capex from operating cash flow. The SEC exhibit defining free cash flow as operating cash flow minus capital expenditures describes it as cash generated after spending on assets needed to maintain or expand the business.
Record the gap. Your worksheet needs operating cash flow, capex, free cash flow, and the gap as a percentage of operating cash flow. That percentage shows how much operating cash reinvestment consumed.
If you are still learning where each line lives, this guide to understanding cash inflows and outflows walks through each section in order. If profit looks fine but cash feels tight, this explanation of converting accrual profit to cash shows why the two diverge.
A Worked Example You Can Copy
A distribution company reports $1.0 million of operating cash flow and buys $300,000 of equipment and software. Free cash flow is $700,000.
Plan debt paydown or distributions from $700,000, not from $1.0 million. The larger number measures operations. The smaller number is the starting point for spending decisions.
The math also works in reverse. When capital expenditures exceed operating cash flow for the period, free cash flow turns negative and leaves no discretionary cash. Operations can be cash positive while reinvestment absorbs every dollar.
Two slips cause most errors. Pulling capex from a dashboard total instead of tying it to the investing section. And mixing signs, since outflows often print as negatives. Subtracting a negative inflates the result.
A healthy pattern is easy to describe. Free cash flow stays positive across most months, and you can name the purchase behind any large gap. Investigate a widening gap with no named project before you commit cash elsewhere.
Why Positive Free Cash Flow Can Still Overstate Cash
Start with $800,000 of operating cash flow. Subtract $200,000 of capex and you get $600,000 of basic free cash flow. That looks spendable.
Now subtract a $250,000 lease principal payment and a $300,000 acquisition payment. Only $50,000 remains, before taxes, mandatory debt payments, or owner distributions. The formula wasn't wrong. It was incomplete for the decision.
An SEC disclosure warning that free cash flow may exclude lease and acquisition payments makes the same point. Reported free cash flow is not automatically surplus cash.
Cash Items That Basic Free Cash Flow May Miss
| Cash item | Deducted in basic FCF? | Reduces spendable cash? | Example amount |
|---|---|---|---|
| Equipment and vehicle purchases | Yes | Yes | $200,000 capex in the example |
| Capitalized software and intangibles | Often not | Yes | Your capitalized purchase total |
| Lease principal payments | Often not | Yes | $250,000 in the example |
| Acquisition payments | Often not | Yes | $300,000 in the example |
| Mandatory debt amortization | No | Yes | Scheduled principal |
| Planned owner distributions | No | Yes | Set by owner policy |
Use a Three-Layer Bridge Instead
- Layer 1, operating cash flow: Did operations generate cash this period?
- Layer 2, maintenance free cash flow: What remains after a normalized reserve for replacing worn equipment, vehicles, and software at current capacity?
- Layer 3, discretionary free cash flow: What remains after growth investment, debt service, taxes, and planned distributions?
This protects you from lumpy spending. A contractor can skip truck replacements for two years and report strong free cash flow, then face a fleet bill that wipes it out. A distributor faces the same pattern with forklifts, racking, and delivery vehicles. A professional services firm may not buy trucks, but capitalized software and hiring commitments tied to new capacity work like investment and drain future cash.
Working capital creates a second trap. Growth can require more receivables and inventory before customers pay you back, which is why working capital management belongs in the same review. A month with strong operating cash flow may reflect slow supplier payments or a one-time collection push.
A positive free cash flow number should survive two tests before you spend it: a normalized maintenance reserve and a 13-week cash forecast.
If it fails either test, don't call it available. Name the obligation that claims it first.
What Public Company Reports Show About the Gap
Public companies make the reinvestment gap visible because they report both figures. The lesson isn't their size. It's how much operating cash never reaches the owner.
Operating Cash Flow, Free Cash Flow and the Reinvestment Gap
| Company or example | Operating cash flow | Free cash flow |
|---|---|---|
| HUGO BOSS, FY2024 | €786 million | €497 million |
| PUMA, 2024 | €694.8 million | €464.3 million |
| SEC-reported example, trailing twelve months | $4.6 billion | about $3.2 billion |
The HUGO BOSS 2024 Annual Report reported €786 million in cash flow from operating activities and €497 million in free cash flow for fiscal year 2024. The gap is €289 million, about 37 percent of operating cash flow.
The PUMA 2024 Annual Report reported €694.8 million in net cash from operating activities and €464.3 million in free cash flow for 2024. That's a gap of €230.5 million, about 33 percent.
An SEC-reported earnings exhibit lists trailing-twelve-month operating cash flow of $4.6 billion, capital expenditures of $1.3 billion, and free cash flow of approximately $3.2 billion. The gap is roughly 30 percent.
These businesses are far larger than a mid-market company, so don't copy their percentages as targets. Use the pattern as a sanity check. If a third of your operating cash goes back into assets, can you name where it went and what capacity it protects? If almost none does, are you underinvesting and borrowing from future years?
Compare only figures that subtract the same items. A business that deducts software will look weaker than one that doesn't, even with identical cash. That discipline also strengthens your view of profit quality, which earnings quality analysis covers in more depth.
Which Number to Use for Each Decision
Start with the number your decision draws from. Then check every obligation that decision must still cover. That rule prevents the most expensive mistake: using operating cash flow for a decision that only free cash flow can fund.
Which Cash Number to Use for Each Decision
| Decision | Start with | Check before committing |
|---|---|---|
| Paying down debt | Free cash flow after capex | Mandatory amortization and lease principal |
| Hiring crews or project managers | 13-week cash forecast | Payroll timing before collections |
| Buying or leasing equipment | Maintenance free cash flow | Replacement cycle and lease obligations |
| Owner distributions | Owner-available cash after all obligations | Reserve for the next 13 weeks |
| Judging operations or collections | Operating cash flow trend | Working capital swings over three months |
Debt paydown needs free cash flow, not operating cash flow. If you use operating cash to retire debt, then replace a vehicle fleet from the same cash, you've spent it twice. Subtract required principal first, then decide how much extra paydown is safe.
Hiring is a timing decision before it's an annual budget decision. Payroll starts on a fixed schedule. Collections from the new crew's work arrive later, sometimes after retainage or slow approvals. A 13-week forecast shows whether the weeks between payroll and collection stay funded.
AmbitionCFO helps owners understand the financial impact of major decisions, such as adding crews, hiring project managers, taking larger projects, or buying or leasing equipment, before they commit resources. That's the right order. Model the commitment, then sign it.
Equipment purchases belong against maintenance free cash flow. Say a contractor sees strong basic free cash flow because replacement was deferred. Buying an additional machine for growth looks affordable until two older units also need replacement and lease payments stack up. The replacement cycle decides affordability over time, not one good quarter.
Owner distributions come last. Use owner-available cash after capex, lease principal, debt amortization, taxes, and a reserve for the next 13 weeks. If the reserve isn't funded, the distribution isn't excess cash yet.
Judging operations is where operating cash flow earns its place. Track its trend over at least three months. One month can jump because a large receivable landed or a payable slipped. The trend shows whether collections, margins, and inventory decisions are improving.
Match the measure to the commitment. Long commitments need cash that survives reinvestment and timing, not a single strong month.
Building a Monthly Cash Check You Can Repeat
A one-page monthly check turns operating cash flow vs free cash flow from a definition into a habit. Keep it to one page so you and your leadership team review the same numbers every month.
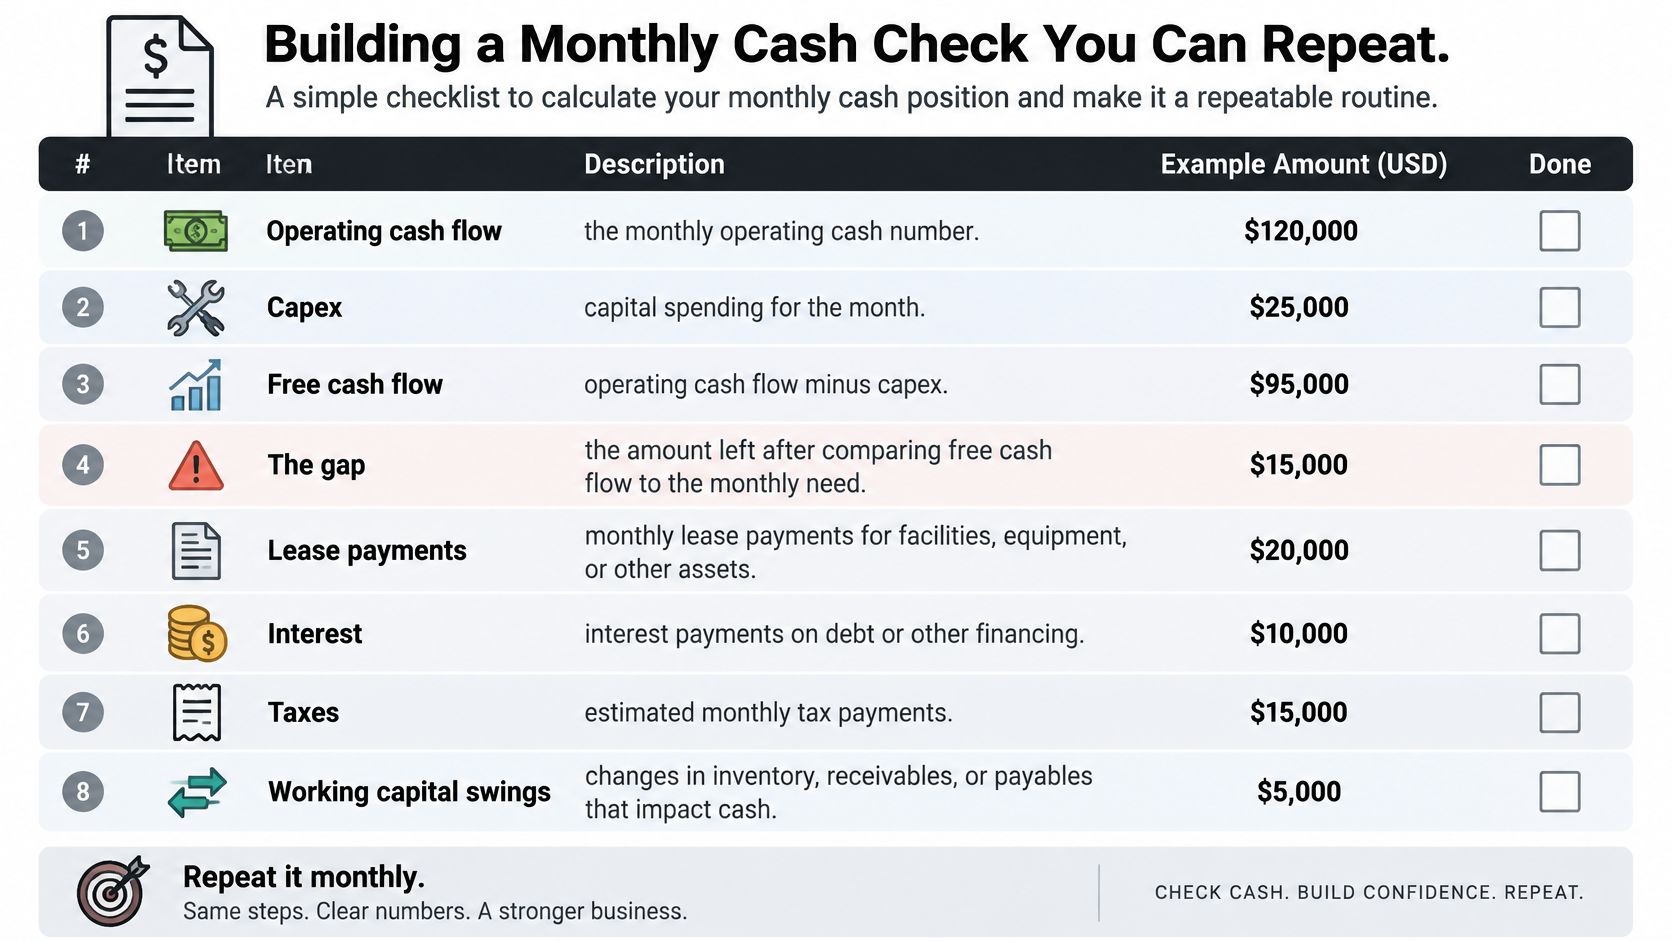
What Goes on the One Page
Start with operating cash flow, capex, free cash flow, and the gap. Below that, subtract lease principal, acquisition payments, mandatory debt amortization, and planned distributions. The bottom line is owner-available cash.
Add a 13-week rolling forecast beside it. Our Cash Flow Forecasting provides rolling cash flow forecasts that account for collections, retainage, payroll, equipment purchases, and project timing. Those drivers explain why a healthy month can still contain a bad week. An equipment payment due in week six can create a gap that a monthly statement averages away.
Good cash flow management builds systems that predict cash gaps before they happen and optimizes the timing of receivables, payables, and capital expenditures. If you want a starting template, use our guide to building a cash flow forecasting Excel template and pair it with daily cash flow controls so the weekly inputs stay current between monthly reviews.
Your Monthly Checklist
- Confirm the definition: Use the same free cash flow definition every month so comparisons mean something.
- Reconcile capex to the statement: Tie equipment, vehicle, and software purchases to the investing section.
- Refresh the forecast weekly: Update collections, payroll, and project timing as facts change.
- Match the gap to named projects: Every large reinvestment amount should point to a specific asset or job.
- Set a minimum cash reserve: Decide the floor you won't cross for distributions or optional spending.
Write the definitions directly on the sheet. A new controller, lender, or partner should be able to read the page and know exactly what you subtracted and why.
Using the Gap for Profitability and an Exit
Margin can look healthy while cash doesn't. A company can produce $1.0 million of operating cash flow and keep only $700,000 of free cash flow after equipment and software. That gap changes both your profit decisions and what a buyer will pay.
Run three checks:
- Cash conversion: Compare twelve months of operating cash flow with operating profit. Record how much profit remains after receivables, payables, and inventory absorb cash.
- Reinvestment load: Divide the operating cash flow minus free cash flow gap by operating cash flow. A load near the public-company range needs a named project behind it, not an automatic warning or an automatic pass.
- Exit quality: Test whether free cash flow holds after a normalized replacement reserve. Recurring equipment replacement, capitalized software, and customer-funded working capital all reduce transferable cash.
Buyers underwrite maintainable cash after required reinvestment. They don't pay full value for operating cash flow that depends on deferred replacement.
Before a profitability review or sale process, put trailing operating cash flow, basic free cash flow, the maintenance reserve, and owner-available cash on one page. That page also clarifies what value drivers are in practical cash terms, because it shows which improvements create cash a buyer can keep.
Confirm Your Owner-Available Cash Before You Decide
This week, pull the last twelve months of cash flow statements. For each month, calculate net cash from operating activities, basic free cash flow, and owner-available cash after lease principal, acquisition payments, mandatory debt amortization, and planned distributions.
Flag your largest gap. If operating cash flow is positive but free cash flow is thin, treat the shortfall as required reinvestment before you approve debt paydown, hiring, or a distribution. A business can generate cash from operations and still have none left after capex.
Bring your one-page check and 13-week forecast to a 60-minute CFO Strategy Session with AmbitionCFO. The session covers cash flow, profitability, financial systems, and growth, and it is not a sales presentation. For context, work with a construction client with $18M revenue improved gross margin by 3.1%, reduced WIP delays, and improved cash flow by $640K.
Leave with one clear decision. Fund a named project, hold the distribution, or fix the working-capital swing that's eating your cash.
If your operating cash flow and free cash flow tell different stories, AmbitionCFO can help you reconcile them into an owner-available cash number, a 13-week forecast, and a maintenance reserve you can trust for hiring, equipment, and distribution decisions. Visit AmbitionCFO to book a CFO Strategy Session and test your next major decision against real spendable cash before you commit.