

Payroll is due, a supplier wants payment, and your biggest customer still hasn't paid. Sales look healthy, but you're asking a more urgent question: Do we have enough cash to keep operating and accept the next opportunity?
Understanding working capital for business starts with that question, not a target ratio. You need to know where money is committed, when it will return, and whether the work you're funding will earn enough to justify the wait.
Table of Contents
- What Working Capital Is and How to Calculate It
- Key Working Capital Metrics and Healthy Benchmarks
- How the Cash Conversion Cycle Shows Where Cash Gets Stuck
- Why Growth Drains Cash Even When Profit Looks Strong
- Working Capital Patterns in Construction, Distribution and Services
- How to Build a 13-Week Cash Forecast
- Financing Options for a Working Capital Gap
- Build Your Cash Forecast Before Your Next Big Decision
What Working Capital Is and How to Calculate It
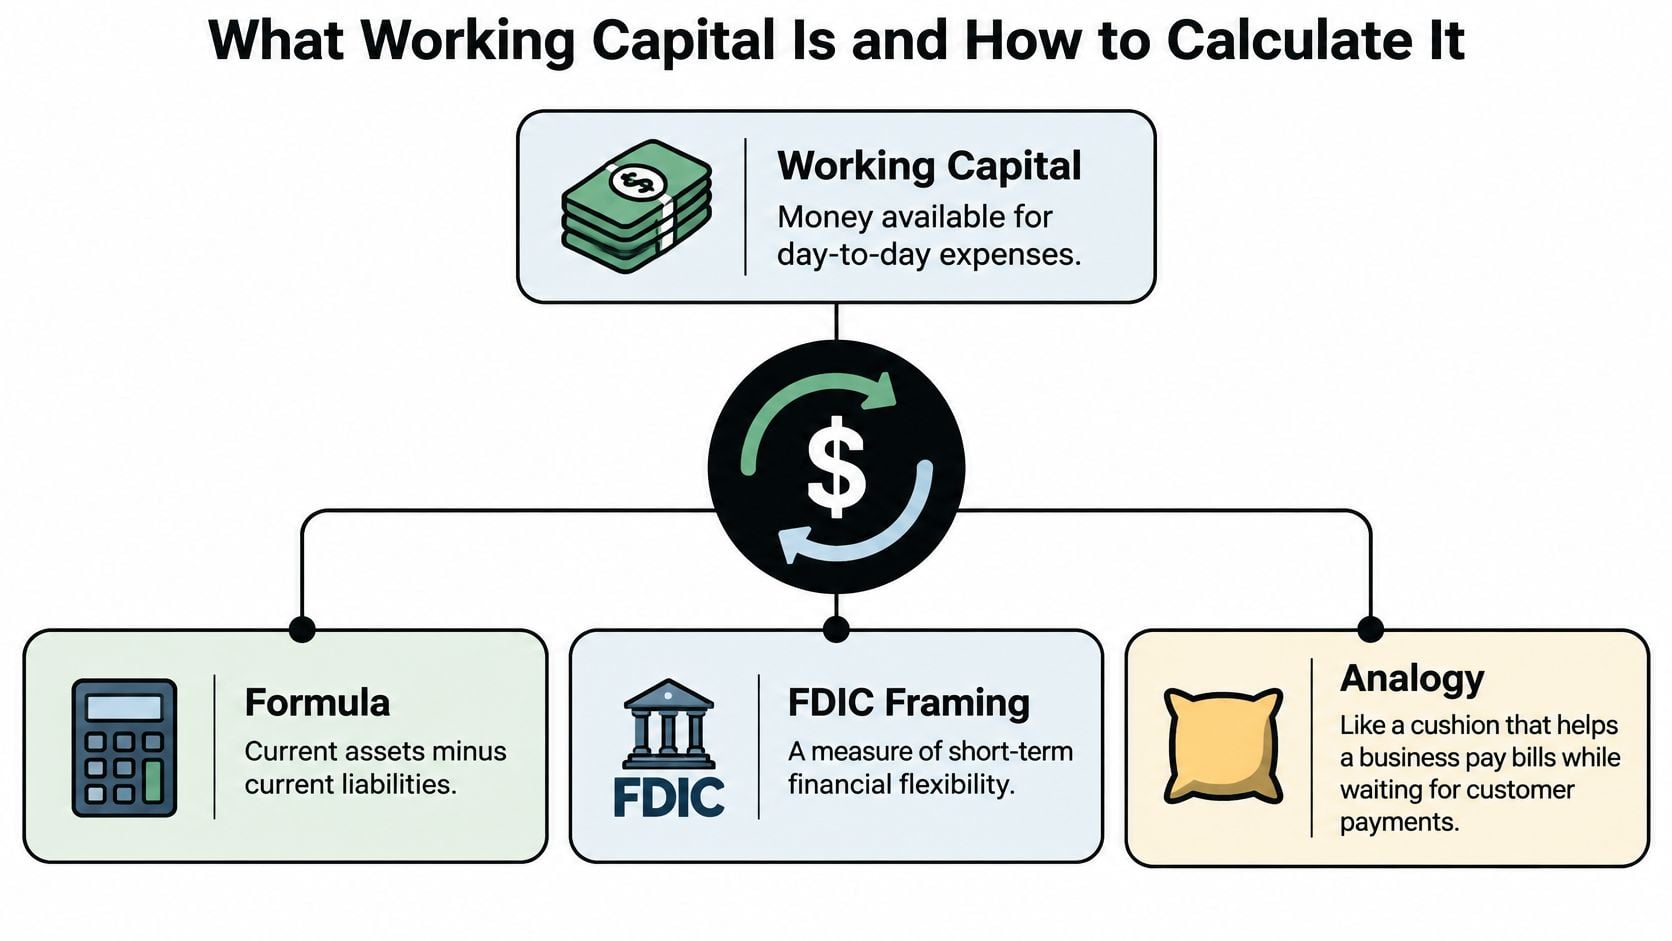
Working capital is the money available for day-to-day expenses, calculated as current assets minus current liabilities. Think of it as a cushion that helps pay payroll and suppliers while customer payments are still on their way. It's a measure of short-term flexibility, not the balance in your bank account.
Calculate your month-end position
- Pull your latest balance sheet. Use a completed month-end so assets and liabilities reflect the same date.
- Add current assets. Include cash, accounts receivable, inventory, and prepaid expenses, while remembering that only cash is immediately spendable.
- Add current liabilities. Include accounts payable, accrued payroll, taxes due, and the current portion of loans.
- Subtract liabilities from assets. Label the result positive, zero, or negative so your team can distinguish a cushion from a shortfall.
For a hypothetical business, $1.2 million of current assets minus $800,000 of current liabilities leaves $400,000 of working capital. That doesn't mean the business has that amount available to spend. Some assets may be unpaid invoices, unsold products, or expenses already paid in advance.
The diagram separates the calculation from its practical purpose.
Add an operating view
Terminology can be confusing because businesses use different definitions of net working capital. For its operating metric, SAP's Working Capital Insights documentation uses receivables + inventory + cash − payables. That narrower calculation helps managers isolate operating balances, but it doesn't replace the complete balance-sheet calculation.
Build a monthly spreadsheet showing changes in each component separately. Before trusting its cash column, use a process such as bank statement reconciliation for finance teams to match recorded transactions with bank activity and resolve differences.
A profitable business can still struggle because it records revenue before customers pay. Inventory may also remain unsold while supplier invoices become due.
Quick check: Positive working capital with a steadily falling bank balance calls for an investigation into timing, asset quality, and other cash uses. A positive total alone isn't proof of available cash.
Key Working Capital Metrics and Healthy Benchmarks
| Metric | Formula | Typical reference | Warning sign |
|---|---|---|---|
| Working capital | Current assets minus current liabilities | Positive, with a planning cushion of one to three months of operating costs | Negative balance can indicate bills arrive before cash |
| Current ratio | Current assets divided by current liabilities | Above 1.0, with room for collection uncertainty | Below 1.0 means short-term liabilities exceed short-term assets |
| Quick ratio | (Cash plus receivables) divided by current liabilities | Above 1.0 | Paying bills requires selling inventory |
| DSO, days sales outstanding | (Receivables divided by revenue) times days in period | Close to agreed terms; net 30 accounts may be reviewed against a 30-to-45-day planning band | Customers pay later than agreed |
| DIO, days inventory outstanding | (Inventory divided by cost of goods sold) times days in period | A 30-to-60-day distributor planning band, adjusted for replenishment needs | Slow-moving stock ties up cash |
| DPO, days payables outstanding | (Payables divided by cost of goods sold) times days in period | Near supplier terms, such as 30 to 45 days where agreed | Paying unnecessarily early drains cash |
| Cash conversion cycle | DSO plus DIO minus DPO | Shorter without disrupting operations | Cash remains committed longer |
Treat these reference ranges as planning guides, not verified industry averages. A contractor, distributor, and law firm have different operating requirements. Your payment agreements, replenishment needs, and historical results matter more than a generic target.
Read the measures in order
The current ratio compares all current assets with current liabilities, making it a quick coverage test. The quick ratio removes inventory and prepaid expenses to focus on cash and receivables, though overdue receivables can still make coverage look stronger than it is.
DSO translates unpaid sales into days. DIO translates stock into days of product cost, while DPO measures the supplier-payment interval using cost of goods sold as a practical proxy for purchases. Use consistent periods and average balances where available, especially when sales are seasonal.
The cash conversion cycle combines the operating day counts. For a deeper inventory diagnosis, use the inventory turnover ratio guide alongside product-level stock reports rather than judging all products against one target.
Turn measurement into action
Compare results with your own last 12 months and actual contractual terms. As a management rule, review monthly and investigate a measure that worsens for two consecutive months.
Start with the last three month-end balance sheets, matching income statements, and one spreadsheet. Calculate every measure, record the reason for each change, and assign corrective action rather than coloring unfavorable cells red.
How the Cash Conversion Cycle Shows Where Cash Gets Stuck
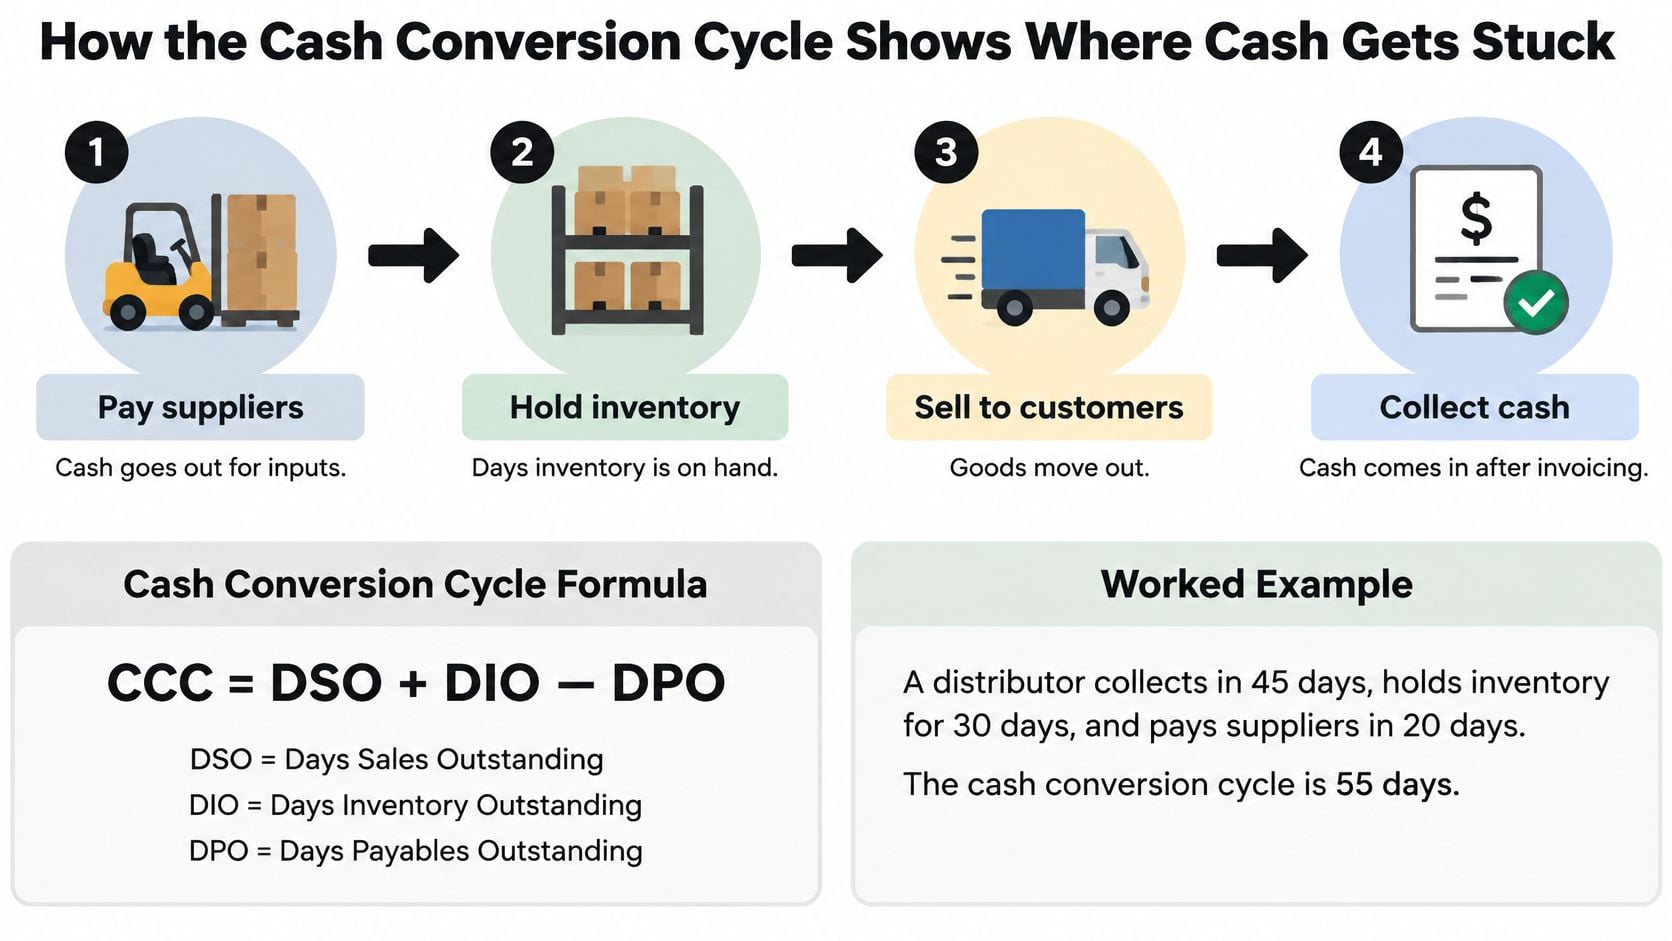
Say a distributor collects customer invoices in 45 days, holds inventory for 60 days, and pays suppliers in 30 days. Its cash conversion cycle is 75 days, calculated as 45 + 60 − 30. This worked example applies the operating-cash framework in the FDIC's financial management guide.
The cash conversion cycle, or CCC, estimates the interval between paying for operating inputs and collecting customer cash:
CCC = DSO + DIO − DPO
For this distributor, management must support a substantial interval between supplier payment and customer collection. The number describes an average operating cycle, not the exact funding period for every product.
Translate collection days into cash
Assume the example distributor averages $40,000 in daily sales. The following outcomes are calculated by multiplying the reduction in collection days by that daily sales amount.
| DSO change | Days released | Cash released at $40,000 daily sales |
|---|---|---|
| 45 to 40 days | 5 | $200,000 |
| 45 to 35 days | 10 | $400,000 |
| 45 to 30 days | 15 | $600,000 |
Collecting sooner creates a one-time release of cash from receivables, assuming sales remain steady. It doesn't create additional profit, and you shouldn't count the release as a recurring monthly benefit.
The visual shows the sequence from purchasing inputs to collecting customer payments.
Choose the lever you can actually control
- Collect sooner. Send accurate invoices as soon as billing conditions are met. Include purchase-order references, approval records, and delivery evidence so customers can process them without clarification.
- Hold appropriate stock. Separate dependable sellers from slow-moving products. Reduce unnecessary replenishment without creating shortages that prevent delivery.
- Pay on agreed terms. Stop paying early by habit, but negotiate extensions rather than paying late. Damaged supplier relationships can threaten supply and future credit.
The working capital cycle guide can help connect these actions to purchasing, billing, and payment responsibilities.
Cash released from operations is funding capacity, not profit. Keep the distinction clear when deciding whether you can afford a recurring expense.
Each month, compare the components with budget and the prior period. Give the largest unfavorable component one named owner, a specific action, and a review date. A collections problem needs different work from excess inventory, even when both produce the same cash shortage.
Why Growth Drains Cash Even When Profit Looks Strong
Consider a hypothetical quarter in which sales rise 20% but the bank balance falls $300,000. Your income statement may look stronger because you've earned revenue, while your team has already paid for delivery and customers haven't paid you.
Start the review with customer and contract detail, not just the company total.

Recent U.S. small-business findings reported by The Wichita Eagle found that 56% had outstanding invoices and 47% reported at least some invoices more than 30 days overdue. Businesses with more overdue invoices were also more likely to report cash-flow problems and rely on borrowing.
Separate delayed cash from bad economics
- Map conversion by customer, job, or contract. Record when you pay labor, buy materials, mobilize equipment, invoice, and expect collection. Identify both the maximum funding requirement and how long it lasts.
- Calculate the true economic contribution. Start with expected revenue and subtract labor, materials, mobilization, delivery expenses, financing costs, and expected collection losses. If you start with gross profit instead, subtract only costs not already included, or you'll double-count them.
- Test the actual collection period. Check whether the contribution remains positive after financing the real wait. Track retainage separately as delayed cash, not automatically as an expense or loss.
If the economics remain attractive, you may have a temporary timing gap that better billing terms and suitable financing can address. If delivery and financing costs consume the contribution, taking more similar work makes the underlying problem worse.
At AmbitionCFO, we analyze labor costs, utilization, realization rates, project delivery expenses, partner involvement, and overhead allocation to determine client profitability. Utilization measures how much available staff time goes into productive client work; realization measures how much recorded work ultimately becomes billed or collected revenue.
This video offers another format for considering the financial analysis.
Set acceptance rules before signing
Set a minimum deposit, approved billing milestones, a retainage cap, and a limit on revenue concentrated in one customer. Choose those limits from your funding capacity and customer risk, not arbitrary industry rules.
A high current ratio doesn't prove that expansion is safe when assets include disputed invoices or difficult-to-sell stock. Use the guide to hidden costs of rapid growth to assess commitments beyond headline revenue.
Before accepting work, put every major cash-out date beside the corresponding expected cash-in date.
Working Capital Patterns in Construction, Distribution and Services
| Industry | Main cash pressure | Main lever | Reference point |
|---|---|---|---|
| Construction | Labor and materials paid before progress payments arrive | Milestone billing and separate retainage tracking | Late payments can delay project delivery |
| Wholesale distribution | Inventory bought before sales are collected | Inventory days by product line and credit limits by customer | Inventory and receivables both tie up cash |
| Professional services | Staff payroll paid while billing lags the work | Billing cadence, deposits for new clients, and aging reviews | U.K. business services averaged 38.1 days of payment delay in a 2025 survey summarized in the EU Council working document |
Construction
A 2025 construction-payment report, covered by Construction Business Owner, found that 76% of contractors said late payments caused affected projects to lose at least one week, while nearly 40% reported delays of three weeks or more. Payment administration can therefore affect the work schedule as well as the bank balance.
In a worked scenario, paying $250,000 for payroll and materials over four weeks, with the next collection expected in 45 days, creates a temporary $250,000 funding gap. Bill promptly at approved milestones and document change orders before additional work starts. Track retainage, the portion withheld until specified conditions are met, separately from readily collectible invoices.
For a construction client with $18M revenue, we improved gross margin by 3.1%, reduced work-in-progress delays, and improved cash flow by $640K. Work in progress means work underway that needs accurate cost and billing tracking.
Wholesale distribution
A distributor can collect customers promptly and still struggle if purchasing staff keep replenishing products that barely move. Review stock by product line, then connect customer credit limits to actual payment behavior.
For example, a slow-selling product supplied to a slow-paying account creates two separate commitments of cash. Adjust order quantities and account limits together rather than asking collections staff to solve a purchasing problem. For a distribution client, we reduced inventory, improved EBITDA, earnings before interest, taxes, depreciation, and amortization, and increased borrowing capacity.
Professional services
A service firm may have little physical inventory but substantial unbilled work. Staff receive pay while project managers wait for approval, complete timesheets, or postpone invoicing.
Set a billing cadence, require deposits from new clients where appropriate, and review receivables aging every two weeks as an internal routine. Review scope changes before continuing work that the client hasn't approved.
Run three practical checks this week: aging by customer, retainage by project or stock by product line, and billing lag by project. Each check should identify a responsible person and the next action.
How to Build a 13-Week Cash Forecast
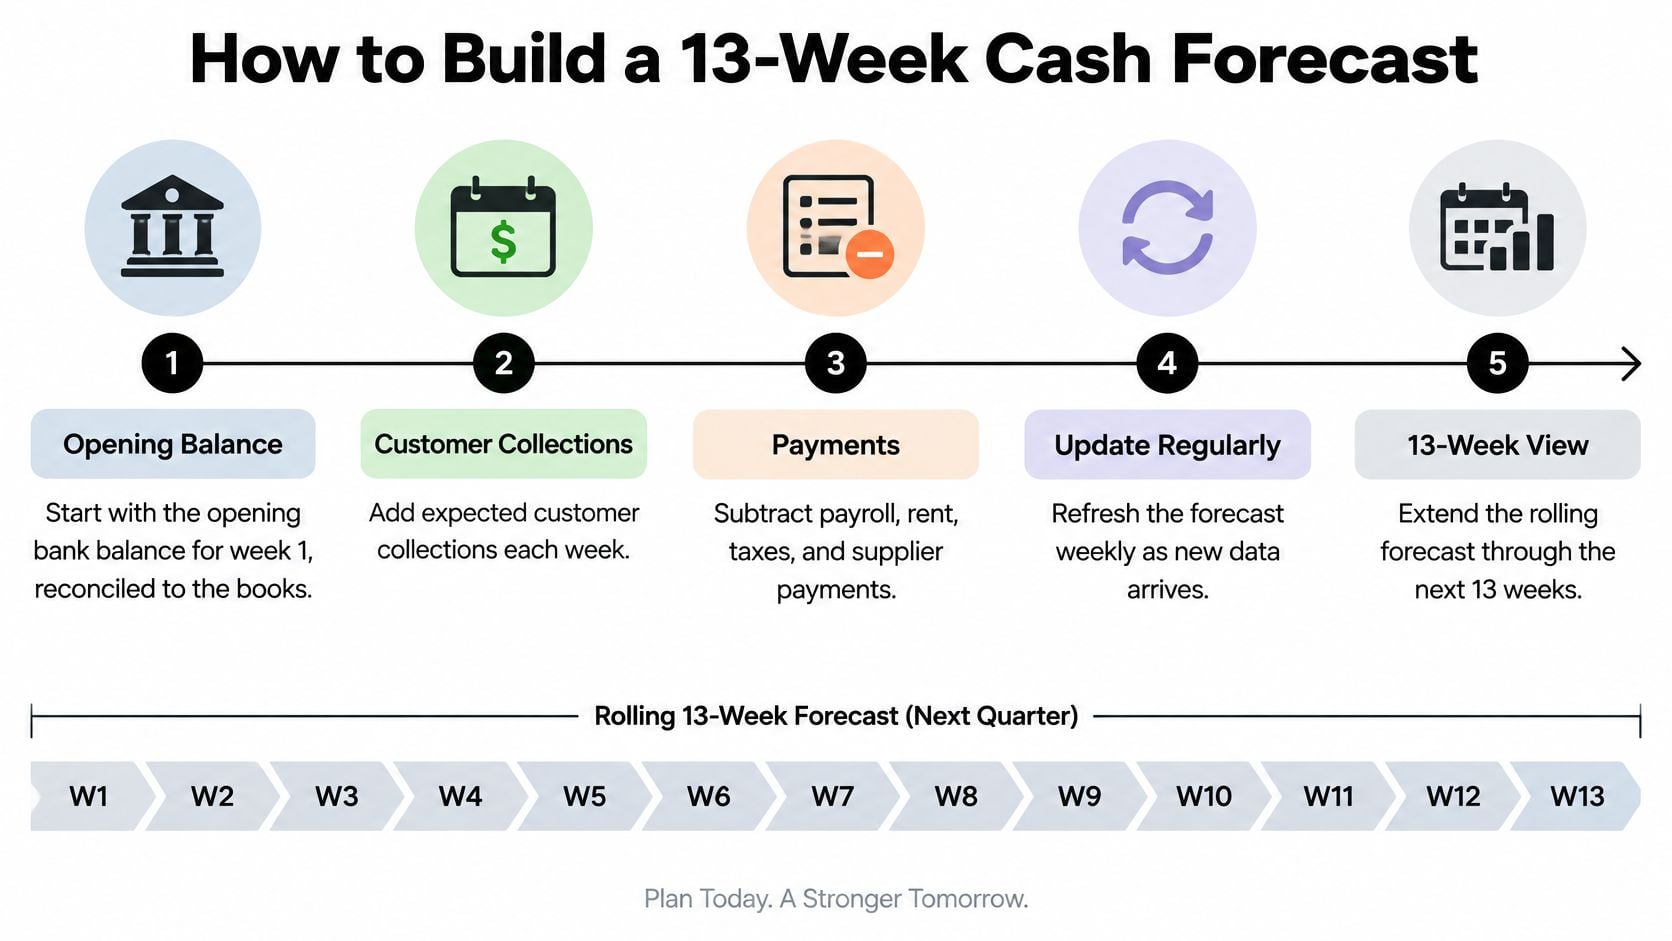
A 13-week cash forecast is a rolling weekly view of cash for the next quarter, updated as new information arrives. Unlike a profit forecast, it records when money enters or leaves the bank.
The need is tangible in project businesses: a 2026 survey of 492 construction finance and operations professionals, reported by Contractor, found that 92% of subcontractors had paid payroll from their own funds while awaiting customer payment during the prior year. The same survey found 43% waited more than 90 days for final payment and retainage.
Build the weekly worksheet
- Establish opening cash. Start week 1 with the bank balance reconciled to the books, accounting for outstanding payments. Exclude restricted funds from cash available for operations.
- Schedule committed outflows. Enter payroll, rent, debt payments, tax deposits, and supplier bills in their payment weeks. Don't spread a large payment evenly across the quarter.
- Forecast collections by customer. Use expected collection dates rather than invoice dates. Ask account owners to confirm large receipts instead of assuming every open invoice will arrive on time.
- Run collection scenarios. Model hypothetical 30-, 60-, and 90-day payment cases, then tailor them to actual customer history. Keep disputed amounts and retainage separate so uncertain receipts don't conceal a shortfall.
- Add operational commitments. Include material purchases, equipment spending, planned hires, and project mobilization. Distinguish approved spending from proposals you can still postpone.
- Calculate ending cash. Add receipts to opening cash and subtract payments, then carry the result into the following week. Flag balances below a chosen buffer, such as an illustrative two weeks of payroll.
- Refresh every Friday. Replace estimates with actual transactions, explain meaningful differences, and add a new week. Record whether a variance reflects timing or a lasting change.
The diagram summarizes the rolling workflow.
Use checkpoints to support decisions
| Checkpoint | Review | Decision supported |
|---|---|---|
| Week 1 | Reconcile opening cash and confirm major receipts | Is the starting position reliable? |
| Week 6 | Compare collections and spending with original assumptions | Should spending or collection actions change? |
| Week 13 | Roll forward and replace outdated assumptions | What commitments can the next quarter support? |
Use the 13-week cash flow guide to organize the model and its weekly review.
Keep a receipt schedule with invoice amount, approval date, due date, retainage, disputed amount, and expected collection week. That detail lets you test a specific decision: Can we make the planned hire or equipment purchase in week 8 without drawing on credit?
Financing Options for a Working Capital Gap
Once you've confirmed a gap is temporary, which funding option closes it at the lowest suitable cost? Compare the repayment structure with the receipts that will repay it, not just the speed of approval.
Borrowing is a routine liquidity tool: the Federal Reserve's review of 2023 small-employer financing reports that 53% regularly used or carried a balance on business loans, 34% regularly used lines of credit, and 56% regularly used business credit cards. It also reports that 37% applied for a loan, line of credit, or merchant cash advance during the preceding 12 months.
Match the product to the cash need
| Option | Best-fit use | Main caution |
|---|---|---|
| Revolving line of credit | Recurring or seasonal gaps repaid from collections | Confirm availability, borrowing conditions, fees, and renewal requirements |
| Term loan | A defined investment, such as equipment or a hiring initiative | Scheduled repayments can outlast or poorly match a brief payroll gap |
| Business credit card | Small purchases with a clear near-term repayment source | Interest and fees can make carried balances costly |
| Merchant cash advance | An option to evaluate when rapid access matters | Compare total repayment and effective annualized cost before signing |
With a revolving line, draw the forecasted shortfall rather than the full approved amount. Repay it when the expected collections arrive instead of allowing temporary borrowing to become permanent.
Calculate the cost before committing
For a hypothetical $250,000 draw held for 45 days at an illustrative 10% annual interest rate, simple interest is approximately:
$250,000 × 10% × 45 ÷ 365 = $3,082
That calculation excludes fees and assumes the balance stays outstanding throughout the period. An actual offer needs a full payment schedule, including charges and repayment frequency.
Borrowing rule: Match the repayment period to the gap and size the draw around the lowest forecast cash week, while preserving your minimum buffer.
If the need is permanent rather than temporary, review the broader equity-versus-debt decision instead of repeatedly refinancing operating losses.
Build Your Cash Forecast Before Your Next Big Decision
Start with the step you haven't completed, not another report showing the same problem. Over the next 14 days, turn the diagnosis into a decision your leadership team can use.
Give the work dates and owners
- Days 1 to 3. Identify the largest unfavorable component among your working capital measures. Assign one owner to investigate the underlying invoices, stock, or project balances and propose a corrective action.
- Days 4 to 7. Run the collection scenarios for your top five customers or projects, using their payment histories. Ask the account or project owner to challenge each expected receipt.
- Days 8 to 14. Check whether the lowest forecast cash week remains above your buffer before approving a hire, equipment purchase, or contract. Record which assumptions must hold and what you'll postpone if they don't.
Choose support that fits the decision
AmbitionCFO is a fractional CFO firm for founder-led businesses with $10M to $100M in annual revenue. We're probably not the right fit below approximately that size, for bookkeeping or tax preparation needs, or for owners who only want reports; we don't provide audit services.
At Engagement Kickoff, we connect with your existing systems, including QuickBooks, your CPA, and your operations team, then begin building the financial infrastructure needed for growth.
Bring your current balances, open invoices, supplier obligations, and proposed commitment to the review. The useful outcome isn't just an ending cash number. It's a clear decision about what you can fund, when you can fund it, and which risks need action first.
AmbitionCFO provides fractional CFO advisory and rolling cash forecasts that connect collections, payroll, retainage, and major spending decisions. Visit AmbitionCFO to arrange a review of your 13-week model before your next major commitment.