

A healthy inventory turnover ratio for many businesses is 5.00 to 10.00, but the right target depends heavily on your industry, product shelf life, demand volatility, and working-capital needs. A ratio of 8.00 means inventory is replenished roughly every 45.6 days, while 5.00 means about 73.0 days of inventory on hand. Allianz Trade's inventory turnover guidance provides the useful baseline, but a founder should never treat that range as a universal target.
The question you're really trying to answer is simpler and more practical: Is my inventory moving fast enough to support cash flow without creating stockouts, rushed purchases, or margin damage? A contractor holding steel for a long project has a different cash equation from a parts distributor replenishing fast-moving components. Your dashboard should tell you which problem you have, not merely produce a ratio that looks attractive.
Table of Contents
- Why the Answer Is Not One Number
- The Formula and a Worked Example
- Industry Benchmarks That Actually Matter
- High Versus Low Turnover and What It Means for Cash
- Common Measurement Pitfalls That Distort the Ratio
- Strategies to Improve Inventory Turnover
- Your Next Step Toward the Right Target
Why the Answer Is Not One Number
A ratio between 5.00 and 10.00 may suit many businesses, but it is a poor target without operating context. Retail often runs around 8 to 12 turns, manufacturing around 4 to 8, and automotive businesses around 2 to 5, as Allianz Trade explains why industry ranges vary.
Compare a contractor holding $1.2 million in steel inventory for 90 days with a parts distributor moving the same inventory value in 25 days. The balance sheet value matches, yet the cash impact differs sharply. The contractor may be protecting a long project schedule and difficult sourcing requirements. The distributor may have steady daily demand and short supplier lead times.
That operating model sets the useful target. Product shelf life, project duration, supplier reliability, demand volatility, SKU complexity, and borrowing capacity all affect how much inventory the business can carry.
Start with the operating model
A construction supply company may accept slower turnover when materials are expensive, project-specific, or difficult to replace quickly. A grocery operator needs faster movement because perishability turns excess stock into waste and margin loss. A professional services firm that keeps physical materials may fall between those models, depending on whether supplies support recurring client work or occasional projects.
Review the inventory aging report guidance from AmbitionCFO alongside the headline ratio. Two companies can report identical turnover while one holds mostly fresh inventory and the other carries obsolete stock hidden by a few fast-moving items.
A founder should set the target from the inventory profile, not from a generic benchmark. Break the balance into current, slow-moving, and obsolete stock, then connect each category to project needs, customer service, and cash.
CFO rule: Don't set a turnover target until you know how many days your inventory can sit before it creates a service, cash, or margin problem.
Use the ratio as a starting point, convert it into days on hand, compare it with direct peers, and check it against stockout history. The right target is the fastest movement your construction, distribution, or service operation can sustain without delaying work or forcing expensive emergency purchases.
The Formula and a Worked Example
The standard inventory turnover formula is:
Inventory turnover ratio = Cost of Goods Sold ÷ Average Inventory
COGS measures the cost of the products sold. Average inventory smooths the balance over the period:
Average Inventory = (Opening Inventory + Closing Inventory) ÷ 2
Use COGS rather than sales. Sales include your markup, while inventory is recorded at cost. Dividing sales by inventory can make movement appear stronger because pricing is higher. The AgentCentral turnover rate calculation guide offers another practical explanation of the calculation and its related days metric.
Worked example
Assume a construction supply business reports annual COGS of $800,000 and average inventory of $160,000.
$800,000 ÷ $160,000 = 5.0 turns
That business sells and replenishes its average inventory about five times during the year. To express the same result in days:
DIO = 365 ÷ Inventory Turnover
365 ÷ 5.0 = 73.0 days
Now assume the company keeps the same COGS but reduces average inventory to $100,000:
$800,000 ÷ $100,000 = 8.0 turns
The companion DIO becomes:
365 ÷ 8.0 = 45.6 days
The second scenario releases cash from stock, but only if customer service remains intact. Reducing inventory without checking supplier lead times, project requirements, and stockout frequency can create a better-looking ratio and a worse business.
| Metric | Scenario A, Higher Inventory | Scenario B, Leaner Inventory |
|---|---|---|
| Annual COGS | $800,000 | $800,000 |
| Average inventory | $160,000 | $100,000 |
| Inventory turnover | 5.0 turns | 8.0 turns |
| DIO | 73.0 days | 45.6 days |
| CFO interpretation | More cash tied up in stock | Less cash tied up, with availability risk to monitor |
Calculate the ratio from the same period, then convert it to DIO. The number you can discuss with a purchasing manager is usually days, not turns.
Tonight, pull your period COGS and opening and closing inventory, calculate average inventory, divide COGS by that average, and then divide 365 by the result.
Industry Benchmarks That Actually Matter
Industry comparisons are more useful than a generic target, but only when you compare businesses with similar products, customers, lead times, and fulfillment expectations. Published benchmark data from Onramp Funds shows the spread clearly. Grocery and supermarket businesses may operate around 12 to 16 turns, while furniture businesses may operate around 2 to 4.
The following ranges are practical starting points for management conversations, not automatic performance targets.
| Industry | Typical Ratio Range | What Drives the Range |
|---|---|---|
| Retail | 8 to 12 | Frequent replenishment and broad consumer demand |
| Grocery | 12 to 18 | Perishability and high purchase frequency |
| Apparel | 4 to 8 | Seasonal demand, trend risk, and assortment complexity |
| Automotive parts | 4 to 6 | Mix of fast-moving maintenance items and slower specialty parts |
| Manufacturing | 5 to 10 | Production schedules, component availability, and lead times |
| Construction supply and building materials | 4 to 6 | Project timing, bulky materials, and long or variable lead times |
| Wholesale distribution | 6 to 10 | Replenishment discipline, SKU velocity, and customer service demands |
| Professional services with physical materials | 6 to 12 | Recurring service needs balanced against irregular project demand |
Construction and building materials
Construction businesses shouldn't chase retail-like turns. A lower ratio can be rational when the company carries steel, specialty fittings, equipment, or project-specific materials that customers expect to be available. The better question is whether slow-moving stock is intentional and billable, or whether purchasing decisions have created unassigned inventory.
Distribution
Distributors need a more detailed view than a company-wide ratio. A fast-moving core line can conceal dead stock in specialty SKUs. Review turns by product family, customer segment, warehouse, and buyer. Netstock's inventory turnover discussion also connects turnover with DIO, which helps translate a distribution benchmark into a working-capital conversation.
Professional services with physical materials
A services business carrying parts, supplies, or equipment should separate stock required to deliver contracted work from discretionary inventory. A ratio that looks slow may be acceptable if the inventory protects client service and avoids urgent procurement. It's unacceptable if the balance consists of materials no active client needs.
Use direct peer groups rather than a cross-industry average. The Doczen performance benchmarking guide provides useful context for building comparisons that account for business model and operating conditions. You can also pair turnover with the broader KPI categories discussed in the financial metrics every business owner should track.
High Versus Low Turnover and What It Means for Cash
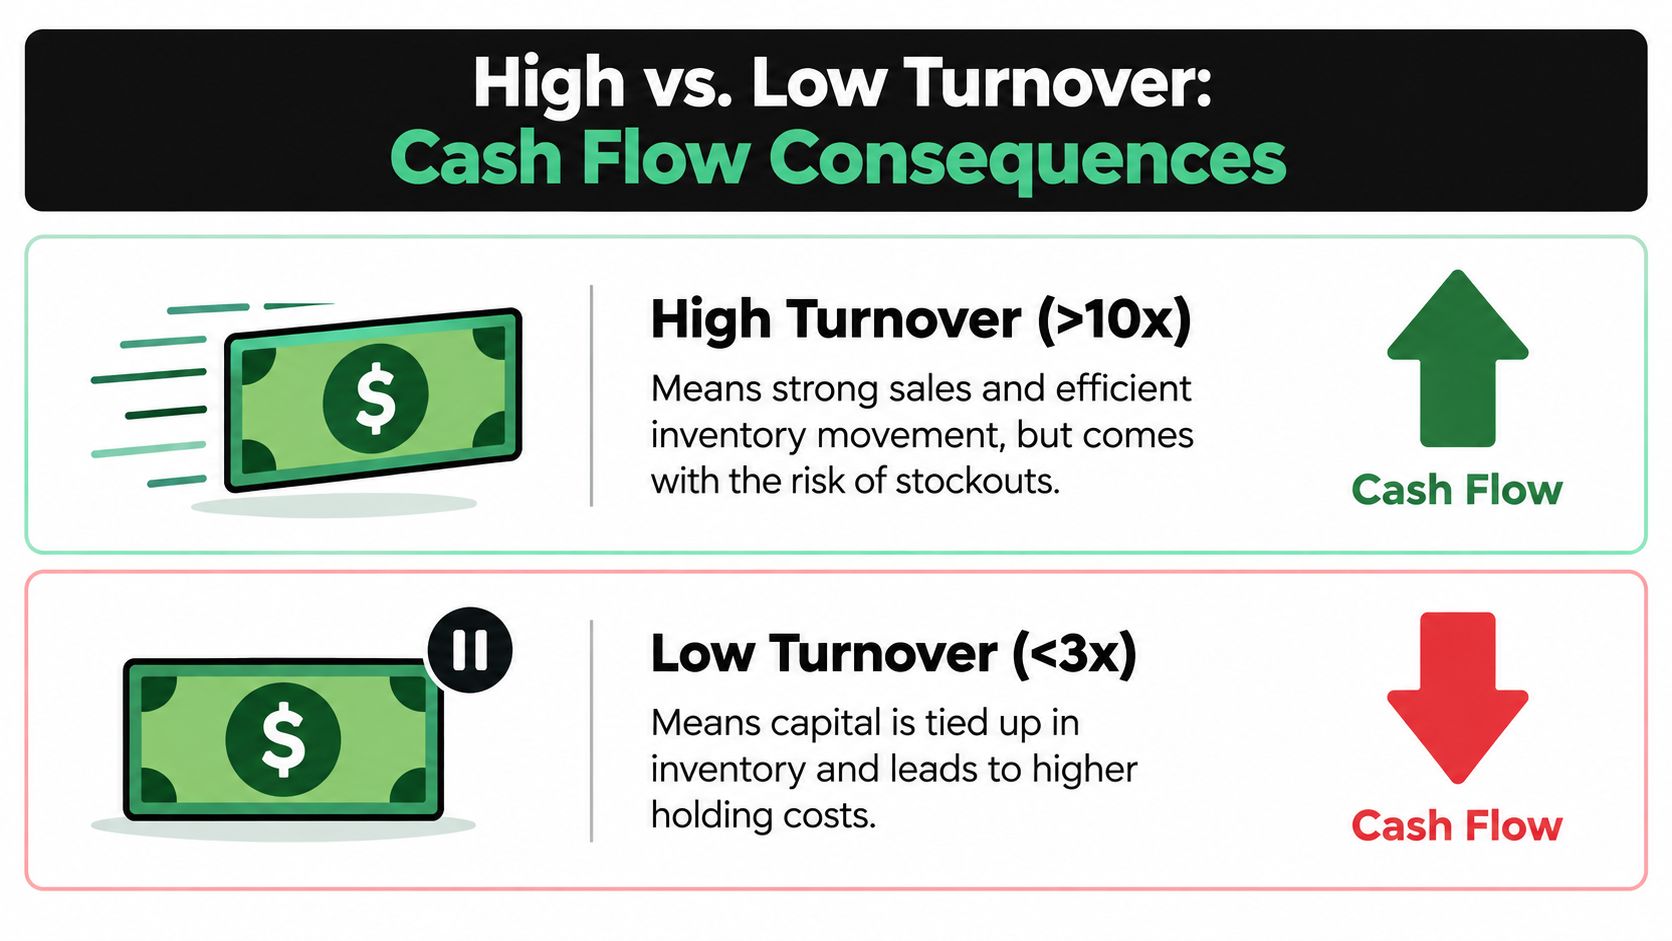
High turnover usually means inventory moves quickly and less cash sits on the shelf. That's attractive, but a ratio well above peer benchmarks, often 10x or more, can indicate that purchasing has become too lean. The business may be selling successfully while failing to carry enough stock to absorb supplier delays or demand changes.
Verified industry guidance links higher turnover with lower capital tied up in inventory and lower exposure to obsolescence, while also warning that excessive velocity can increase stockout risk. Those effects are operational, not automatic guarantees. You should measure them against service levels, missed orders, expedite activity, and gross margin.
Translate turns into lender language
Suppose two distributors each generate $10 million in revenue and have identical margins. One turns inventory at 8x, while the other turns it at 4x. Using DIO = 365 ÷ turnover, the first carries roughly 45.6 days of inventory and the second carries about 91.3 days.
The slower distributor has roughly 45.6 additional inventory days embedded in its cash cycle. That difference affects the borrowing base, revolver usage, covenant discussions, and the owner's ability to fund payroll, equipment, or growth. The revenue and margin may look identical on the income statement, but the balance sheet tells a different story.
A low ratio, especially one materially below peers, often means capital is trapped in slow-moving SKUs. It can also bring higher storage, insurance, handling, damage, and obsolescence exposure. When obsolete inventory requires a write-down, the charge reduces reported inventory and can hit gross margin directly.
The answer isn't “maximize turns.” It's to find the highest sustainable velocity that preserves availability and margin. Working capital optimization guidance from AmbitionCFO can help connect inventory decisions to receivables, payables, and the wider cash conversion cycle.
A turnover improvement matters only when it releases cash without creating a larger service failure elsewhere.
Common Measurement Pitfalls That Distort the Ratio
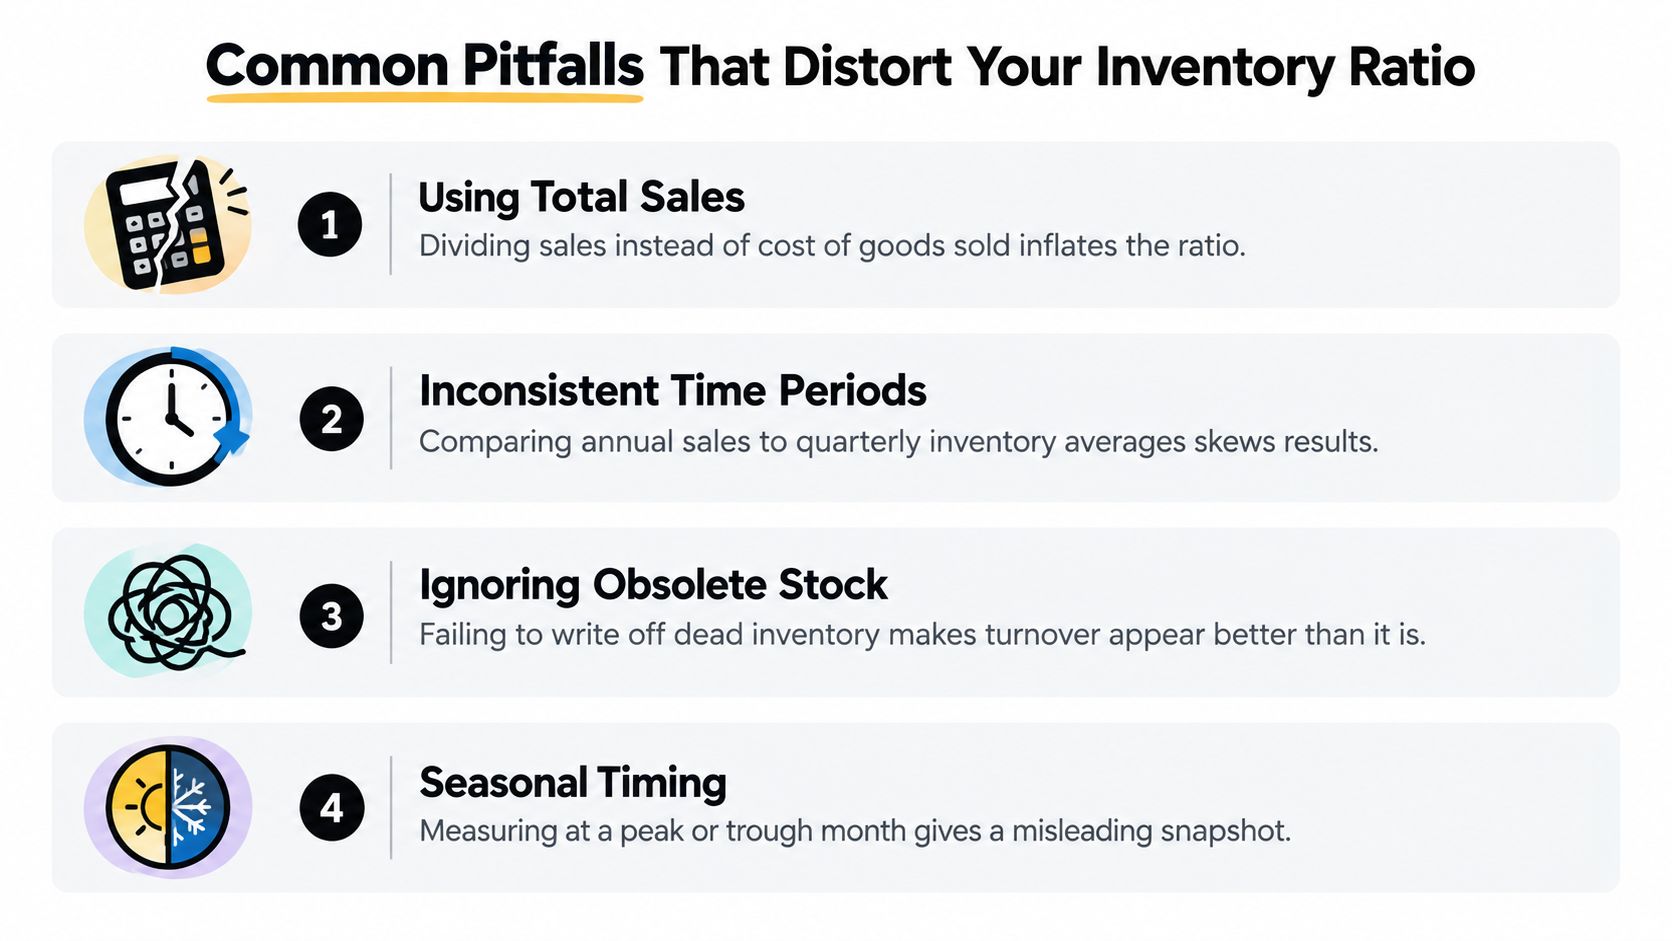
Many owners don't have an inventory problem first. They have a measurement problem. A flawed numerator, an unrepresentative inventory balance, or mismatched periods can make the dashboard look healthier than the operation really is.
Four checks to run
Using total sales: Dividing sales by average inventory can inflate the ratio because sales include markup. The result isn't comparable with a COGS-based ratio and can make movement look stronger than it is.
Using period-end inventory: A single closing balance can mask seasonal swings. If the company builds stock before a busy period, month-end inventory may be unusually high. If it measures immediately after a shipment surge, the balance may be unusually low.
Mixing fiscal periods: Annual COGS against month-end inventory creates a mismatched calculation. Use COGS and inventory balances that cover the same period and accounting basis.
Mishandling consignment or vendor-managed inventory: Decide whether the stock belongs on your balance sheet and apply the same treatment in the turnover calculation. Inconsistent treatment distorts peer comparisons.
Five-minute diagnostic
Pull the report and ask:
- Is the numerator COGS, not sales?
- Do COGS and inventory cover the same period?
- Did you use average inventory rather than one balance?
- Are obsolete, damaged, consigned, or vendor-managed items treated consistently?
- Does the result match what buyers and warehouse managers observe?
If the calculation fails any of these checks, fix the measurement before changing purchasing policy. AmbitionCFO's guidance on converting accrual to cash is relevant when you're reconciling accounting reports with the cash impact of inventory decisions.
Strategies to Improve Inventory Turnover
Improvement starts with the decisions that release cash fastest. Set the target by operating reality: construction businesses must protect project availability, distributors must control assortment, and professional services firms should avoid tying cash up in materials that do not support current work. Then change purchasing rules and review performance on a fixed cadence.
Begin with demand and assortment
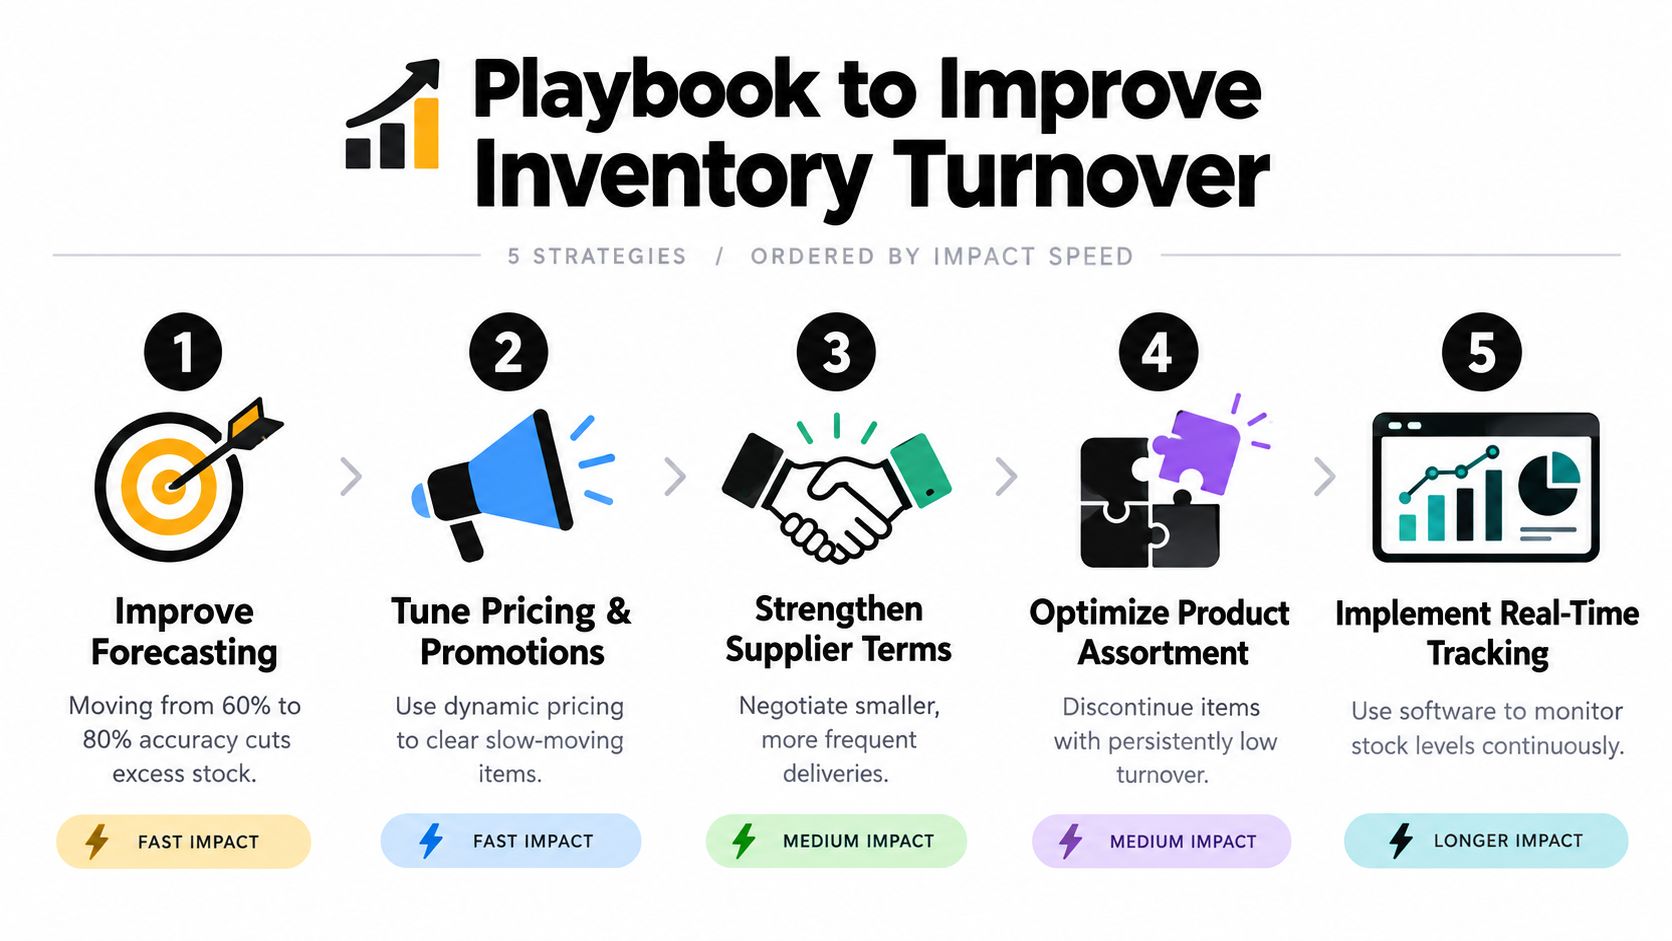
Forecast accuracy is the first operating lever. Improve the forecast by SKU family, customer type, and project stage, then compare expected demand with actual demand every cycle. Do not treat a better forecast as an automatic increase in turns. Test whether it reduces excess purchases without increasing stockouts.
Isolate the slowest product group next. Review items with little recent demand and separate unnecessary stock from parts that protect service levels. Return eligible products, transfer them, bundle them, or price them to clear. A slow-moving construction part may still prevent a costly project delay, while a distributor's duplicate assortment may trap cash.
Change the supply and pricing mechanics
Ask suppliers for smaller, more frequent deliveries when freight and handling costs support the arrangement. Vendor-managed inventory, blanket purchase orders, and consignment can reduce the cash committed before demand is confirmed. Review minimum order quantities, lead-time variability, and freight economics together.
Use pricing and promotions with a clear aging rule. Bundle aged stock with a high-velocity item, set markdown thresholds by days on hand, and assign an owner to each exception. Protecting the original margin is not the goal if the inventory will otherwise remain unsold.
Tighten replenishment discipline
Reorder points must reflect actual demand and lead-time variability. Recalibrate safety stock when supplier performance changes, and document the assumptions behind each major SKU family. The reorder point formula guide from AmbitionCFO offers a practical starting point.
Track these measures weekly:
- Turnover: COGS divided by average inventory.
- DIO: 365 divided by turnover.
- Aged inventory: Value and percentage by age bucket.
- Stockouts: Count by product family and customer impact.
- Expedites: Freight and purchasing costs caused by insufficient stock.
For broader inventory operating ideas, the 2026 Shopify inventory guide from Arlo Inc. provides a complementary reference. Hold a weekly sales and operations review with purchasing, sales, operations, and finance. AmbitionCFO can incorporate inventory turns into KPI dashboards, cash flow models, and profitability analysis for founder-led companies.
Your Next Step Toward the Right Target
The right inventory turnover ratio is peer-relative and cash-cycle-aligned. The broad 5 to 10 range is a reasonable starting point for many companies, but sector economics matter more. Construction supply leaders may run closer to 6 to 8, professional services businesses with physical materials may sit near 12 to 16, and distributors of slow-moving parts may operate at 4 without an automatic red flag.
Those sector examples should prompt investigation, not blind target-setting. Your target is the ratio that releases the most working capital per dollar of COGS while avoiding stockouts, supplier expedite fees, project delays, and margin-killing markdowns.
Pull trailing-twelve-month COGS and average inventory today. Calculate turnover and DIO, then plot the result against two public peers or closely comparable operating businesses. Set a 90-day improvement goal tied to cash released, aged inventory reduced, or stockout risk controlled, not to a vanity ratio.
Book a 30-minute working capital review if your current ratio sits outside the peer band by more than 20%.
AmbitionCFO helps founder-led construction, distribution, and professional services businesses connect inventory turns to cash flow, forecasting, KPI dashboards, and profitability decisions. Visit AmbitionCFO to discuss a working capital review and build a practical plan around the numbers on your dashboard.