

You're staring at a warehouse report, and the ugly part isn't the item count. It's the cash sitting in stock that's already old enough to be a problem. If you run a $30M distribution business, that report isn't telling you what's on the shelf, it's telling you where working capital is trapped and where you need to make a decision fast.
Table of Contents
- Why Your Inventory Aging Report Is a Cash Flow Tool
- How an Inventory Aging Report Is Structured and Calculated
- Reading the Buckets and KPIs That Matter
- Industry-Specific Aging Thresholds and Starting Dates
- Action Rules for Each Aging Bucket
- Templates, Tools, and Reporting Cadence
- When to Bring in Fractional CFO Support
Why Your Inventory Aging Report Is a Cash Flow Tool
A founder once looked at a month-end inventory aging report and realized the problem wasn't shrink, it was silence. No one had challenged the stock sitting beyond 180 days, so the business kept buying more of what wasn't moving. That's the trap, aged inventory doesn't just take space, it locks up cash that could pay vendors, fund payroll, or reduce borrowing.
An inventory aging report is a time-bucketed valuation model. It groups on-hand stock by how long each unit has been in inventory, typically in 0–30, 31–60, 61–90, 90+ days, and often extended buckets like 91–180 and 180+ days for a sharper view of slow movers, liquidation risk, and balance-sheet exposure. The useful version of the report includes SKU, location, receipt date, quantity, unit cost, and extended value, because item counts alone don't tell finance how much capital is at risk. That's why I treat it as a working-capital tool, not a warehouse list.
Practical rule: If you can't connect the report to dollar exposure, you're not managing inventory aging, you're just counting old boxes.
The cash-flow angle is direct. Older stock ties up liquidity, increases the odds of markdowns, and weakens margin when product values slip. If you want the cost side framed properly, pair this report with the inventory carrying cost formula so every aged bucket has a real economic cost attached. That's how management stops treating age as a storage issue and starts treating it as a cash decision.
For context on why inventory and financing pressure often show up together, it's worth reading Capital Express's explain MCA inventory peak piece, because the same cash squeeze shows up when stock builds faster than sales. The lesson is simple, when inventory ages, your balance sheet gets heavier and your flexibility gets worse.
How an Inventory Aging Report Is Structured and Calculated
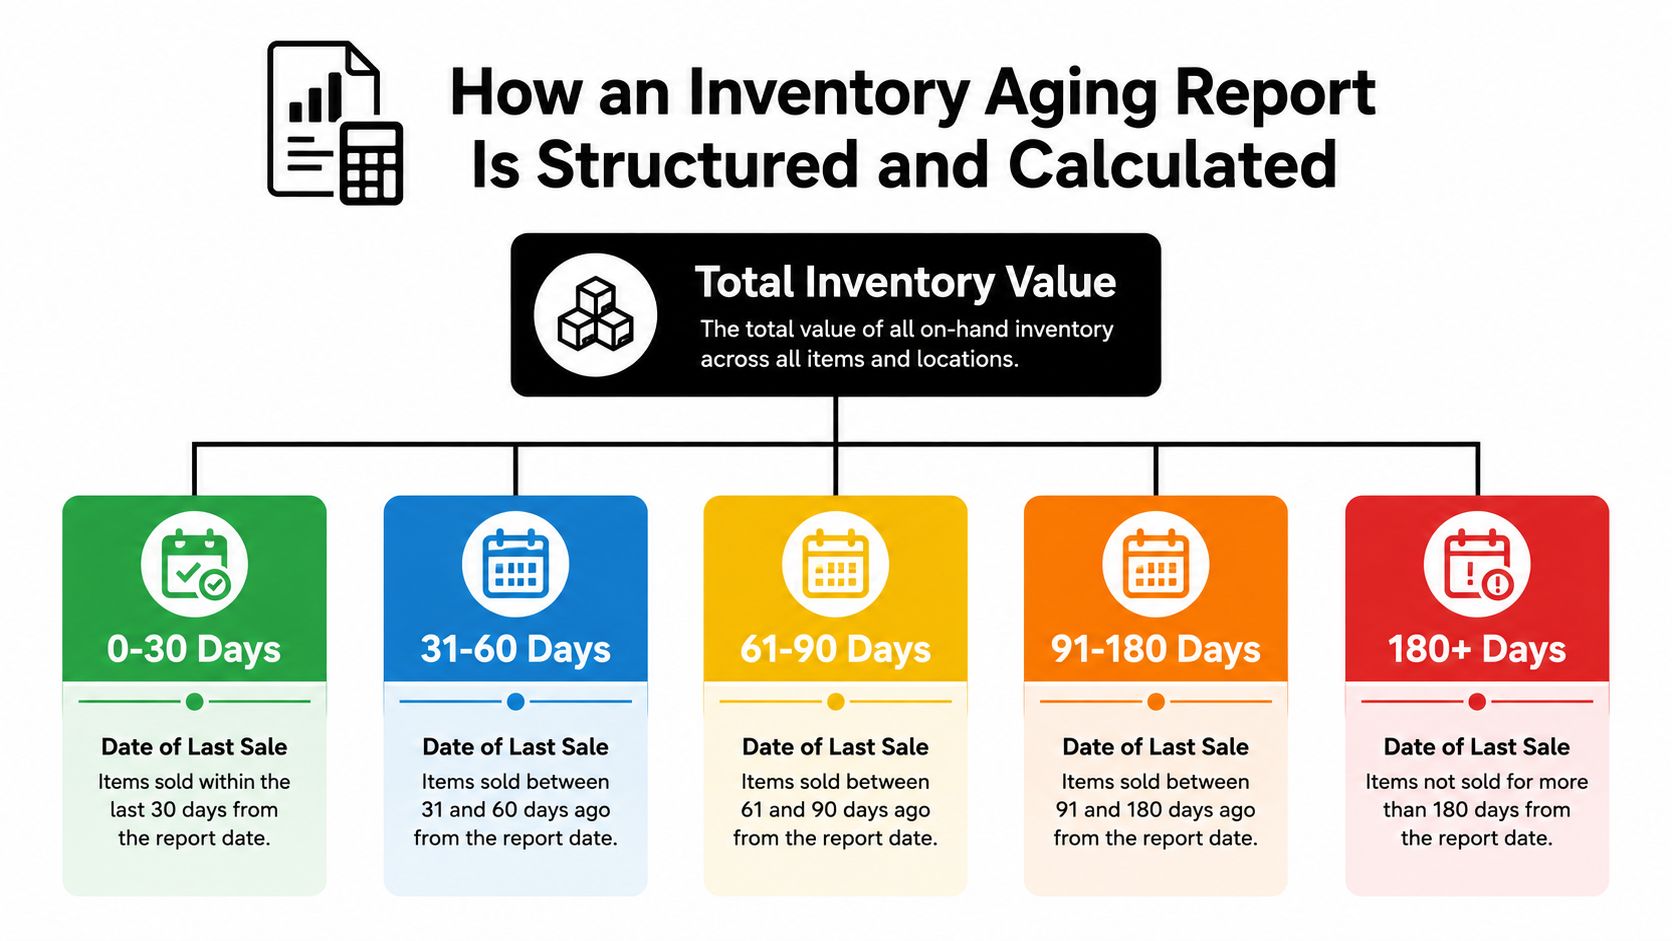
Start with the bucket structure. Major references commonly use 0–30, 31–60, 61–90, and 90+ days, and more detailed implementations add 91–180 and 180+ days to isolate slow-moving stock more cleanly. That structure matters because a report that stops at a blunt “older than 90 days” label hides the difference between inventory that needs a gentle push and inventory that needs immediate disposition.
The core fields are essential. You want SKU, location, receipt date, quantity on hand, unit cost, and extended value. SKU-level detail matters because age is only useful when it is tied to capital at risk, and extended value is what lets finance rank exposure by dollar impact instead of by item count. One standard KPI version also calculates the percentage of total inventory value in each bucket, using Inventory Age Ratio = (Value in bucket / Total inventory value) × 100%.
Here's the calculation logic I'd insist on in an ERP or spreadsheet audit:
- Define the aging date. Use the right starting point for your model, purchase, receipt, production completion, transfer, or return date.
- Calculate days aged. Subtract the aging date from the reporting date.
- Assign the bucket. Drop each unit into its time band.
- Summarize by value. Roll up by SKU, location, and bucket so finance can see dollar exposure.
The starting date is where many businesses get this wrong. In a distributor, receipt date usually makes sense. In a manufacturer, production completion can be more honest. In a multi-location business, transfer history may matter because a transfer can reset operational visibility even if the item wasn't newly acquired. That choice changes which inventory looks aged, so the report has to match the way your business moves stock.
The other key formula is Days Sales in Inventory, also expressed as Average inventory age = (Average Inventory Value / COGS) × 365 days. That links the report to cash conversion and makes it easier to compare your aging view to broader turnover metrics. If you want a finance-side checklist for the rest of the metrics that should sit beside this report, the financial metrics every business owner should track page is the right companion.
If the starting date is wrong, the report won't just be a little off, it'll point you at the wrong stock.
Reading the Buckets and KPIs That Matter
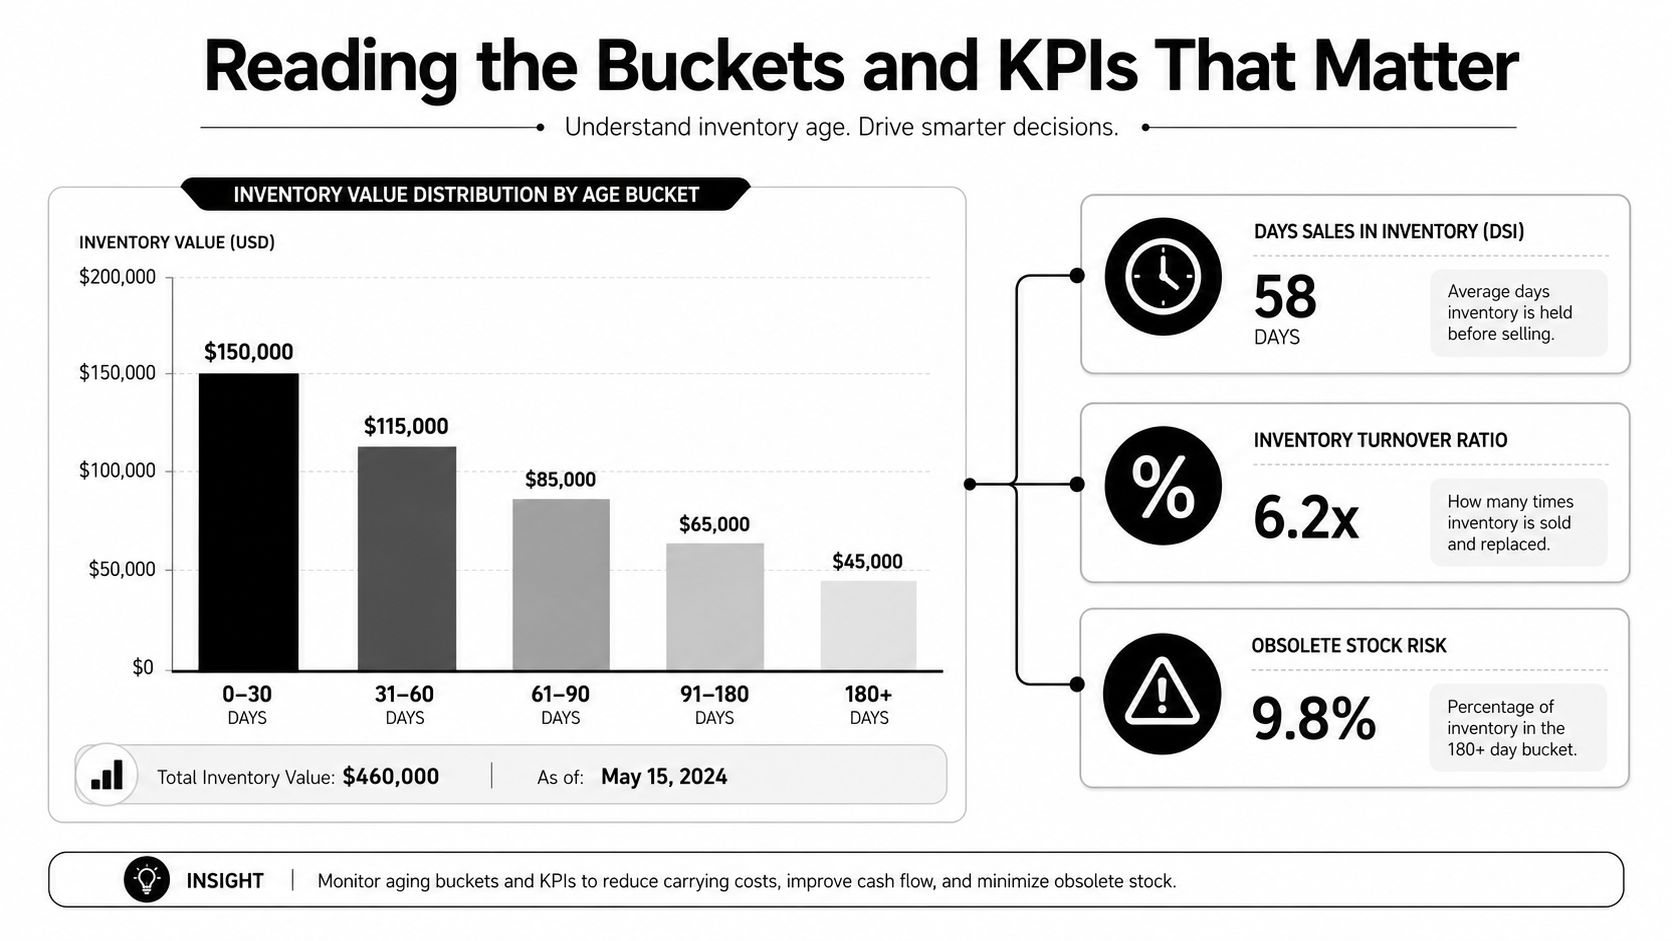
The mistake I see most often is treating every older bucket as equally bad. It isn't. 0–30 days usually tells you whether purchasing and replenishment are under control. 31–60 days shows whether demand is softening. 61–90 days is the warning zone where a manager should start asking why product velocity slowed. Once stock moves into 90+ days, you're no longer monitoring inventory, you're deciding how to convert capital back into cash.
A good reading habit is to look at percentage of value by bucket before you look at item count. If a small number of SKUs represent a large amount of value in older buckets, that's where your cash is trapped. The report becomes much more useful when you combine bucket value with Days Sales in Inventory. A higher DSI means inventory is taking longer to turn into cash, which is exactly why the report belongs in a working-capital review, not just in operations.
The carrying-cost lens matters too. ERP Group notes that holding cost is often estimated at 1.5%–2.5% of stock value per month to reflect warehousing, insurance, and capital cost. I would use that as a management approximation, not a formal accounting line item, because even a rough carrying-cost view makes slow-moving stock feel less abstract. The longer a SKU sits, the more it costs you to keep it.
Here's the right way to ask the question:
- Is this age band seasonal? If yes, don't panic.
- Is this value concentrated in a few SKUs? If yes, target those items first.
- Is DSI trending the wrong way? If yes, purchasing is outrunning demand.
- Is the old stock being protected for a reason? If yes, document the reason.
That last point matters. Some inventory is old because the business planned for it, not because it failed. A seasonal distributor might hold stock on purpose, while a spare-parts operation may keep older items because replacement demand is irregular. What matters is whether the stock has an economic purpose.
For a deeper operational lens on how these numbers affect planning, the budgeting and cashflow planning tips resource is worth a read. And if you manage a construction business, the construction KPIs page helps you see how inventory aging fits into a broader project and cash view.
Industry-Specific Aging Thresholds and Starting Dates
A generic 30/60/90 setup works for simple retail. It breaks down fast in construction, distribution, and professional services. The right threshold depends on lead times, project duration, and how long the business can reasonably hold the asset before it turns into a cash drag.
Construction
Construction inventory often needs longer custom windows because materials can sit idle waiting on a project milestone. A bucket set like 0–45, 46–90, 91–120, 120+ days is often more useful than a rigid retail template. The starting date should usually align with the point the material became available for a job, not just the purchase date, because that tells you whether the item is waiting on the field or waiting on the warehouse.
Distribution
Distribution is the cleanest fit for classic aging buckets. Receipt date is usually the best starting point, and 90 days is a practical review threshold for slow movers, with 180 days as the point where disposition planning becomes serious. That lines up with the way stock flows through a distributor's network, where shelf life, supplier terms, and demand volatility all matter at once.
Professional Services
Professional services firms usually don't carry inventory in the same way, but when they do, it's often equipment, parts, or supplies tied to client work. That inventory should be tracked by operational usefulness, not by a generic retail clock. For these businesses, the question is whether the item is supporting revenue soon or whether it has become dead weight that should be reassigned, written down, or stopped from being reordered.
Decision rule: Set aging buckets to match the time it takes your business to turn stock into billable work or cash.
The key point is that the starting date changes the outcome. Purchase date, receipt date, production completion, transfer date, and return date can all tell different stories. If your ERP, warehouse team, and finance team don't use the same basis, you'll overstate aged stock in one report and understate it in another.
The best control here is consistency plus judgment. Use one aging basis for reporting, then document exceptions for special cases like transfers, project materials, or returned inventory. That way, the report stays comparable month to month and doesn't become a debate about definitions every time leadership looks at it.
Action Rules for Each Aging Bucket
The report is useless if it doesn't trigger action. I want every bucket tied to a decision, a owner, and a cash outcome. If you're still reviewing old stock without a rulebook, you're giving away working capital.
| Aging Bucket | Recommended Action | Cash-Flow Impact |
|---|---|---|
| 0–30 days | Freeze unnecessary reorders, fix assortment, and move units to stronger locations | Prevents new cash from being tied up |
| 31–60 days | Review demand, rebalance stock, and target low-friction promotions | Slows further cash drag before markdowns deepen |
| 61–90 days | Apply selective markdowns, bundle weak SKUs, or shift to secondary channels | Starts converting slow stock back into cash |
| 90–180 days | Escalate to vendor return, rework, or purchase freeze decisions | Protects margin while limiting more capital lockup |
| 180+ days | Dispose, liquidate, scrap, or record a lower-of-cost-or-market adjustment where applicable | Frees balance-sheet space and stops carrying dead weight |
Those rules are the right backbone for a distributor. They're also the right place to challenge optimism. Aged stock is not automatically bad, but it does need a reason to stay. If an item is seasonal or tied to cross-plant demand, hold it with a written explanation. If not, move fast.
Finance and operations must agree on thresholds for aged inventory, which can increase Days Inventory Outstanding. When market value drops below cost, a write-down under GAAP or IFRS may be required. This is not an abstract accounting issue; it affects profitability and the quality of the balance sheet. A key error is waiting until an item is obviously obsolete before taking action.
For a practical cash lens, use the how to improve cash flow guide to connect disposition choices to working-capital priorities. If you're going to hold aging stock, document why. If you're going to cut it loose, do it with a rule, not with emotion.
Don't ask whether the stock is old. Ask whether it still has a path to cash at an acceptable margin.
Templates, Tools, and Reporting Cadence
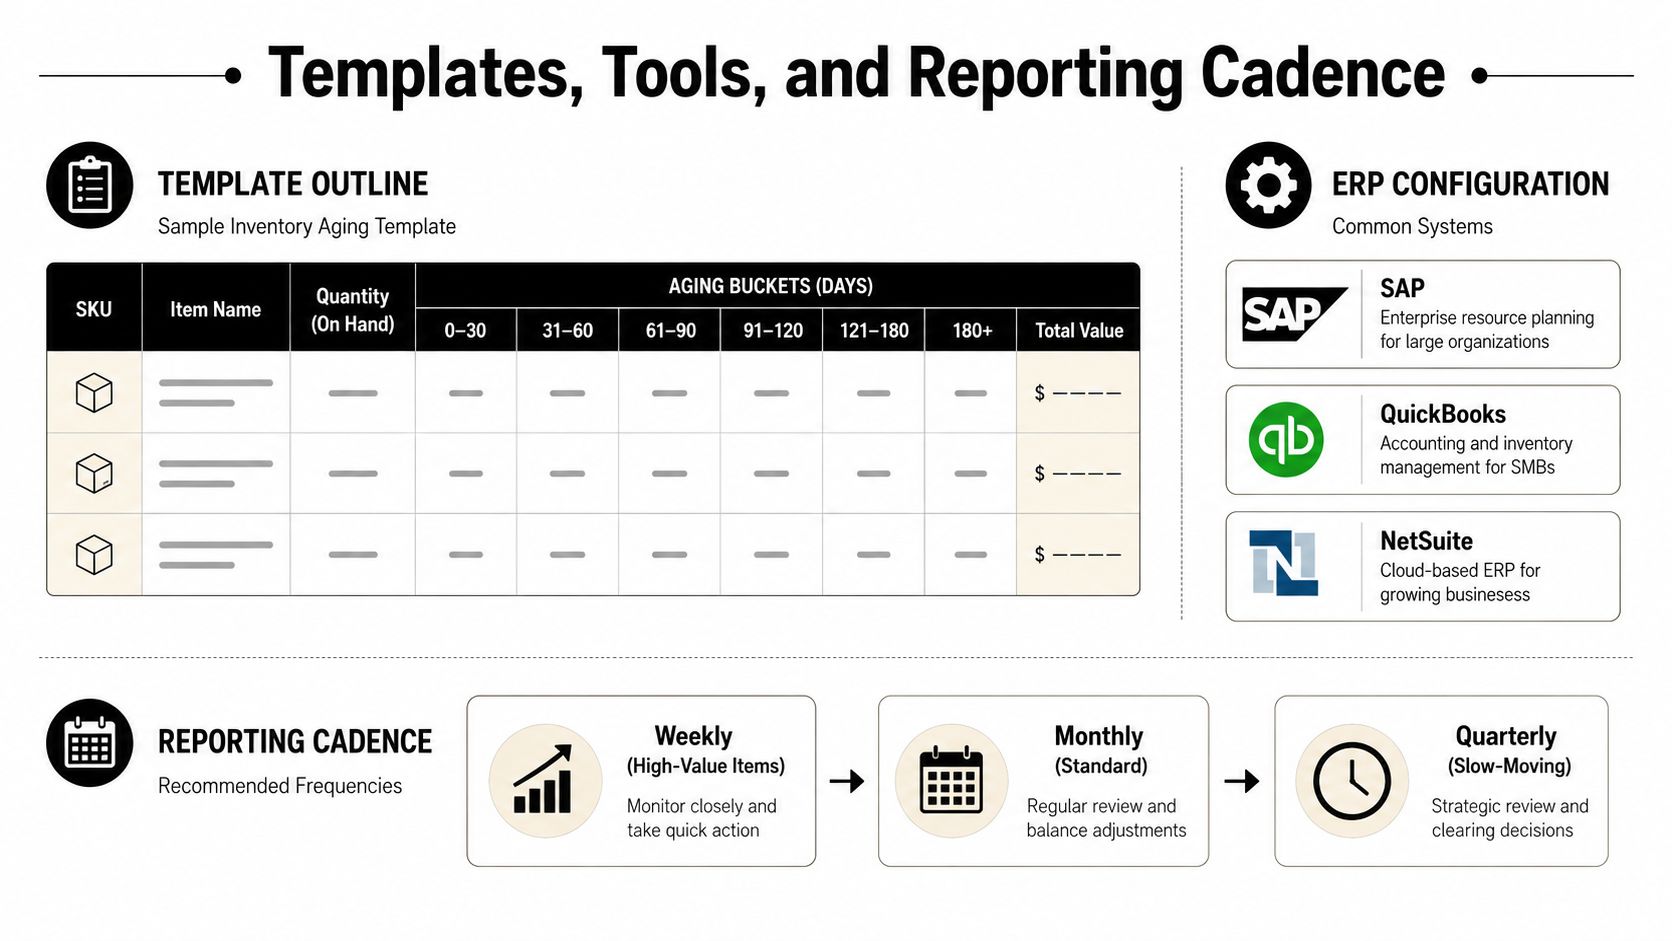
A usable template starts simple. Track SKU, item name, location, quantity, unit cost, extended value, and the bucket columns that match your business. Add receipt date and last sale date if you want a stronger audit trail, because that's how you separate slow inventory from stock that only looks old because the date logic is weak.
Your tool stack doesn't need to be fancy to be useful. SAP, QuickBooks, and NetSuite can all support aging logic when the fields are configured correctly. The mistake is assuming software will solve a process problem. If the underlying dates are wrong, automation just gives you a faster wrong answer.
I'd run the cadence like this:
- Weekly for high-value items. Review items with the largest dollar exposure first.
- Monthly for standard inventory. This is the minimum for leadership review.
- Quarterly for slow-moving or seasonal lines. Use this to validate whether old stock is a problem.
That cadence keeps the report close enough to operations without drowning your team in noise. It also lines up well with a 13-week cash flow model, where inventory decisions need to be visible before they hit the bank account. If you're not feeding the aging report into your cash forecast, you're missing the point.
For teams trying to automate the workflow, the ROI of automated reporting discussion is a useful lens, because the value comes from getting the report into the hands of decision-makers while the stock is still actionable. I'd rather see a short, consistent report every month than a polished dashboard nobody opens.
The best practice is to review the same cut every time, with the same buckets, against the same exceptions log. That consistency is what lets leadership see whether a purchasing change, pricing move, or stock transfer improved aging quality.
When to Bring in Fractional CFO Support
If aged inventory is recurring, you've moved past an operations problem. You need financial strategy. That's especially true when the report starts affecting loan conversations, acquisition prep, succession planning, or any decision where balance-sheet quality matters as much as revenue.
A fractional CFO earns their keep when inventory aging has to be connected to margin by customer, by job, or by client. That's the difference between saying “we have too much old stock” and saying “these SKUs are tying up cash and depressing returns in the exact part of the business that should be generating liquidity.” If you're thinking about transition in the next few years, this becomes part of exit readiness, not just monthly reporting.
The right time to escalate is when your team can generate the report but can't turn it into decisions. If purchasing keeps repeating the same mistake, if markdowns happen too late, or if leadership can't tell whether old stock is strategic or stale, senior financial leadership helps force the issue. For owners comparing when that level of support makes sense, the when to hire a fractional CFO guide is the right benchmark.
The point is simple. You don't need more inventory data, you need better decisions. When aging inventory starts shaping cash flow, bankability, and exit value, you need someone who can turn the report into action.
AmbitionCFO helps owners turn inventory aging into cash flow decisions, not just month-end reporting. If you're ready to tighten working capital, improve visibility, and make better calls on stock, visit AmbitionCFO and start the conversation.