

Most five-year plans fail for a reason that has little to do with strategy. Strategic-planning data reports that 84.5% of strategic projects never reach completion, while only 5.7% of organizations complete at least 75% of their projects (ClearPoint Strategy). For a founder-led company, that means the document itself has almost no value unless it changes what the leadership team does every quarter.
A usable business 5 year plan is not a polished forecast for a lender or a board packet that disappears after approval. It's a financial and operating system that connects cash, capital, people, performance, and exit readiness. This approach matters particularly in construction, distribution, and professional services, where receivables, inventory, work in progress, retainage, project margins, and key-person dependency can matter more than headline revenue.
Table of Contents
- Why Most 5 Year Plans Fail Before They Start
- Set the Foundation Before You Build the Model
- Build the 5 Year Financial Model
- Set Margin and KPI Targets That Actually Move Cash
- Stress Test the Plan With Scenarios and Triggers
- Plan Capital, Hiring, and Leadership Readiness
- Convert the 5 Year Plan Into a Quarterly Operating System
Why Most 5 Year Plans Fail Before They Start
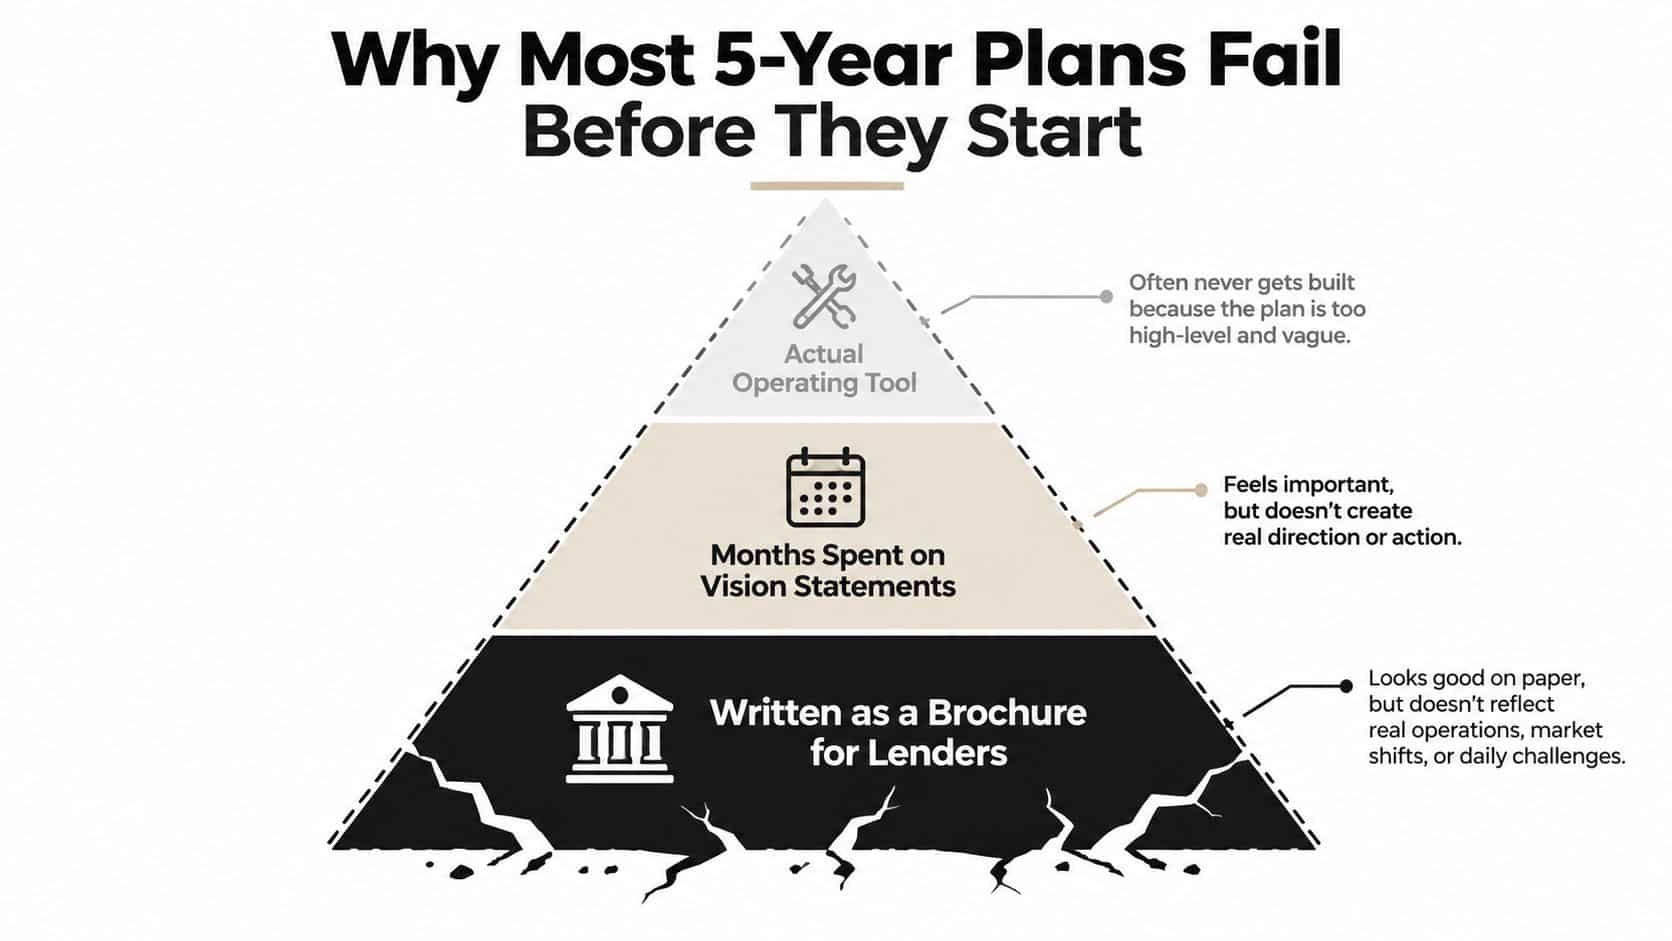
The common assumption is that a five-year plan fails because the strategy was wrong. In practice, many plans fail after the strategy has already been approved. The founder creates a compelling vision, the leadership team agrees with it, and nobody assigns ownership for turning it into decisions.
The plan becomes a brochure. It describes the market, repeats the mission, presents attractive projections, and lists ambitious initiatives. It doesn't tell the operations leader which hiring request gets approved, the sales leader which customers fit the margin profile, or the finance team how much cash must remain available before equipment purchases begin.
The cash problem hides inside profitable growth
A construction company can report strong profit while cash sits in unbilled work, retainage, or disputed change orders. A distributor can grow sales while inventory and supplier commitments absorb every dollar. A professional-services firm can win larger accounts while payroll arrives before clients pay.
A plan that models only revenue and net income misses the question that keeps owners awake: what cash will be available at the end of each quarter? Cash must roll forward from beginning cash plus net cash flow, with net cash flow equal to total inflows minus total outflows. That logic belongs in the core model, not in a separate spreadsheet maintained after a crisis begins.
Practical rule: If the plan doesn't identify who owns execution, which quarterly result proves progress, and what happens when cash misses the forecast, it isn't an operating plan.
The history of the five-year plan reinforces its role as a target-setting framework. The Soviet Union launched its first five-year plan under Joseph Stalin in 1928, running from 1928 to 1932, or nominally from October 1928 to September 1933. The USSR ultimately used thirteen five-year plans between 1928 and 1991, showing how the format became a durable method for setting multi-year targets and milestones (Encyclopaedia Britannica).
Your version should be less rigid and more useful. Keep the five-year horizon for capital allocation and ownership decisions, but manage the business through quarterly commitments, rolling forecasts, and explicit responses to variance. A financial forecasting guide for growing businesses can help you identify where rapid growth is consuming cash before the plan commits you to more of it.
Set the Foundation Before You Build the Model
Don't open Excel first. Start with one page that defines where the company is going and what it refuses to sacrifice on the way there.
For a founder of a construction or distribution company, the foundation should answer four questions:
- What does the company become in five years? Define the end state in plain language. It might be an independently scaled company, a strategic sale, a generational transfer, or a private-equity recapitalization.
- Why does the company exist? Write a mission that a key employee can repeat without coaching. A concise mission gives leaders a decision filter when the plan contains competing priorities. For a practical, data-oriented treatment of the topic, review this data-driven guide to mission statements.
- What won't change? Choose three to five core principles. These might include safety standards, customer selection, minimum job profitability, service quality, or preserving founder ownership until a defined readiness milestone.
- When does ownership transition become realistic? Set an exit horizon, then work backward from the condition the business must meet before a buyer, successor, or investor can take confidence in the company.
Reverse-engineer the year-four company
The final year of the plan isn't the only checkpoint that matters. Year four should show whether the business is ready for the intended ownership path. If the founder wants a strategic sale, the company may need clean reporting, dependable customer retention, diversified revenue, documented processes, and leadership that can operate without daily founder intervention.
If the goal is a family transfer, the required foundation may look different. The company needs successor development, decision rights, governance, and a clear transition process. A private-equity recapitalization may require a different mix of recurring revenue, margin quality, management depth, and financial controls.
Every major model assumption should trace back to this page. Revenue mix should support the chosen end state. Hiring should close a readiness gap. Capital spending should improve capacity or defensibility. A proposed product line that doesn't support the foundation should be removed, even if the spreadsheet makes it appear attractive.
The discipline is simple: write one page, test every major decision against it, and update the page only when the ownership strategy changes. A twenty-page vision document won't help a founder make a trade-off on a difficult Tuesday. A clear foundation will.
Build the 5 Year Financial Model
Your financial model should be a linked three-statement model. That means the income statement, cash flow statement, and balance sheet must reconcile with one another instead of functioning as independent estimates. This structure forces revenue, working capital, capital expenditure, debt, and financing assumptions to agree over time (cash-flow forecasting guidance).
Use annual columns for all five years. Add quarterly detail for years one and two, and roll cash monthly during the first year. Annual totals tell you where the company is supposed to arrive. Monthly cash reveals when a covenant, payroll, inventory purchase, or equipment commitment creates pressure.
Model the drivers, not a single growth percentage
A distribution business should forecast by product category, customer cohort, pricing, volume, and inventory behavior. A contractor should separate commercial work, service agreements, change orders, retainage, labor, materials, and work in progress. A professional-services firm should distinguish service lines, utilization, billing rates, delivery capacity, and client concentration.
Build a working-capital schedule that explicitly models receivables, payables, inventory, and WIP timing. Profit without collection timing is not a cash plan. A business can show rising earnings while its cash balance falls because customers pay slowly or the company commits to inventory before demand is collected.
| Statement | Line item | Years 1-2 granularity | Years 3-5 granularity | Driver / owner |
|---|---|---|---|---|
| Income statement | Revenue by segment | Quarterly | Annual | Sales leader |
| Income statement | Labor and direct costs | Quarterly | Annual | Operations leader |
| Income statement | Overhead | Quarterly | Annual | Department heads |
| Balance sheet | Accounts receivable | Quarterly | Annual | Controller |
| Balance sheet | Inventory or WIP | Quarterly | Annual | Operations leader |
| Balance sheet | Debt and financing | Quarterly | Annual | CFO or owner |
| Cash flow statement | Operating cash flow | Monthly in year one, quarterly in year two | Annual | Finance |
| Cash flow statement | Capex | Monthly in year one, quarterly in year two | Annual | Owner and operations |
| Cash flow statement | Ending cash | Monthly in year one, quarterly in year two | Annual | CFO or owner |
Name an owner and source document for every important line. Sales should connect to the pipeline and contract backlog. Payroll should connect to the hiring plan. Receivables should connect to customer terms and collection history. Capital spending should connect to approved equipment or facility decisions.
The model's fastest answer should be: what will cash look like at quarter-end under the current plan, and which assumption puts that number most at risk? Scenario layers and variance checks should sit on top of each period bucket, particularly when a decision involves significant capital or multi-year growth. Owners comparing debt-funded assets or property-related cash flows can also review this financing strategy for rental properties for another perspective on linking financing assumptions to operating cash.
Use these financial modeling best practices to keep the structure auditable. Don't add detail merely to make the workbook impressive. Add detail where timing, accountability, or a decision depends on it.
Set Margin and KPI Targets That Actually Move Cash
A KPI earns its place in the plan only when it changes a decision. Gross margin matters because it determines how much revenue remains to fund overhead and investment. DSO, or days sales outstanding, matters because it shows how long cash stays trapped in receivables. Inventory turns matter because slow-moving stock consumes financing capacity.
Start with a baseline from actual operating data. Then set a target by segment, service line, job type, or customer cohort. Don't use one company-wide margin target if the company sells different kinds of work with different risk, labor intensity, and collection patterns.
Consider a $40M specialty contractor. The operating plan might target 38% gross margin on commercial work, 45% on service contracts, reduce DSO from 62 to 48 days, and increase inventory turns from 4 to 6. Those figures are planning assumptions for the example, not universal benchmarks. The important point is the connection between each target and the cash forecast.
| KPI | Baseline | Year-5 target | Owner | Cash lever |
|---|---|---|---|---|
| Commercial gross margin | Current actual | 38% | Commercial leader | Cash generated per project |
| Service-contract gross margin | Current actual | 45% | Service leader | Contribution from recurring work |
| DSO | 62 days | 48 days | Controller and account owners | Faster collections |
| Inventory turns | 4 | 6 | Supply-chain leader | Less cash tied in stock |
| Labor productivity | Current actual | Defined operating target | Operations leader | Lower cost per job |
Give every KPI a glide path
A year-five target is too distant to manage. Assign each KPI an owner, a starting number, a quarterly checkpoint, and a response when performance misses. The commercial leader might review estimate-to-complete margins every month. The controller might own aging by account and escalate invoices that pass agreed terms. The supply-chain leader might review obsolete or slow-moving inventory before approving new purchases.
A KPI dashboard should show the operational result and the financial consequence on the same screen. The KPI dashboard design guide offers a useful reference for deciding which measures belong in that view.
Then reconcile the math. If the revenue plan assumes more commercial work but the margin target is below the company's required cash contribution, the plan contradicts itself. If sales growth requires inventory purchases that the cash forecast cannot fund, delay the growth or arrange financing before signing the commitments.
Stress Test the Plan With Scenarios and Triggers
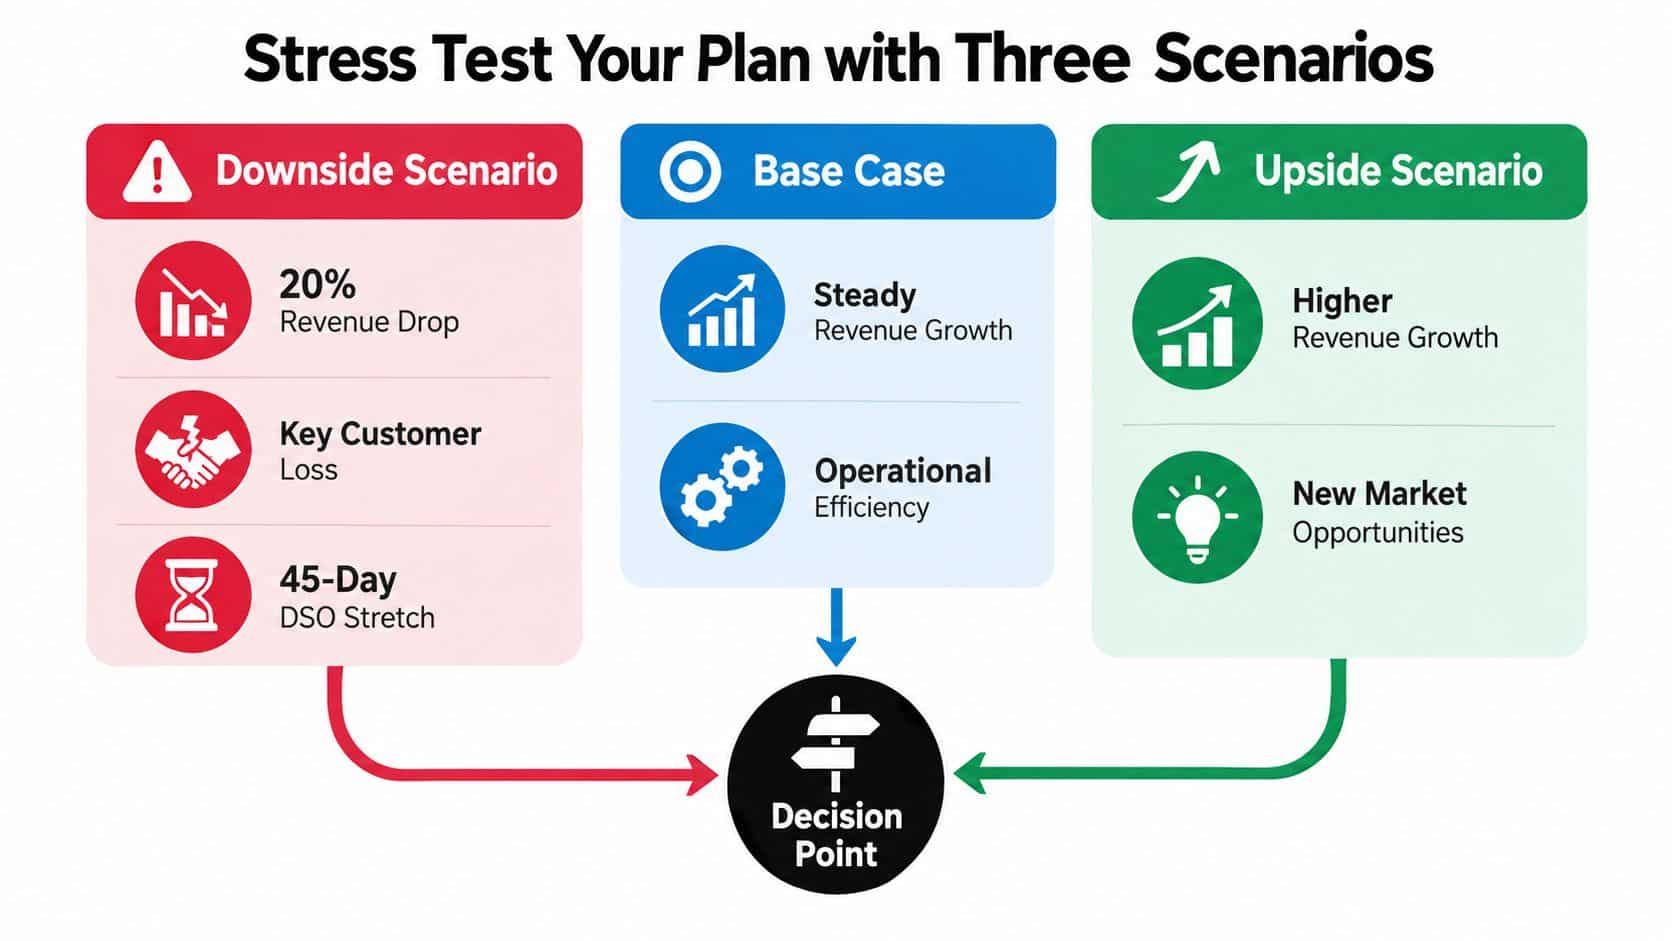
A base case is a starting point, not a prediction. Build three versions of the cash forecast and change the assumptions that hurt an owner: sales volume, customer retention, collection timing, hiring speed, supplier costs, and capacity.
The downside case should model a 20% revenue drop, the loss of a key customer, and a 45-day DSO stretch. The base case should reflect the operating plan. The upside case can accelerate revenue, but it must still test whether hiring, inventory, equipment, and working capital can keep pace.
Turn warning signs into pre-authorized decisions
Don't wait for a quarterly meeting to decide what a trigger means. Write the response into the plan while judgment is calm.
| Trigger | Pre-written response |
|---|---|
| Cash falls below the approved minimum buffer | Freeze discretionary hiring and evaluate a line-of-credit draw |
| Trailing-three-month EBITDA misses plan | Reallocate spending and review pricing |
| Customer concentration rises above 25% | Slow concentration-building sales and diversify the pipeline |
| AR ages past agreed terms | Escalate collection ownership and restrict additional exposure |
| Upside demand exceeds delivery capacity | Sequence hiring and protect margin before accepting volume |
The 25% customer-concentration threshold in this framework is a management trigger, not an industry standard. The same applies to the minimum cash buffer. Set that buffer from payroll, debt service, supplier commitments, and the timing of expected receipts.
Scenario planning starts with a base cash-flow forecast and tests changes such as lower sales, delayed payments, higher expenses, or new hiring. That process lets an owner see the effect on cash before making the commitment (cash-flow scenario planning guidance).
For a deeper framework, use this guide to scenario planning. The purpose isn't to guess the future. It's to decide in advance which facts will force a hiring freeze, a revolver draw, a price increase, or SKU rationalization.
Watch the walkthrough below for a visual explanation of stress testing.
Plan Capital, Hiring, and Leadership Readiness
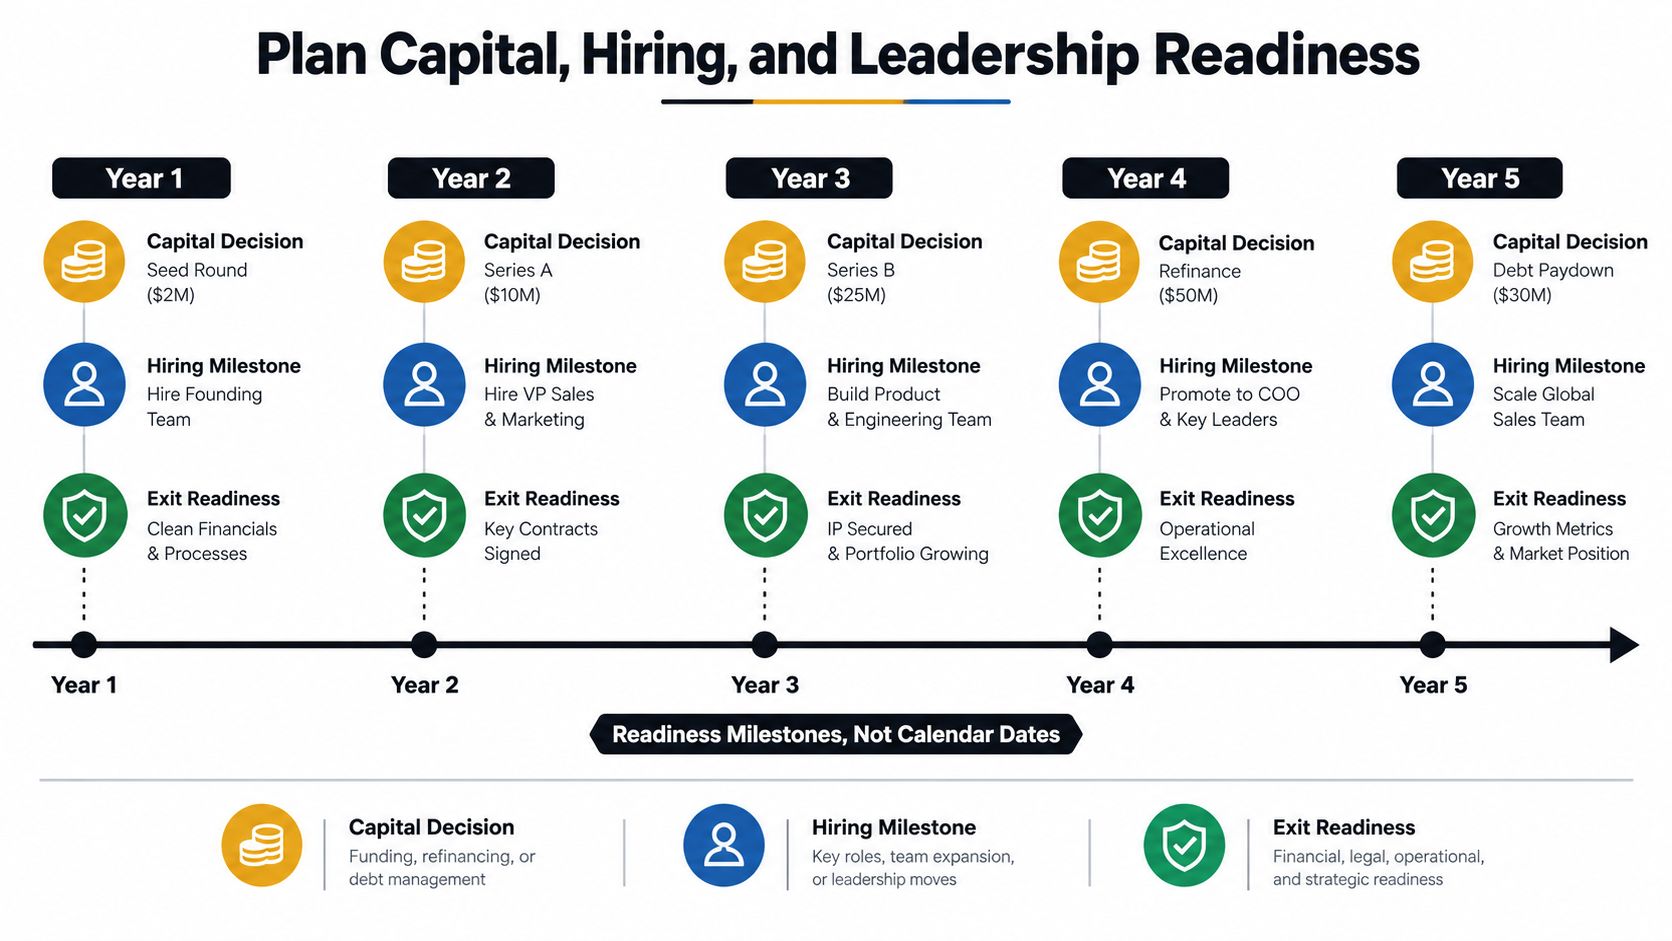
Capital and people should enter the plan when the business is ready for them, not because the calendar says it's time. A founder moving from $30M to $80M in revenue may need additional working-capital capacity before pursuing a new market, but the right financing depends on the cash cycle, asset base, profitability, and ownership objectives.
Map each capital decision to a readiness milestone. Refinance working-capital debt when the current structure restricts operating flexibility. Add equipment financing or a revolver when the model shows a supported capacity requirement. Consider growth equity or a strategic minority investor only when the capital solves a defined constraint and the ownership consequences fit the exit plan. This comparison of equity and debt helps frame that decision.
Hire against operating complexity
Tie leadership hiring to revenue, margin, and founder dependency. A practical roadmap for the example company could include:
- Above $15M: Add fractional CFO support when the owner needs cash forecasting, margin analysis, and financial decision support beyond bookkeeping and tax compliance.
- Above $40M: Add a full CFO and controller when reporting, controls, financing, and planning require dedicated internal leadership.
- Before founder removal from operations: Appoint or develop a COO who owns execution without routing every decision through the founder.
- Before the second product line launches: Hire a sales leader who can build pipeline discipline and protect the original business from being neglected.
Those thresholds are planning gates for this framework, not universal rules. A smaller company with complex contracts may need stronger finance leadership earlier. A larger company with simple operations may reach the same readiness later.
Leadership readiness requires evidence, not job titles. Each executive should have a documented 90-day plan, clear decision rights, a named backup, and performance measures tied to the operating model. Document processes for sales handoffs, project reviews, collections, purchasing, hiring, and customer escalation. Owners considering technology-supported workforce planning can also review how to build a resilient team with AI.
An exit-ready company can explain who runs the business, how the company produces cash, and what happens when a key person is unavailable. If every important answer still depends on the founder, the plan has a leadership gap, not a growth strategy.
Convert the 5 Year Plan Into a Quarterly Operating System
The five-year horizon should remain visible, but the operating calendar should be much shorter. Assign every year a capital decision, a hiring milestone, and an exit-readiness checkpoint. Then convert the current year into three to five annual objectives, twelve monthly KPIs, four quarterly business reviews, and six 90-day sprint cycles.
A workable cadence looks like this:
- By the 5th of each month: Finance updates cash and compares actuals with the forecast.
- By the 7th: Department leaders submit KPI results, explanations, and corrective actions.
- By week three of each quarter: The leadership team holds a business review and reforecasts the remaining periods.
- Within ten days of quarter close: The owner sends a board or advisor update with results, decisions, and capital implications.
Use one page to run the week
Your weekly dashboard should fit on one screen. Put the year's headline objective at the top, followed by revenue, gross margin, cash conversion days, runway, and the current sprint's commitments. Add a small trigger panel showing whether any pre-authorized response has been activated.
The year-by-year roadmap might look like this:
| Year | Capital decision | Hiring milestone | Exit-readiness checkpoint |
|---|---|---|---|
| Year 1 | Stabilize working-capital capacity | Strengthen finance ownership | Establish reliable reporting |
| Year 2 | Fund proven capacity | Add functional leadership | Document core processes |
| Year 3 | Evaluate expansion capital | Build a management bench | Reduce founder dependency |
| Year 4 | Optimize capital structure | Complete succession coverage | Prepare buyer or successor materials |
| Year 5 | Execute ownership decision | Transition operating authority | Complete exit or continue independently |
Update assumptions through a rolling forecast rather than locking decisions to an annual budget. A rolling forecast extends the view beyond a fixed one-year budget horizon and keeps the plan current as conditions change (rolling forecast guidance).
SMART objectives make the system measurable. SMART means specific, measurable, achievable, relevant, and time-bound (Minnesota Department of Health). Objectives should state how progress will be measured and include timing, benchmarks, or quantities where appropriate (SAMHSA SMART goals guidance).
Don't wait for the next QBR when a trigger is breached. Reallocate cash, hiring capacity, pricing authority, or inventory commitments immediately, then document the decision for the next review.
AmbitionCFO helps founder-led companies build linked financial models, cash-flow visibility, margin analysis, KPI dashboards, and exit-readiness plans around the way the business operates. Visit AmbitionCFO to discuss turning your five-year vision into a quarterly operating system with clear owners, triggers, and capital decisions.