

You're looking at revenue that's growing, a bank balance that isn't, and a management report full of numbers that don't tell you what to do next. That's familiar in a founder-led company between $10M and $100M. You've outgrown deciding by feel, but your reports still describe last month instead of warning you about next month.
Developing key performance indicators fixes that when you rank every measure by cash impact and decision lead time. You don't need dozens of metrics. You need a few well-defined numbers that move early enough for you to change pricing, staffing, purchasing, or collections before cash tightens.
Table of Contents
- What Makes a Metric a Real KPI
- How to Build Each KPI in Six Steps
- Choosing Leading and Lagging Indicators That Predict Cash
- Testing Cause, Counter-Metrics and Behavior
- Setting Targets From History, Capacity and Industry
- Building an Executive Dashboard and Review Rhythm
- Start Your KPI Pilot This Quarter
What Makes a Metric a Real KPI
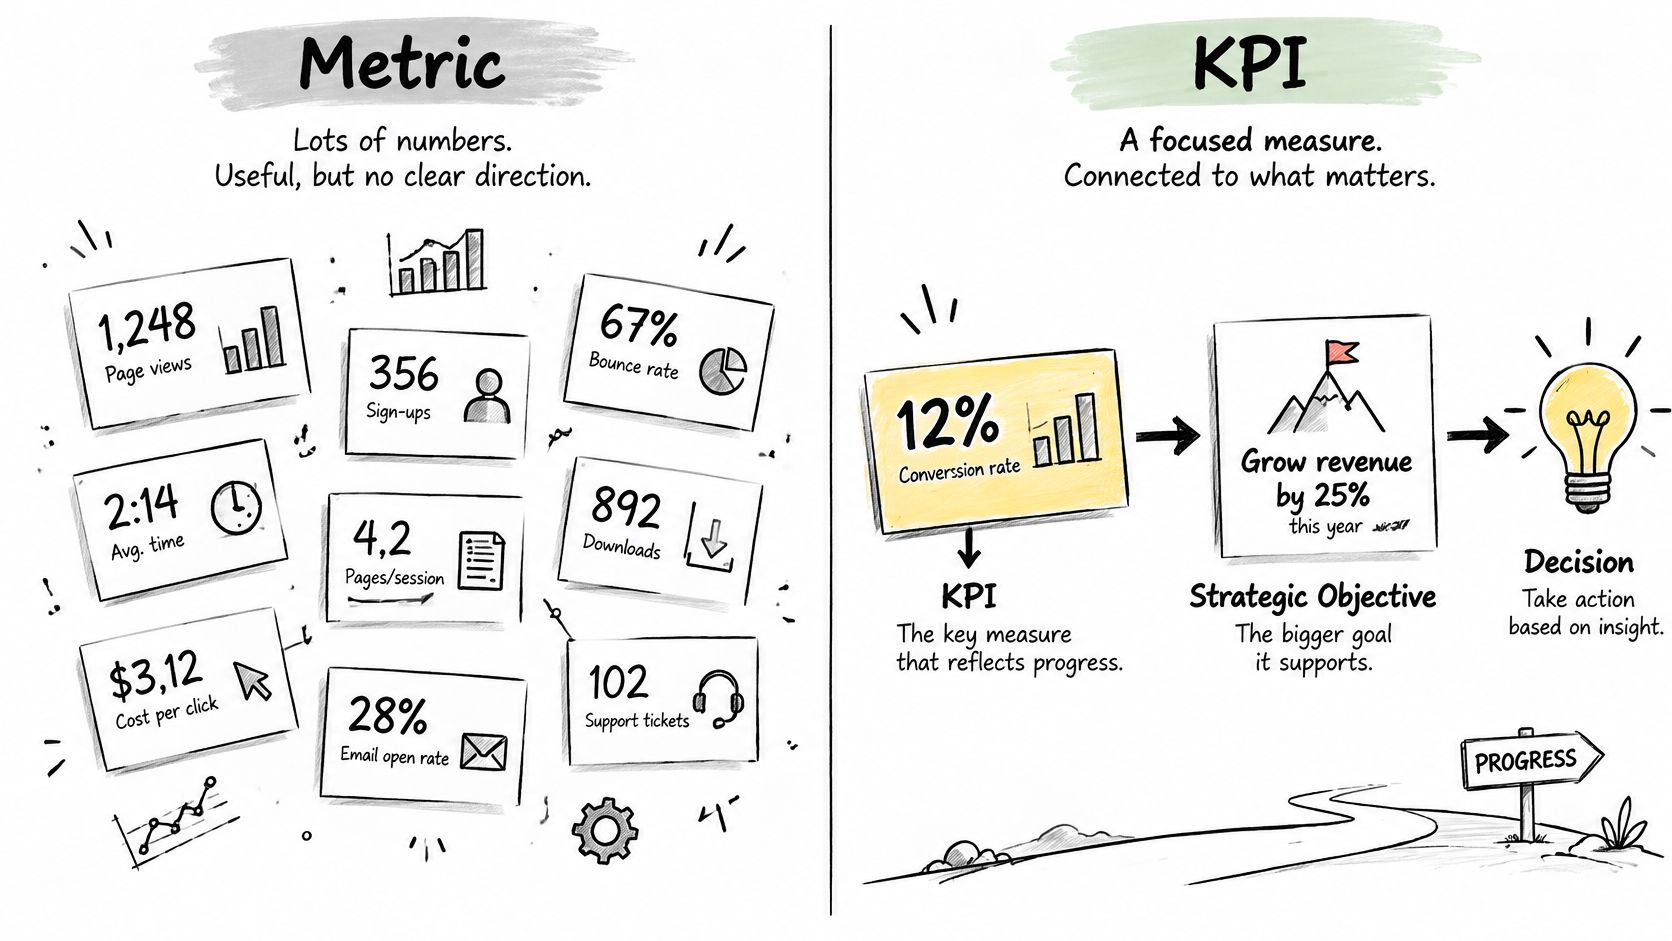
A long management report isn't a KPI system. A metric is any number your systems can produce. A KPI is different. It's tied to one strategic objective and should change a decision when it misses.
Four terms keep the work clear. A leading indicator moves before the result, such as backlog or quote volume. A lagging indicator confirms what already happened, such as operating cash flow. A counter-metric sits beside a KPI to expose gaming, and a baseline is the starting value measured on the same definition you'll use later.
The Five Part Test
Every KPI should cover one performance area, use a numeric measure, carry a realistic target, connect to a business need, and include a deadline. That turns a vague goal like improve profitability into a testable one. Raise operating margin from 9% to 14% within eight quarters while keeping revenue growth above 15% gives owners and managers something they can steer.
That discipline traces back to the Balanced Scorecard introduced by Robert S. Kaplan and David P. Norton in the January to February 1992 issue of Harvard Business Review, described in the Harvard Business School publication record. It pushed companies beyond return on investment and earnings per share toward customers, internal processes, and learning and growth. Its premise still holds. Organizations prioritize what leadership measures, reviews, and rewards, so financial outcomes need operational drivers behind them.
For a sharper view on separating useful measures from activity counts, The OKR Hub on meaningful metrics is a helpful companion.
Run a self-check today. List every number on your current management report and mark which ones pass the five part test. Most won't the first time, and that gap is your starting point.
How to Build Each KPI in Six Steps
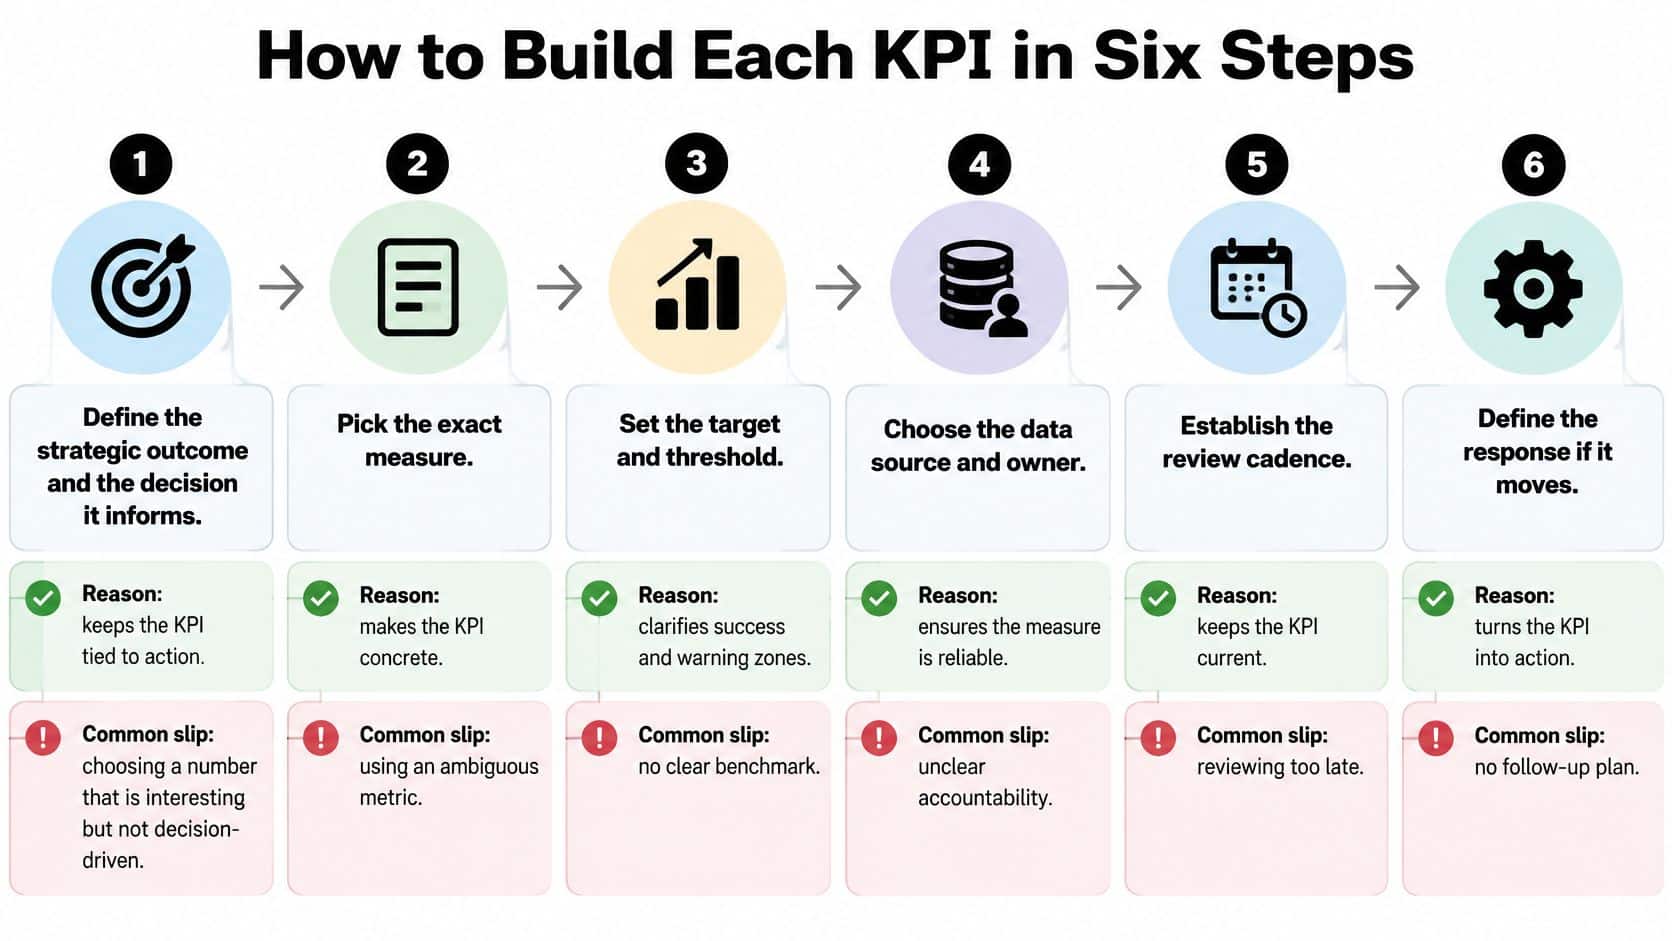
A job can look profitable on the bid and still consume cash if costs arrive before billing or change orders go unapproved. Build each KPI around a specific decision, then define it tightly enough that managers can act on the result.
Steps One Through Three
- Define the outcome and decision. Name the result the business needs and the choice the KPI should inform, such as whether to accept a bid below the target margin. A number that does not change a decision is a report detail, not a useful management measure.
- Identify drivers and results. List the operational factors managers can influence and the financial result those factors should affect. For a margin KPI, that might mean tracking labor hours or material costs alongside job margin. A lagging result alone gives little warning about where to intervene.
- Write the operational definition. Specify the formula, time window, exclusions, data owner, and source system. For contractor gross margin, state whether equipment ownership, field supervision, change-order revenue, and unapproved work-in-progress are included. Consistent definitions make job comparisons meaningful and keep the margin figure tied to the costs and revenue it is meant to represent.
Steps Four Through Six
- Establish and segment the baseline. Calculate the current value using the written definition, then break it out by job, customer, location, or service line. A company-wide average can conceal underpriced work and jobs whose costs are already running ahead of plan.
- Set the target from evidence. Compare historical performance with capacity constraints and relevant benchmarks. A target that assumes crews, equipment, or cash the company does not have will not guide a credible operating decision.
- Assign cadence and threshold. Match the review schedule to how quickly the business can respond. Set a specific miss level and name the action it triggers, such as reviewing a bid, adjusting staffing, or tightening purchasing.
For example, a contractor bids a $400,000 job at a 22% gross margin target. At 60% completion, the job shows a 14% margin under a definition that includes change-order revenue and unapproved work-in-progress. That early variance gives leadership time to review the estimate and cost assumptions before submitting the next bid.
A short walkthrough can help clarify how a KPI definition connects to ownership and action.
Pilot Before You Roll Out
Start with a small set of KPIs and use one reporting cycle to check whether the definitions, sources, and owners work in practice. Reconcile financial measures to the general ledger and operating measures to their system of record. Revise unclear formulas before expanding the dashboard.
Use this worksheet for each KPI. Complete every field before relying on the measure in a management decision. The same discipline applies to margin by job and to supply chain KPIs for distribution operations.
| Field | What to write |
|---|---|
| Objective | The outcome and management decision the KPI supports |
| Formula | Numerator, denominator, time window, and exclusions |
| Baseline | Current value on the same definition, segmented by job, customer, or service line |
| Target | Value and deadline, checked against history, capacity, and benchmarks |
| Data source | The system of record and reconciliation method |
| Accountable owner | One person responsible for the KPI |
| Review frequency | Weekly, monthly, or quarterly, matched to the decision speed |
| Threshold and action | The miss level and the response it triggers |
| Counter-metric | A paired measure that helps reveal gaming or distortion |
Choosing Leading and Lagging Indicators That Predict Cash
Start with cash, because a KPI that arrives after the cash is gone is only history. In the Bluevine small business cash flow survey, 38.7% of surveyed owners had less than one month of operating cash available, while 51.3% said they would need emergency funds within 48 hours to cover a payroll squeeze. Your company is larger, but the timing risk is the same. Payroll doesn't wait for receivables.
Rank indicators by cash-conversion impact and decision lead time, not by how strategic they sound. Strong candidates include backlog-to-billings conversion, unbilled work aging, customer concentration, gross-margin fade from estimate to completion, collections forecast accuracy, and weeks of payroll coverage. Each one warns you while you can still act.
Growth can consume cash through retainage, inventory, project overruns, and delayed receivables. That's why each operating metric needs a cash consequence, an owner, a threshold, and a specific response. Pairing those measures with a forecast helps, and owners who want to develop a clearer financial forecast can connect weekly signals to expected collections. Our guide to building a rolling forecast that updates with actuals shows how to keep that view current.
| Industry | Leading indicator | Lagging indicator | Review cadence |
|---|---|---|---|
| Construction | Bid-win rate and backlog | Realized job margin and operating cash flow | Weekly leading, monthly lagging |
| Professional services | Utilization and pipeline coverage | Project margin and revenue | Weekly leading, monthly lagging |
| Distribution | Inventory sell-through | Gross margin % and cash conversion cycle | Weekly leading, monthly lagging |
Keep one or two measures per objective. More than that dilutes accountability and slows the meeting down.
Ask this every week: Which indicator tells me growth is consuming cash rather than creating it, and how many weeks before the bank balance shows it?
If you can't answer that, your leading indicators aren't leading. Adjust the set until at least one measure gives you time to slow purchasing, accelerate billing, tighten credit, or pause hiring before cash tightens.
Testing Cause, Counter-Metrics and Behavior
Most KPIs are untested hypotheses. Teams assume a driver causes a result, put both on a dashboard, and never check whether the relationship holds.
State the hypothesis in plain words first. "Reducing billing lag will improve cash conversion within 30 days" is testable. Name the expected lag, the confounding variables that could distort the result, and the action management can take. Then compare the driver with the later outcome across business units and after major mix changes.
Use 12 to 24 historical observations where available, as recommended in the SI Labs Balanced Scorecard review, which also reported that only 23% of organizations empirically validated the cause-and-effect chains in their Balanced Scorecards. Skipping this test is common, and it's expensive. You end up rewarding activity that doesn't create cash.
Understanding what value drivers actually move enterprise value helps you choose hypotheses worth testing instead of measuring everything that's easy to count.
Pair Every Outcome With a Counter-Metric
| Outcome KPI | Counter-metric | Distortion it catches |
|---|---|---|
| Revenue growth | Cash conversion | Growth that consumes cash |
| Utilization | Rework or quality claims | Busy teams with weak delivery |
| Gross margin by job | Schedule variance and unapproved work-in-progress | Margin that hides unrecognized losses |
| Backlog | Margin quality | Backlog won at underpriced terms |
| EBITDA | Customer concentration | Profit that depends on one client |
Watch for the usual failure modes. Too many metrics, undefined ownership, targets detached from capacity, and activity measures mistaken for outcomes will distort behavior fast. Utilization can rise while quality falls. Inventory turns can improve while stockouts damage sales.
Assign one accountable owner per KPI, set a threshold that triggers a named action, and review exceptions rather than traffic-light colors. Re-baseline after acquisitions, pricing changes, ERP migrations, or shifts in customer concentration. Otherwise an improving KPI may only reflect a new data definition, not better performance.
Setting Targets From History, Capacity and Industry
The same number can mean opposite things in different business models. A published benchmark comparison in the BPR Global financial KPIs by industry guide reports that a 40% gross margin is strong in construction, where the median range is approximately 20% to 28%, but would be a warning sign in SaaS, where gross margins commonly run around 70% to 75%. Don't copy targets across industries.
Start with the formula. Gross margin equals gross profit divided by revenue. Then check it in this order. First, your own history on the same definition. Second, the peer range for your industry and pricing model. Third, capacity.
| Reference | Typical range or test | What it tells you |
|---|---|---|
| Own historical gross margin | Last 12 to 24 months on the same definition | Whether a change is real or caused by a data change |
| Construction peer range | Median roughly 20% to 28% | A 40% gross margin is strong here |
| SaaS peer range | Commonly 70% to 75% | A 40% gross margin is a warning sign here |
| Capacity model | Hours available at target utilization | Whether the target is reachable before hiring |
Separate levels of measurement. Job or project margin can reveal an underpriced contract while consolidated gross margin still looks acceptable. A construction owner reviews job margin and cost-to-complete variance weekly. A professional-services owner reviews project profitability and utilization. Comparing results through actual versus budgeted analysis that names the variance driver keeps the conversation on levers, not blame.
Capacity models test whether a target is reachable. We develop capacity models that show when new hires are financially justified, how long they will take to become profitable, and how hiring impacts cash flow and margins. Say a six-person delivery team has 1,800 available hours each. At a 70% utilization target, that's about 7,560 billable hours a year. A new hire is justified only when the added billable hours cover salary and overhead within the payback period you set in advance.
When a target is missed, name the operating lever before demanding a higher percentage. Price, labor efficiency, scope control, rework, purchasing, or client mix. Rewrite one current target this week so it names the lever it depends on and the benchmark it was checked against.
Building an Executive Dashboard and Review Rhythm
Your dashboard should give leadership one set of numbers so decisions are made from the same information every time. That's Step 4 in our framework, the Executive KPI Dashboard, which gives ongoing visibility into the metrics that drive profitability and enterprise value.
Apply the lens from the NIST Baldrige performance measurement guidance to every measure. Levels show current performance on a meaningful numerical scale. Trends reveal direction over time. Comparisons benchmark against budget, prior periods, and peers. Integration tests whether the measure aligns with strategy and is used consistently across processes.
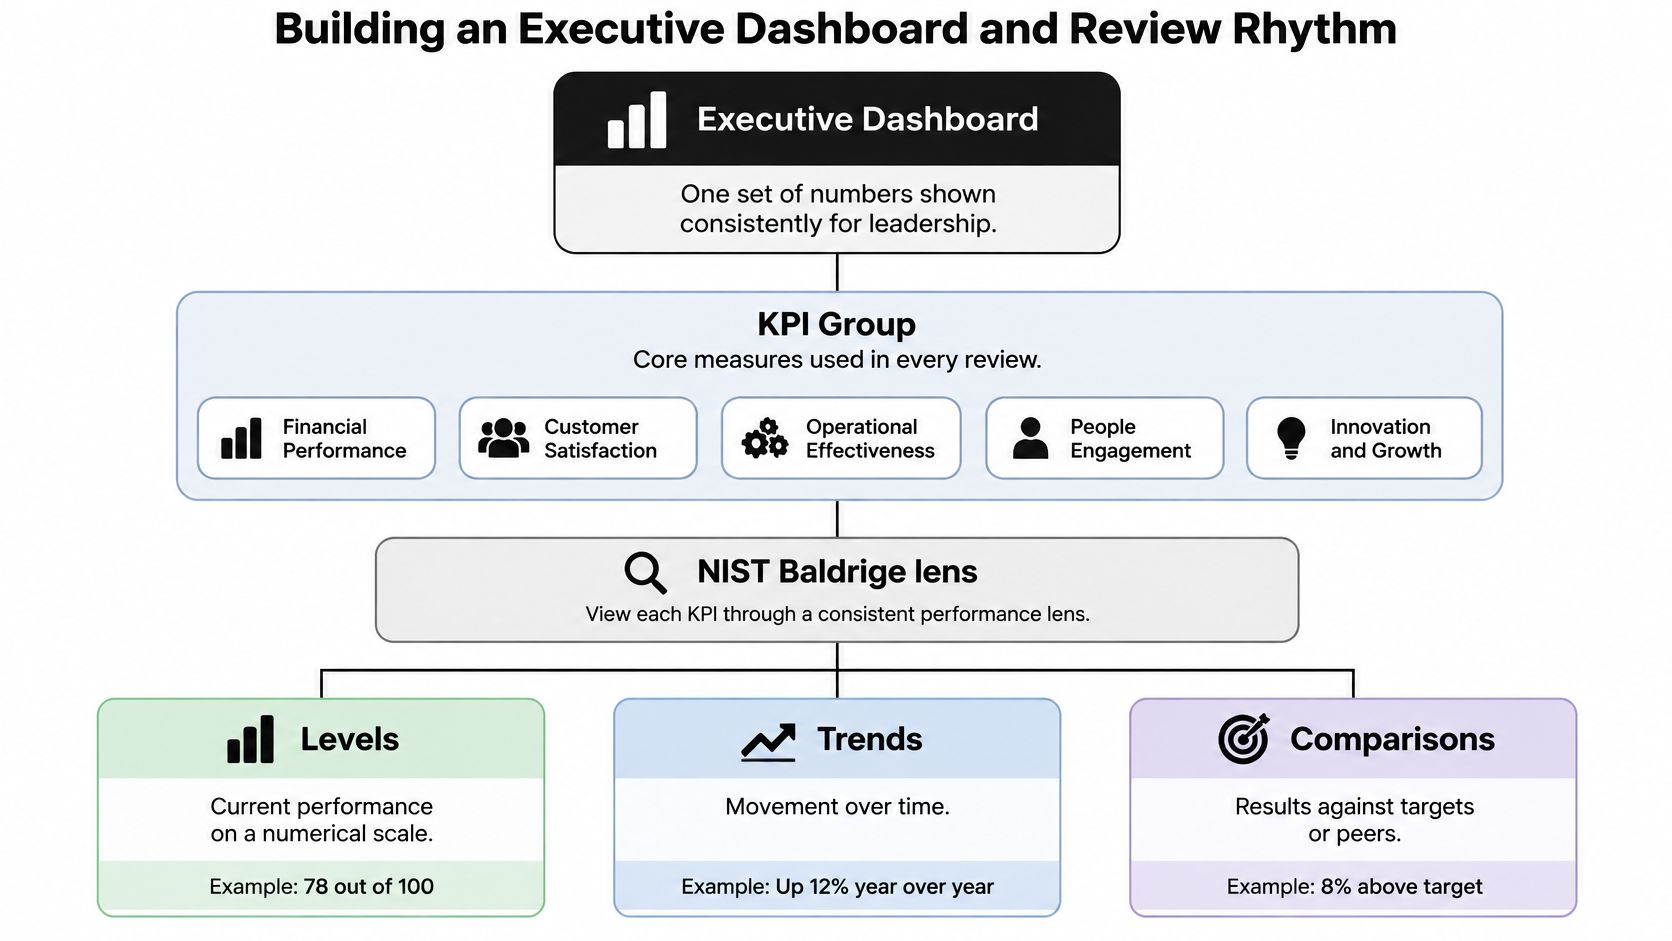
NIST also recommends examining financial performance trends over five years, starting with gross revenue, gross profit, and net profit. Add result categories that drive your objectives, such as customer retention, complaints, cycle time, workforce turnover, safety, and defects. Show gross margin monthly, against budget and prior periods, segmented by job or client.
For layout ideas from another operating context, KPI dashboards for government ICT recruiters show how different teams structure tiles by audience. Our own explanation of what a KPI dashboard should contain for executives covers the leadership view.
Each tile shows its owner, threshold, and the action that follows a miss. Review leading indicators weekly, lagging indicators monthly, and counter-metrics and definitions quarterly. In our engagements, the first 30 days are diagnostic, initial fixes are implemented by day 60, and by day 90 a fully operational forecasting system and executive dashboard are in place.
Start Your KPI Pilot This Quarter
A useful KPI pilot starts with one business objective and a reporting cycle the team can trust. Keep the scope narrow, then test whether the measure leads to a decision before adding more.
- Choose one objective this quarter. Complete the KPI definition worksheet, including the counter-metric.
- Pull 12 to 24 months of history. Apply one definition and set a baseline by job, customer, or service line.
- Run one reporting cycle. Reconcile the KPI to the general ledger or operating system before reviewing performance.
- Correct any reconciliation failures. Fix the definition, then check whether the threshold prompted the right action.
- Review with the owner. Keep, adjust, or retire the KPI before adding another.
If internal capacity is limited, an AmbitionCFO strategy session focuses on where profit is leaking, where cash is trapped, which metrics deserve executive attention, and the highest-ROI improvements available today. After the session, AmbitionCFO outlines how ongoing CFO support may help if the company is a fit. If it is not, you still leave with practical recommendations.
Bring your current management reports and completed worksheet to the session. Book with AmbitionCFO to discuss the financial issues that deserve attention now and the practical next steps for your business.