

Your supply chain numbers are really cash numbers. A late delivery can postpone an invoice. Excess inventory can absorb money needed for payroll, supplier payments, or equipment. A slow collection cycle can force an owner to borrow even when the income statement looks profitable.
This guide ranks 10 supply chain KPIs by how directly they convert operational performance into cash-flow decisions for distribution and construction businesses. Each metric includes its formula, a practical benchmark or baseline where verified data exists, and the dashboard location that makes it useful. Start with the three metrics your team can measure this month, then add the rest as your data improves.
Table of Contents
- 1. Lead Time from Order to Fulfillment
- 2. On-Time Delivery Rate
- 3. Perfect Order Rate
- 4. Inventory Turnover Ratio
- 5. Days Inventory Outstanding
- 6. Gross Margin by Product, Customer, or Job
- 7. Days Sales Outstanding
- 8. Days Payable Outstanding
- 9. Cash Conversion Cycle
- 10. Forecast Accuracy
- Top 10 Supply Chain KPI Comparison
- Turn These Ten KPIs Into One Monthly Dashboard
1. Lead Time from Order to Fulfillment
A customer places an order on Monday and your team ships on Friday. That gap drives more than service. It shapes how much stock you carry, when crews can schedule work, and how soon you can invoice and collect. That is why lead time ranks first in a cash-focused supply chain dashboard.
Track it by in-stock, make-to-order, project, and service work. Those flows behave differently. A construction supplier might turn standard fittings quickly and wait far longer on specialty equipment. One blended average hides the category that is tying up cash and causing missed promises.
Formula and dashboard placement
Use:
Lead time = Fulfillment date − Customer order date
Put it on the weekly operations panel. Show median and upper-range lead time by SKU, supplier, customer, location, and order complexity. Averages can smooth over the few orders that create the service failure and the cash delay.
Use your own baseline first. The SCOR performance framework places responsiveness alongside related operating measures, which is a good reminder to review lead time next to on-time delivery, capacity, and backlog. Define one owner, one review cadence, and one threshold that triggers action.
Practical rule: Shorter lead time creates cash value only when quality and delivery reliability stay intact.
Map the process from order receipt to fulfillment. Remove waiting, rework, and approval loops that do not change the order outcome. Then estimate how much safety stock you can trim without raising service risk.
Use committed supplier lead times, blanket orders, or vendor-managed inventory if they reduce uncertainty without pushing more inventory onto your balance sheet. For a useful outside example, see reducing lead times in 3D printing. Your reorder settings should also reflect actual lead-time variation, not a static assumption. This reorder point formula guide helps connect the KPI to a purchasing decision.

2. On-Time Delivery Rate
On-time delivery rate, or OTDR, answers a direct owner question: Can customers rely on the date we promised? Calculate it as:
OTDR = Orders delivered by the promised date ÷ Total orders × 100
Track the metric weekly. Segment it by customer, job site, carrier, product category, and internal versus external cause. A single company-wide score can look healthy while a rural project, key account, or critical-material category repeatedly misses its promise.
Formula and dashboard placement
Place OTDR in the customer service and revenue-risk section of the dashboard. Show the original promised date, actual delivery date, reason for variance, and whether the delay affects invoicing or retention.
Don't confuse a delivery that arrives on time with a complete, accurate order. ASCM separates on-time delivery from complete delivery, documentation accuracy, condition at delivery, and fulfillment cycle time in its SCOR digital guide. That separation helps you identify whether the problem is scheduling, inventory, picking, transportation, damage, or paperwork.
Set an internal completion date before the customer promise where the process supports it. Then review late deliveries in the 13-week cash-flow forecast. If a milestone invoice depends on delivery acceptance, OTDR is also an accounts-receivable leading indicator.
Carrier performance belongs in the same review. A recurring lane problem may require a revised customer promise or delivery charge rather than endless internal expediting. This middle-mile optimization guide provides additional context for analyzing transportation performance.
3. Perfect Order Rate
Perfect order rate measures whether the business delivered the entire customer promise in one pass. ASCM defines a perfect order as one delivered to expectation, complete, accurately documented, and without delivery damage. The formula is:
Perfect order rate = Perfect orders ÷ Total orders × 100
A shipment can be on time and still fail because it is short, damaged, or accompanied by incorrect paperwork. That makes perfect order rate more useful than a delivery-only score when owners want to understand complaints, returns, rework, and service cost.
Build one pass-fail record per order
Define the rules before measuring. Specify the required delivery date, complete quantity, acceptable condition, documentation requirements, and system of record. Then mark each order as perfect or not perfect. Don't average separate attribute percentages, because one failed attribute means the order wasn't perfect.
ASCM's Perfect Customer Order Fulfillment definition gives the calculation and the order-level approach. A company that completes 940 of 1,000 orders without lateness, shortages, documentation errors, or damage has a 94% perfect-order rate.
Place POR on the weekly customer-experience panel, with a cause breakdown beneath it:
- Inventory shortage: Review purchasing, safety stock, and supplier reliability.
- Picking or packing error: Review warehouse process and training.
- Carrier delay: Review lane, carrier, and promise-date assumptions.
- Damage: Review packaging, handling, and freight claims.
- Documentation error: Review order entry, invoicing, and approval controls.
The cash connection is straightforward. A failed order can create a second shipment, delayed billing, credit memos, or lost repeat business. Fix the failure category, not just the percentage.
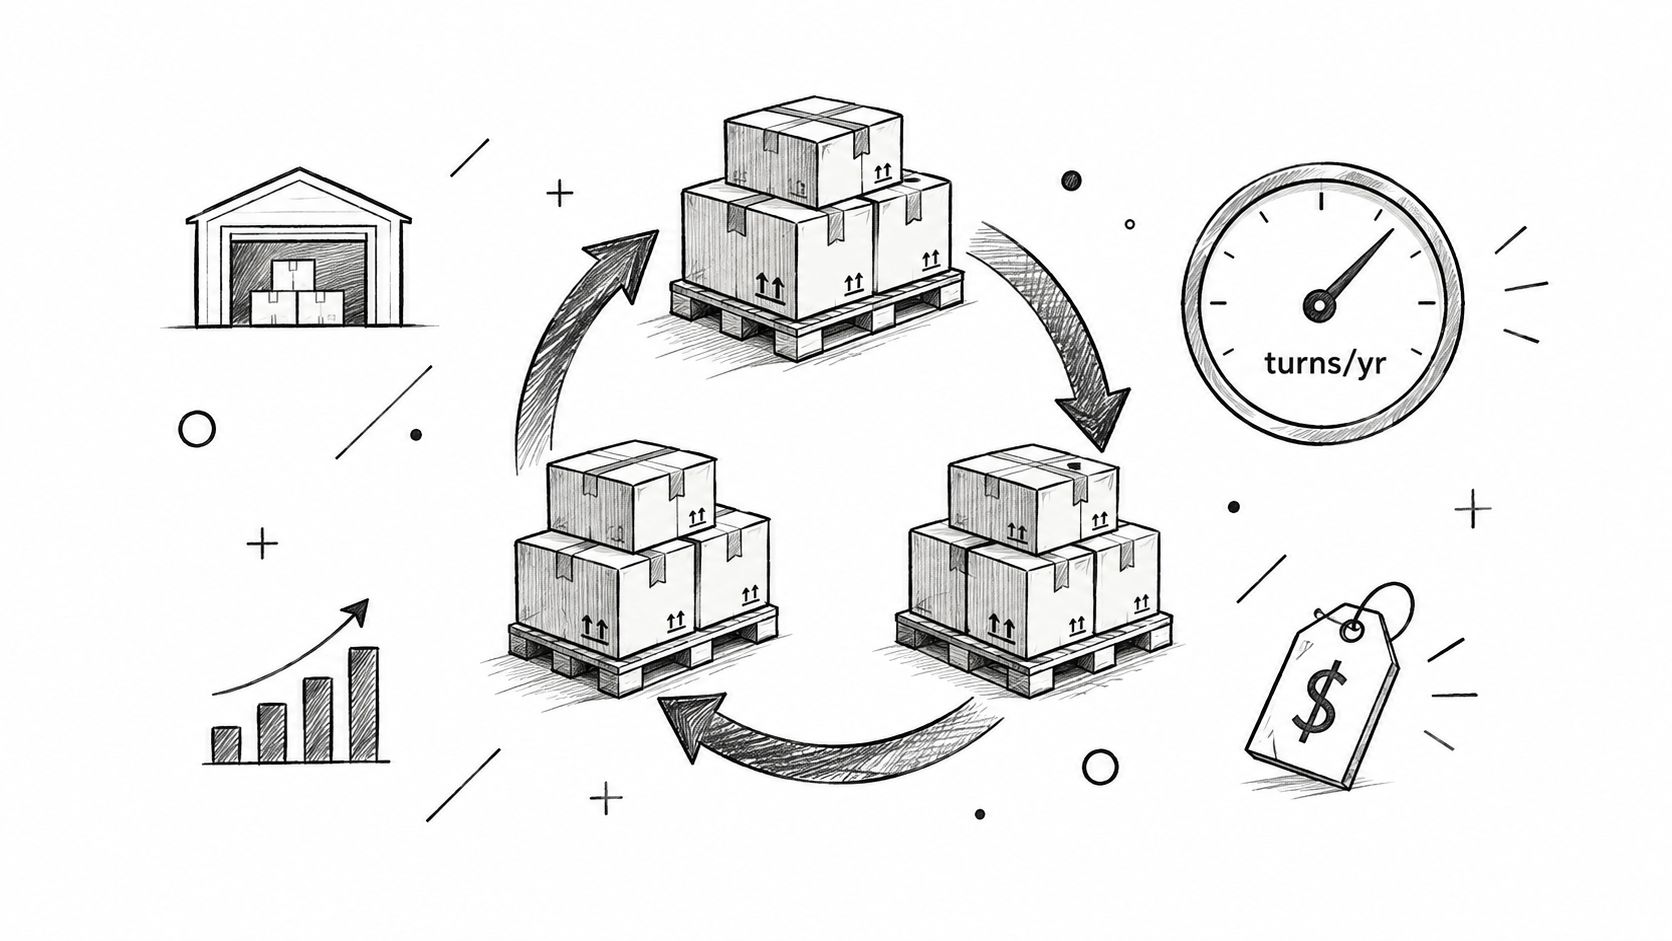
4. Inventory Turnover Ratio
Inventory turnover shows how frequently the business converts inventory into sales. Use:
Inventory turnover = Cost of goods sold ÷ Average inventory
The metric belongs in the working-capital panel, beside gross margin, stockouts, obsolete inventory, and on-time-in-full delivery. Higher turnover generally means inventory is moving more frequently, but an excessively high result can indicate understocking or inadequate buffers.
Use context instead of a universal target
A U.S. manufacturing benchmark reported an inventories-to-shipments ratio of 1.47 in July 2026, equivalent to approximately 1.5 months or 45 days of shipments. The same benchmark describes typical manufacturers as generating roughly 4 to 6 turns per year, strong operators reaching 8 to 10 turns, and demand-driven, world-class operations exceeding 12 turns. These figures come from the manufacturing inventory benchmark, but they aren't a universal target for every distributor or contractor.
Segment turnover by product, branch, project, and customer demand pattern. A fast-moving category may fund the business while specialty stock consumes cash. Review purchasing claims such as “buy more to save” against actual turns, gross margin, stockout frequency, and obsolescence.
A high turnover number isn't automatically good. If customers face frequent stockouts, the business may be converting inventory quickly by refusing demand.
Calculate turnover monthly. Tie supplier performance and purchasing policy to the result. When the number falls, inspect aging, open purchase orders, demand changes, and project cancellations before adding more stock.

5. Days Inventory Outstanding
Days inventory outstanding, or DIO, translates turnover into the number of days cash remains invested in stock. Use either formula:
DIO = 365 ÷ Inventory turnover
or:
DIO = Average inventory ÷ Cost of goods sold × 365
Place DIO in the cash dashboard, directly beside inventory value, stockout cost, obsolete stock, and supplier lead-time variance. Owners can understand “days of cash tied up” faster than a turnover ratio alone.
Connect inventory days to a decision
If turnover is 6.67 times, DIO is approximately 55 days, calculated as 365 ÷ 6.67. That result doesn't tell you whether the level is right by itself. A project-based contractor, industrial distributor, and fast-moving supplier can have different replenishment cycles and service requirements.
Track DIO by A, B, and C product class, and separate in-stock products from make-to-order work. A falling DIO may reflect better purchasing, faster fulfillment, or a stockout problem. Review it alongside perfect orders and availability before approving a reduction in inventory.
The cash translation is:
Cash released = Inventory value × Change in DIO ÷ 365
Use this calculation to compare an inventory reduction with alternatives such as a second supplier, revised payment terms, or a different customer promise. Global research found that 42% of executives considered supplier diversification more effective than holding inventory for resilience, while 20% favored inventory as the stronger measure. Average inventory coverage also fell from 10.2 weeks in 2022 to 8.6 weeks in 2024, according to Trade in Transition research.
For a practical explanation of the ratio behind DIO, use this guide to what a good inventory turnover ratio is.
6. Gross Margin by Product, Customer, or Job
Supply chain decisions can improve revenue while damaging profitability. Gross margin by product, customer, or job prevents that outcome.
Gross margin = Revenue − Direct costs
You can also express it as a percentage:
Gross margin percentage = Gross margin ÷ Revenue × 100
Place this metric in the owner and commercial dashboard, not only in the accounting close. A distributor may earn acceptable margin on the product while losing money through special freight, frequent small deliveries, returns, or high-touch service. A contractor may win a project that looks profitable until labor overruns, procurement changes, and rework are assigned correctly.
Make the margin actionable
Use job costing or cost centers to assign direct material, labor, freight, subcontractor, and project-specific costs. Review margin by customer, product family, branch, geography, sales channel, and job. The most useful view includes gross-margin dollars as well as the percentage.
The customer profitability analysis guide can help structure that review. The question isn't just, "Which customer buys the most?" Ask which customers and projects produce enough contribution to justify their service requirements and working-capital burden.
Pair margin with service KPIs. A low-margin account with high delivery complexity may require a price change, minimum order policy, delivery surcharge, or revised terms. A strong account may justify inventory priority because reliable availability protects profitable revenue.
Sales incentives should include gross-margin dollars, not just revenue. Otherwise, salespeople can grow the top line by accepting work that consumes warehouse capacity, field labor, or cash without creating adequate return.
7. Days Sales Outstanding
Days sales outstanding, or DSO, measures how long customers take to pay after a sale. Use:
DSO = Average accounts receivable ÷ Revenue × Number of days
Place DSO in the cash-collection panel, with an accounts-receivable aging view by customer. The formula gives a company-wide trend. The aging schedule tells you who is creating the trend and why.
Use DSO to manage collection timing
Review DSO weekly or biweekly when cash is tight. Split receivables into 0 to 30, 30 to 60, 60 to 90, and 90-plus days. Assign an owner and next action to every material overdue balance. The operations team should know when a disputed delivery, missing document, or incomplete project milestone is blocking collection.
Construction owners should connect billing to approved work, signed change orders, lien requirements, and milestone acceptance. Distributors should check proof of delivery, invoice accuracy, credit limits, and customer-specific payment habits.
Don't treat every customer the same. A large account that pays slowly may need revised terms or a deposit. A smaller account with repeated disputes may need a credit hold. ACH and card options can remove avoidable payment friction, but payment fees should be compared with the cash value of faster collection.
The decision supported by DSO is clear: should you change terms, escalate collections, fix billing, or restrict credit? Review it with gross margin so the sales team doesn't protect low-quality revenue at the expense of liquidity.
8. Days Payable Outstanding
Days payable outstanding, or DPO, measures how long the company takes to pay supplier invoices. Use:
DPO = Average accounts payable ÷ Cost of goods sold × Number of days
Place DPO in the supplier and financing panel, alongside payment terms, early-payment discounts, supplier criticality, and overdue invoices.
A higher DPO can preserve cash, but only when the company honors agreed terms and protects important supplier relationships. Delaying payment beyond the agreement can reduce availability, damage trust, eliminate discounts, or cause suppliers to tighten credit.
Negotiate with a supplier map
Separate suppliers by criticality, substitutability, lead time, and bargaining position. Negotiate longer terms where the supplier can support them. Don't apply a blanket policy that treats a strategic equipment supplier and a replaceable office vendor as identical.
Compare an early-payment discount with the company's borrowing cost. Paying early makes sense when the discount creates more value than the cash would create elsewhere. Otherwise, preserve liquidity within the agreed terms.
Review AP aging weekly during a cash squeeze. Prioritize invoices that protect critical materials, contractual obligations, and supplier continuity. DPO should never be optimized without service and quality measures. A payment policy that saves cash but causes supplier disruption can raise lead time, expedite cost, and inventory requirements.
The owner decision is practical: which invoices should be paid now, which terms should be renegotiated, and which suppliers require relationship protection?
9. Cash Conversion Cycle
Cash conversion cycle, or CCC, measures the number of days cash remains committed between paying suppliers and collecting customer cash. Use:
CCC = DSO + DIO − DPO
A practical example is 55 inventory days + 35 receivable days − 40 payable days = a 50-day cash-to-cash cycle. The calculation is described in SCOR-related cash-to-cash research.
Place CCC at the top of the monthly owner dashboard, with DSO, DIO, and DPO displayed beneath it. CCC is a summary metric. It tells you the direction of working capital, but its components tell you which decision can change it.
Model the cash consequence
If annual operating cash costs are $12 million, reducing the cycle by 10 days can release approximately $328,767, calculated as $12 million ÷ 365 × 10, assuming the reduction doesn't defer an unavoidable payment or create service problems. Use the figure as a planning estimate, not as permission to cut inventory or stretch suppliers without analysis.
SCOR identifies cash-to-cash cycle time, inventory days of supply, and asset turns as core asset-management measures. Track the components monthly and use a rolling 13-week cash-flow forecast to test timing.
A distributor might reduce DIO through better replenishment. A contractor might reduce DSO through faster approvals and milestone billing. A company with strong supplier relationships might improve DPO within agreed terms. The right move depends on the constraint.
Don't celebrate a shorter CCC if gross margin, perfect orders, or supplier reliability deteriorates. Cash efficiency must support the customer promise.
10. Forecast Accuracy
Forecast accuracy shows whether the numbers you are using to buy, staff, and schedule are close enough to support cash decisions. Use:
Forecast accuracy = 1 − (|Forecast − Actual| ÷ Actual)
Put it in the monthly planning and finance panel and break it out by revenue stream, customer, product category, project, and cost center. That dashboard placement matters. One company-wide score can look acceptable while revenue is overstated in one area and costs are understated in another. Owners need to see where the miss sits before it reaches cash.
Use forecasts to trigger decisions
Keep the annual budget and the rolling forecast separate. The budget sets the target. The rolling forecast updates expected revenue, labor, purchasing, collections, and cash needs as conditions change, so each monthly review leads to a clear operating decision.
Better demand and supply planning supports forecast accuracy and working-capital control. Analysts at AlixPartners link stronger sales and operations planning with less inventory tied up, fewer expedites, better margins, and stronger product availability in an AlixPartners supply-chain market update. See the Wistec supply chain guide Australia for additional planning context.
Update the forecast monthly, or more often when projects and demand shift quickly. Separate bias from volatility. A forecast that stays too optimistic needs different assumptions. A forecast that swings both ways needs better demand signals and scenario ranges.
Review forecast versus actual in every operations meeting. Investigate material variances, document the changed assumption, and assign the next action. A budget versus actual variance analysis guide gives a practical structure for turning those variances into decisions.
Top 10 Supply Chain KPI Comparison
| Metric | Implementation complexity | Resource requirements | Expected outcomes | Ideal use cases | Key advantages |
|---|---|---|---|---|---|
| Lead Time from Order to Fulfillment | Medium, process mapping & cross‑functional changes | Order tracking, supplier coordination, process redesign | Shorter fulfillment, lower inventory, faster cash conversion | Make‑to‑order, distribution, competitive service offerings | Reduces carrying costs, reveals bottlenecks, speeds AR |
| On‑Time Delivery Rate (OTDR) | Low–Medium, track promised vs actual dates | Order management, carrier data, basic reporting | Improved delivery reliability and customer retention | Distribution, construction, service delivery with SLAs | Direct customer trust metric, easy to measure |
| Perfect Order Rate (POR) | High, requires integrated systems & QA | Integrated OMS/WMS, QA, cross‑functional data | Fewer returns/rework, higher satisfaction & retention | Companies prioritizing end‑to‑end service quality | Holistic view of operational health and customer experience |
| Inventory Turnover Ratio | Medium, accounting accuracy & segmentation | Accurate inventory records, COGS data, ERP/WMS | Faster inventory turns, freed working capital | Retail, distribution, manufacturing managing stock | Identifies slow SKUs, drives purchasing and pricing decisions |
| Days Inventory Outstanding (DIO) | Low–Medium, derived metric from turnover | Inventory valuation, turnover data, SKU segmentation | Clear days-on-hand view, informs reorder/safety stock | Mid‑market firms tuning inventory policies | Translates turns into calendar days for planning |
| Gross Margin by Product/Customer/Job | High, detailed cost allocation & job costing | Job costing, time tracking, granular COGS data | Reveals true profitability, better pricing decisions | Services, projects, distributors with mixed margins | Identifies unprofitable customers/products for action |
| Days Sales Outstanding (DSO) | Medium, AR discipline and reporting | AR system, collections process, payment options | Faster cash collection, improved liquidity | B2B sellers, services, subscription businesses | Direct cash impact, highlights credit/payment risk |
| Days Payable Outstanding (DPO) | Medium, AP process & supplier negotiation | AP system, supplier segmentation, negotiation capability | Extended cash on hand, working capital flexibility | Firms seeking short‑term financing via terms | Effectively free short‑term financing when managed well |
| Cash Conversion Cycle (CCC) | Medium–High, combines multiple metrics | Consolidated AR/AP/inventory reporting, modeling | Single view of working capital, prioritizes cash initiatives | Mid‑market companies optimizing liquidity | Prioritizes highest‑impact improvements in cash tie‑up |
| Forecast Accuracy (Budget vs Actual) | High, forecasting processes & discipline | FP&A tools, clean data, forecasting skillset | Better planning, fewer surprises, improved cash mgmt | Volatile operations, planning‑intensive businesses | Enables credible planning and proactive working capital decisions |
Turn These Ten KPIs Into One Monthly Dashboard
Don't launch all ten metrics at once. Start with lead time, on-time delivery, and cash conversion cycle. Write the formula for each metric, name one owner, and set a review cadence. Bring the results to your next monthly close.
Those three metrics give you an operating, customer, and cash view. Lead time shows how quickly work moves. OTDR shows whether the business keeps its promises. CCC shows how long operating cash remains committed. Together, they reveal whether a service improvement is funded efficiently or purchased through excess inventory, overtime, premium freight, or loose credit.
Once the definitions are stable, add perfect order rate. It exposes the failures that on-time delivery misses. Then add inventory turnover and DIO to understand whether stock is productive or occupying cash and warehouse space. Add DSO and DPO to make collection and supplier-term decisions visible. Add gross margin by customer, product, or job so the company doesn't grow unprofitable work. Finish with forecast accuracy so owners can connect operating changes to payroll, purchasing, financing, and expansion decisions.
Every KPI needs five controls:
- Definition: State the numerator, denominator, date rule, and exclusions.
- Owner: Name the person responsible for investigating variance.
- Cadence: Review operational metrics weekly and financial trends monthly.
- Decision threshold: Specify when the result triggers repricing, purchasing changes, collection escalation, or a cash action.
- Segmentation: Break results down by customer, SKU, supplier, job, location, or business unit where the aggregate can hide risk.
A clean dashboard isn't a collection of impressive numbers. It is a decision system. A late-delivery trend can change a promise date. Rising DIO can pause a purchase order. A deteriorating DSO can change credit terms. Weak margin by job can change pricing before the next contract is signed.
For a $10M to $100M founder-led business, those decisions can determine whether growth creates cash or consumes it. If you want help building a 13-week cash flow model and a KPI dashboard around these numbers, contact AmbitionCFO and schedule a working session on your numbers.
AmbitionCFO provides fractional CFO support for founder-led construction, distribution, and professional services businesses, including 13-week cash-flow modeling, margin analysis, forecasting, and KPI dashboards. Visit AmbitionCFO to connect your supply chain metrics to the cash decisions that keep your business growing.