

Most founders search for overhead reduction when margins tighten and cash feels less predictable. The popular advice is familiar: freeze hiring, cut headcount, renegotiate vendors, and remove anything that doesn't appear to produce revenue. That approach can lower a few visible expenses quickly, but it can also remove the coordinators, estimators, project managers, and systems that protect gross margin.
The better question is more precise: How much cost does your business require to deliver one profitable job, customer, route, or billable hour, and which part of that cost is avoidable? Structural overhead reduction redesigns the work behind the expense. It protects delivery capacity, improves cost per unit of output, and connects every decision to job-level margin and cash flow.
Table of Contents
- Redefining Overhead Reduction for Founder-Led Firms
- Diagnosing Cost Pools and Job-Level Margins
- Redesigning Processes to Eliminate Administrative Waste
- Aligning Cost Initiatives with 13-Week Cash Flow Models
- Building KPI Dashboards for Sustainable Margin Protection
- Navigating Inflation and Avoiding Common Reduction Pitfalls
Redefining Overhead Reduction for Founder-Led Firms
Overhead reduction fails when it removes the capacity that produces gross profit. A lower expense line matters only if the business still delivers the same or better output, quality, billing speed, and job-level margin.

Measure capacity before cutting it
Start with cost per unit of output, not a blanket percentage target. A construction company could track overhead per completed labor hour or profitable job. A distributor might measure support cost per order or route. A professional-services firm should examine gross profit per delivery hour alongside utilization, rework, and unbilled time.
The objective is to see which costs support profitable capacity and which costs absorb cash without improving delivery. Allocate overhead to jobs, customers, routes, or service lines where practical, then compare the allocation with the margin each unit generates. A department that looks expensive in isolation may protect high-margin work. A smaller cost pool may still create repeated errors, delays, or write-offs.
Automation adds another layer to the decision. Recent small-business evidence found that 71% of surveyed firms reported AI-related productivity gains, while more than 70% saw no change in labor costs or spending on outside services. That result suggests automation can create capacity before it reduces structural overhead.
Use the released time deliberately. It might support more work without hiring, faster customer responses, lower overtime, or more complete billing. Before eliminating a role, document the work it absorbs, the output it protects, and whether the capacity can be reassigned to profitable activity. For practical ideas on connecting automation with process economics, see MakeAutomation on operational efficiency.
Redesign the cost structure, not just the budget
Structural reduction can require an upfront expense. Better systems, training, stronger project leadership, or a higher-value employee may raise near-term spending while reducing cost per job and overhead as a share of revenue. Approve that trade only when the expected effect is visible in margin, throughput, and the 13-week cash flow forecast.
Temporary cuts often return because the underlying process remains unchanged. McKinsey's analysis of 238 companies found that only 26% sustained their reductions for four years, according to the McKinsey analysis of G&A cost reductions. A durable reduction needs a named owner, a redesigned workflow, and a recurring control that prevents the old cost from returning as volume increases.
Practical rule: Approve a cut only after identifying the process change, the protected output, the job-level margin effect, and the cash timing.
Diagnosing Cost Pools and Job-Level Margins
Start with a baseline, not a target. Pull the prior period's general and administrative expenses, then group them into useful cost pools: administration, technology, facilities, vehicles, insurance, sales support, finance, human resources, and management. Assign each pool to an operating unit, branch, job type, customer segment, or delivery team where the data allows.
Then classify the work behind each cost:
- Value-adding activity: Work the customer pays for or that directly improves profitable delivery.
- Necessary support: Work required for compliance, control, safety, billing, or reliable operations.
- Avoidable activity: Duplicate approvals, manual re-entry, preventable errors, idle capacity, excess reporting, and work caused by poor upstream data.
Calculate each pool as a percentage of revenue. Also calculate the cost per job, customer, employee, transaction, labor hour, or route. The percentage tells you whether the structure scales. The unit cost tells you whether the process is becoming more productive.
Construction benchmarks show why segmentation matters. Fiscal-year 2024 industrial and nonresidential contractors reported SG&A averaging 7.3% of revenue, while an all-contractor benchmark for fiscal 2023 was 11.8%, with best-in-class firms at 10.8%, according to construction overhead benchmarking data. These figures are diagnostic ranges, not automatic mandates. Project mix, geography, company size, and utilization can justify different structures.
Allocate shared overhead to the work
A job can appear profitable when it covers direct labor and materials but fails to cover shared supervision, facilities, vehicles, and administration. Assigning overhead to jobs makes that leakage visible.
For a construction business, a practical formula is:
Overhead rate = total overhead ÷ total direct labor cost
Then:
Job overhead = the job's direct labor cost × overhead rate
A labor-hour version uses total overhead divided by total direct labor hours, then applies that hourly rate to each job. If annual overhead is $500,000 and Job A represents 20% of total annual labor hours, Job A absorbs $100,000 of overhead. That allocation doesn't change cash, but it changes pricing discipline and reveals whether the job is carrying its share of the business.
Use the appropriate base for the operating model:
| Allocation Base | Best Suited For | Calculation Method |
|---|---|---|
| Revenue | Businesses with broadly proportional support needs | Total overhead divided by total revenue, then applied to job or customer revenue |
| Direct labor hours | Labor-intensive construction and service work | Total overhead divided by total direct labor hours, then multiplied by job hours |
| Direct labor cost | Businesses where wage cost reflects delivery complexity | Total overhead divided by total direct labor cost, then multiplied by job labor cost |
| Total direct costs | Larger commercial projects with varied labor and material inputs | Total overhead divided by total direct costs, then applied to each project |
Owners who need a deeper explanation of the mechanics can review job costing fundamentals. The immediate exercise is to recalculate margin by job or client after assigning shared costs. Look for underpriced contracts, rush freight, overtime, rework, and unbilled time before cutting customer-facing capacity.
Redesigning Processes to Eliminate Administrative Waste
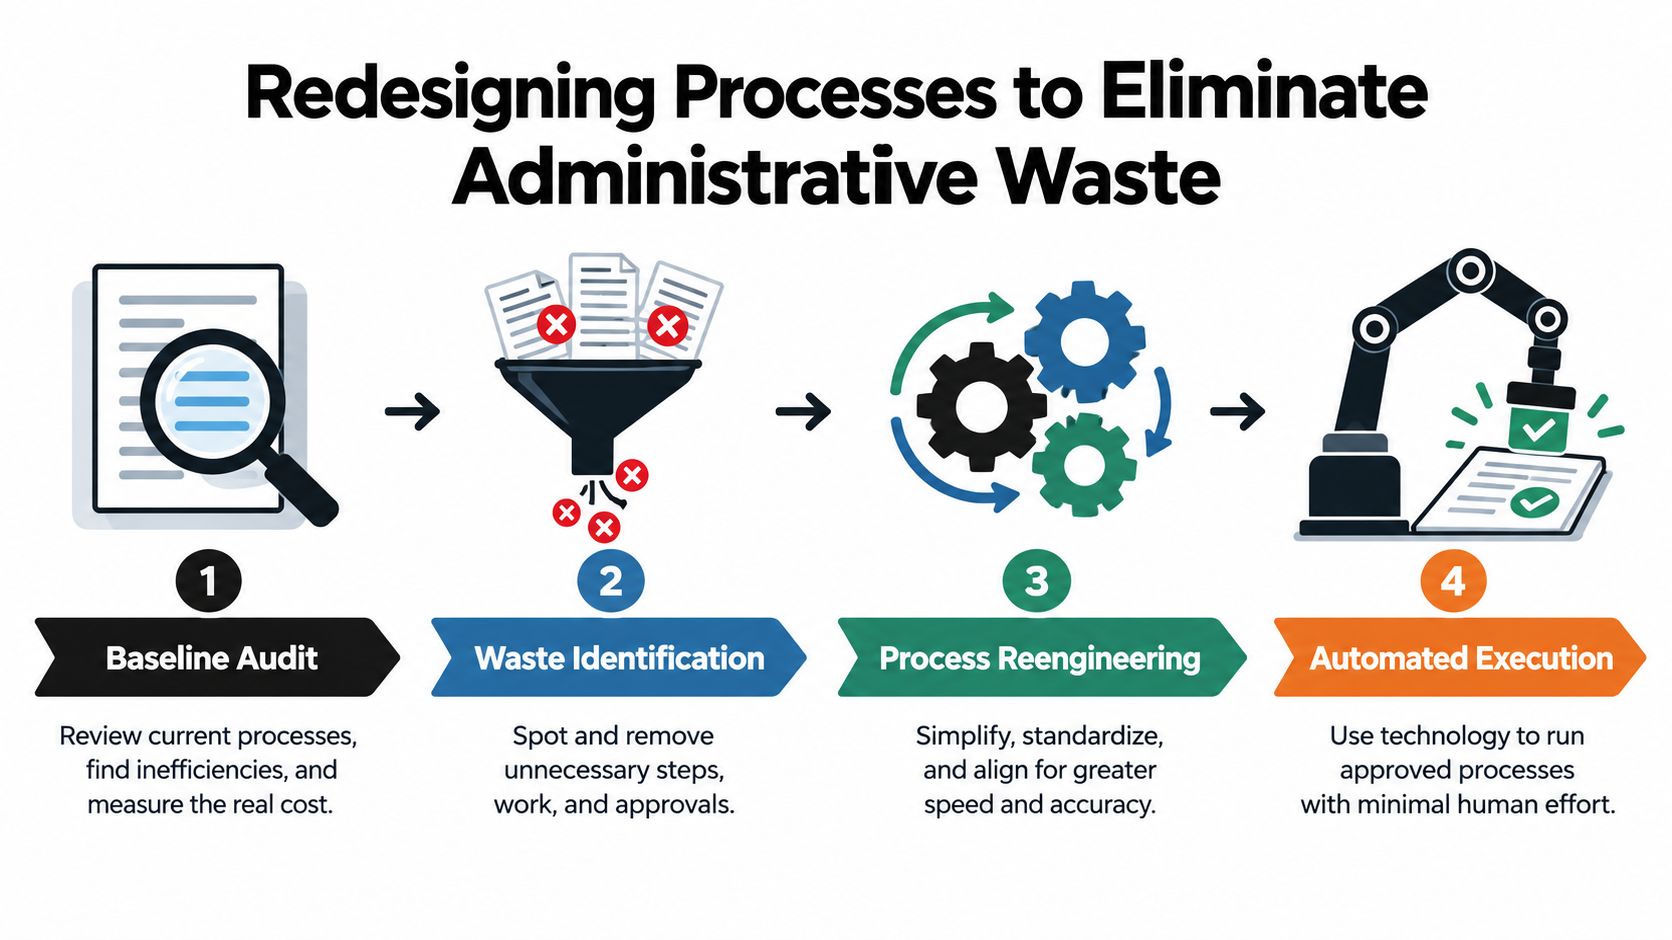
Overhead often grows because work moves badly. An invoice gets entered twice, a purchase waits for several approvals, a project manager rebuilds a schedule from incomplete information, or finance spends hours correcting a field error. The expense appears in payroll, but the root cause is process design.
Map the full workflow
Choose one process with visible friction, such as quote-to-cash, procure-to-pay, employee onboarding, or month-end close. Map every handoff from the initial request to the completed outcome. Record who performs each step, what system they use, what information they need, how long the work waits, and what causes rework.
Don't optimize one isolated task while leaving the surrounding defects intact. If accounts payable removes a data-entry step but purchase orders still contain incomplete job codes, the error appears later during reconciliation. Finance teams can use a practical guide for finance teams on reconciliation when evaluating where manual matching and correction consume capacity.
Assign a baseline cost to each delay and rework loop. A simple worksheet can include:
- Process step: What happens?
- Owner: Who performs it?
- Volume: How often does it occur?
- Touch time: How much labor does it consume?
- Wait time: How long does it sit?
- Error cost: What correction follows?
- Customer effect: Does it delay delivery, billing, or response?
- Control risk: What could go wrong if the step changes?
Prioritize changes that protect output
Rank opportunities by expected annual savings, implementation effort, customer risk, and cash timing. A minor administrative convenience may not deserve attention if a scheduling defect causes missed labor utilization or billing delays.
Lean manufacturing provides historical evidence of the possible range, but not a universal promise. A RAND review of lean pilot programs reported claimed reductions of 5% to 81% in direct labor hours and cycle-time reductions of 13% to 93% in defense manufacturing programs. RAND cautioned that the evidence wasn't systematic enough to change broad historical cost-estimating methods. The relevant lesson is narrower: removing idle time, excess handling, inventory buffers, and rework can reduce the infrastructure needed for the same output.
A 2025 study of 268 lean interventions found that 73.9% implemented the recommended changes, 55.6% achieved a financial benefit, and 49% reduced lead time, as reported in the study of lean intervention outcomes. Implementation discipline separates useful redesign from a workshop that produces no operating change.
Pilot one intervention, measure before and after cycle time, labor hours, errors, and cost per transaction, then standardize the new method. A system upgrade may support the redesign, but software should follow a defined process. Use this finance systems upgrade resource to evaluate whether the current tools create unnecessary manual work or expose a process that hasn't been clarified.
Aligning Cost Initiatives with 13-Week Cash Flow Models
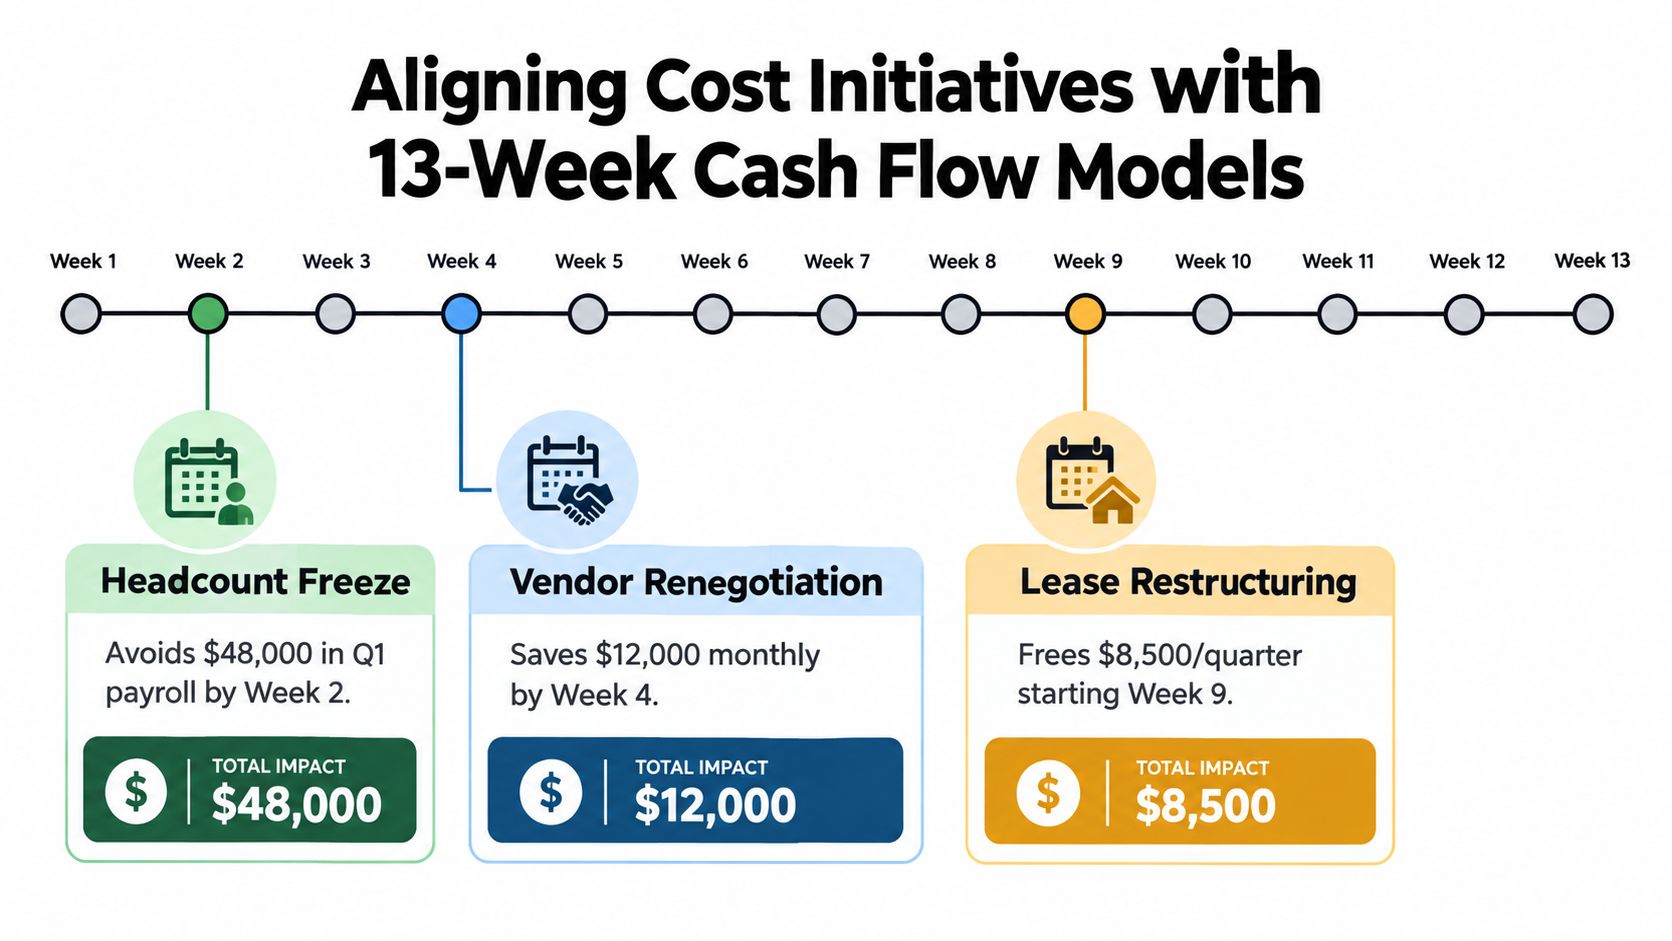
A P&L saving isn't automatically a cash saving. A cancelled subscription may reduce expense next month. A lease renegotiation may produce relief later. A severance payment can create a cash outflow before payroll savings arrive. The 13-week cash flow model forces each initiative onto a calendar.
For every proposed action, record the decision date, implementation cost, first cash benefit, recurring benefit, service risk, and accountable owner. Then place the effect in the weekly forecast rather than treating it as an annualized promise.
Match the action to the cash need
Suppose vendor consolidation requires a transition effort but reduces monthly invoices after implementation. The forecast should show the transition cost, the first payment affected, and any deposit or termination obligation. A headcount freeze avoids future payroll only if the forecast includes the hiring plan that would otherwise have occurred. Lease restructuring may improve liquidity later while doing nothing for an immediate payroll gap.
Working capital deserves equal attention. PwC's working-capital guidance reports that optimization can free up an average of 20% to 30% of funds tied up in working capital and may pay back within a few months. Review receivables, inventory, and payables together. Faster collections, lower excess inventory, and disciplined payment timing can reduce warehouse expense, write-offs, replenishment work, and borrowing pressure.
Cash discipline: A saving that arrives after the cash crisis isn't an available solution. Model the timing before approving the initiative.
Use the forecast as an operating tool
Update the model weekly with actual receipts, payroll, supplier payments, debt service, and initiative performance. Add a downside case for delayed customer collections, slower backlog conversion, or a service problem caused by the change. Protect minimum cash needed for payroll, critical suppliers, insurance, and delivery commitments.
The 13-week cash flow modeling resource provides a useful structure for connecting operating decisions to liquidity. The model should answer three questions every week:
- Which planned savings arrived?
- Which expected cash inflows moved?
- What decision must change before the next payroll or supplier cycle?
That cadence prevents founders from funding a long-term redesign with short-term liquidity they don't have.
Building KPI Dashboards for Sustainable Margin Protection
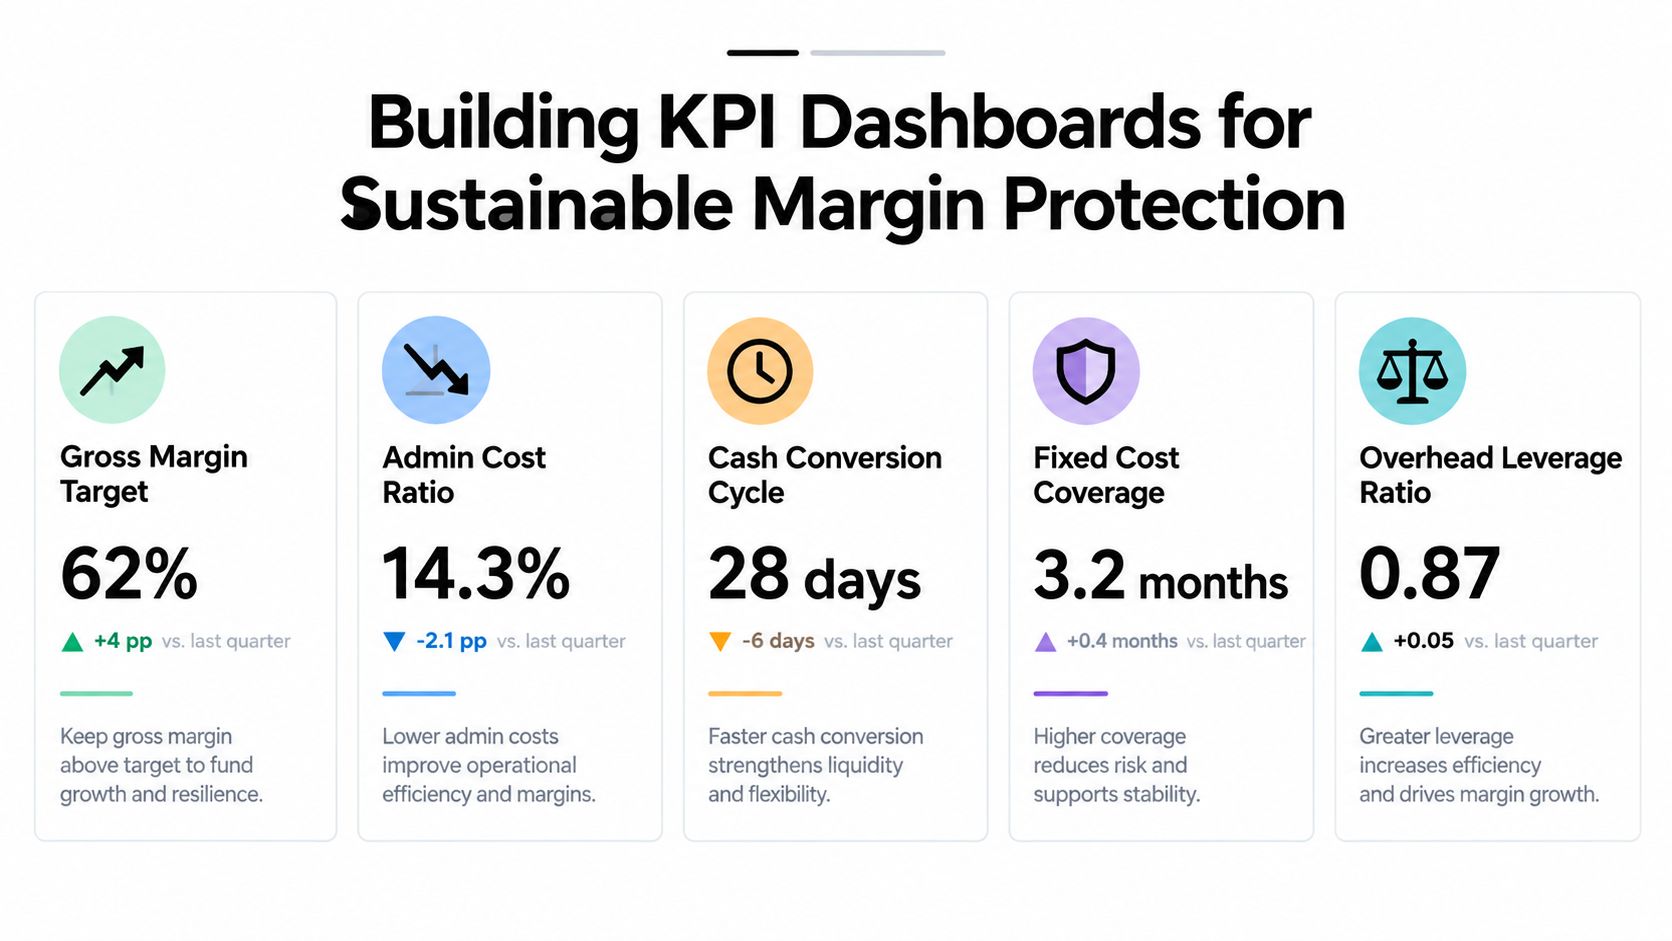
Cost reduction lasts only when managers can see drift before it reaches the annual budget. A dashboard should connect resources to profitable output, showing whether cost per unit of delivery is improving or whether a cut has reduced capacity. That distinction protects gross margin from savings that look attractive in an expense report but weaken job performance.
Track revenue per employee, gross profit per delivery hour, utilization, rework, billing velocity, and cash conversion. Choose measures that fit the operating model, then connect them to job-level margin allocation and the 13-week cash forecast. A service firm may prioritize delivery hours and rework, while a project business may need tighter visibility into change orders, billing delays, and unproductive coordination time.
Give every cost pool an owner
An expense category without an accountable owner becomes a shared concern that nobody manages. Assign responsibility for technology, facilities, vehicles, administrative staffing, and other material pools. Each owner should explain monthly variance, identify the operating driver, and recommend a response when cost per unit deteriorates.
Set a monthly dashboard review, with a shorter weekly check for indicators tied to cash, capacity, or delivery. A variance needs context. Higher software expense may support greater throughput, while lower payroll may indicate lost capacity. Review the financial movement alongside output, gross margin, service quality, and billing speed.
A useful dashboard includes:
| Metric | What it reveals | Management question |
|---|---|---|
| Revenue per employee | Whether capacity is scaling with revenue | Are we adding people faster than profitable work? |
| Gross profit per delivery hour | Whether labor creates sufficient margin | Which work consumes time without adequate contribution? |
| Utilization | Whether available capacity is productive | Is idle time caused by demand, scheduling, or process failure? |
| Rework | Whether defects consume paid capacity | Where does the first error enter the workflow? |
| Overhead as a percentage of revenue | Whether the structure scales | Are fixed costs growing faster than revenue? |
Use a KPI dashboard design framework to define formulas, data sources, owners, thresholds, and review frequency before adding more measures. A small set of trusted indicators is more useful than a crowded report that managers cannot validate.
Durability requires controls after implementation, not just approval at launch. Treat overhead as a recurring operating system: review variance monthly, test whether savings remain visible in cost per unit and job margin, and set a stop rule if service quality, billing velocity, or gross margin deteriorates. That governance catches capacity loss before a lower expense line becomes a weaker business.
Navigating Inflation and Avoiding Common Reduction Pitfalls
Inflation changes the question. Cutting administrative expense won't protect profitability if wages, suppliers, energy, rush freight, overtime, and project inputs are rising faster than revenue. In a 2025 survey of more than 2,200 U.S. businesses with up to 100 employees, 50% identified inflation as their leading challenge. Respondents most often cited wages at 39%, domestic supplier costs at 36%, and energy at 28%, according to the 2025 small-business inflation survey.
A construction company may respond by cutting an estimator or project coordinator. That can look like overhead reduction until underpriced work, missed change orders, procurement delays, and billing errors reduce gross margin. The safer response is to separate the cost problem.
Decide what kind of cost you have
True overhead includes shared resources that don't attach cleanly to one job or client. Test these costs for process waste, duplication, unused capacity, and supplier inefficiency.
Delivery-critical cost supports output. Cutting it requires a contribution-margin test, not a department target. If removing a coordinator delays invoices or causes rework, the business may save payroll while losing cash and profit.
Underpriced direct cost belongs in the commercial model. Reprice, add escalation language, pass through the cost where contracts allow, or redesign delivery. Treating it as overhead and cutting support around it won't solve the margin problem.
Capacity investment may increase spending before it improves the ratio. A stronger system, training, or higher-value employee can be justified when the owner measures output, utilization, and gross profit rather than demanding an immediate nominal reduction.
Generic targets fail because overhead varies by size, project mix, geography, and capacity utilization. A peer benchmark should identify a gap for investigation, not authorize a uniform cut across every department.
Use a controlled decision sequence
Run the proposed reduction through this test:
- What output does the cost support?
- Which job, customer, route, or client absorbs the cost?
- What happens to gross margin if capacity falls?
- When does the cash benefit appear?
- Which leading indicator will show damage early?
- Who owns the result after implementation?
Owners can use cost-cutting strategies for growing businesses as a prompt for evaluating alternatives, but the decision should rest on the company's own job-level margin, forecast, and operating data.
AmbitionCFO provides fractional CFO support for founder-led businesses, including 13-week cash flow modeling, margin analysis by job or client, forecasting, KPI dashboards, and overhead-structure reporting for construction, distribution, and professional-services companies. Visit AmbitionCFO to stress-test proposed reductions, protect gross margin, and turn overhead reduction into a controlled operating system rather than a panic response.