
You can have a record sales month and still worry about making payroll. That happens when revenue arrives on the income statement long before cash reaches the bank. The question you're trying to answer is simple: How do I turn growth into usable cash without damaging customers, suppliers, or service levels?
Working capital optimization answers that question by connecting receivables, inventory, payables, and a rolling 13-week cash flow forecast. The right playbook isn't a glossary of DSO, DIO, and DPO. It shows which operating behavior must change next week, how much liquidity that behavior can release, and where the tradeoff becomes dangerous.
Table of Contents
- The Cash Trap Behind Record Revenue
- What the Cash Conversion Cycle Really Tells You
- The Three Levers That Actually Free Up Cash
- A 90-Day Roadmap Built Around the 13-Week Cash Flow Model
- How Construction, Distribution, and Professional Services Differ
- Common Pitfalls That Quietly Destroy Working Capital
- Your Working Capital Dashboard and the Next Step
The Cash Trap Behind Record Revenue
A construction subcontractor generating $22 million in annual revenue called after winning several large projects. Revenue had jumped, but the owner had only $180,000 in the bank and $1.4 million in unpaid invoices. Payroll was approaching, crews still needed materials, and payroll taxes couldn't wait for customers to approve payment.
The company wasn't unprofitable. It was cash-starved by growth.
A 30% revenue jump can worsen liquidity when collections lag 60 days. Accrual accounting records revenue when the company earns it, but the business still has to ship products, pay crews, purchase materials, and remit taxes before the receivable clears. Profit measures economic performance. Cash determines whether the company can keep operating.
Practical rule: Every new contract needs a cash-timing review, not just a margin review.
Working capital means current assets minus current liabilities. Operationally, it's the gate between selling and surviving. Accounts receivable, inventory, and unpaid supplier bills determine how much cash the company must finance while work moves through the business.
Why fast growth creates financing pressure
Founders often treat working capital as an accounting output. That's a mistake. Sales terms, purchasing decisions, project billing, production schedules, and collections behavior all determine when cash leaves and returns.
The cost of ignoring the gap can include:
- Expensive borrowing: A revolving line of credit becomes a permanent substitute for disciplined collections and purchasing.
- Reduced credibility: Weak liquidity ratios can make lenders, bonding companies, and potential customers more cautious.
- Forced equity decisions: Owners may raise capital when cash pressure is highest, giving up control.
- Operational debt: Revenue can outpace the systems and processes needed to deliver profitably. This overview of operational debt at high growth is useful for owners who have expanded faster than their back office.
The first diagnostic is a bridge from accrual earnings to bank cash. Use this accrual-to-cash conversion guide to identify which balance-sheet movements are consuming the earnings your income statement reports.
For founder-led companies between $10 million and $100 million in revenue, working capital isn't a back-office detail. It's a growth constraint. The answer is to measure the cash cycle, connect each lever to weekly cash, and assign an owner who can change the underlying behavior.
What the Cash Conversion Cycle Really Tells You
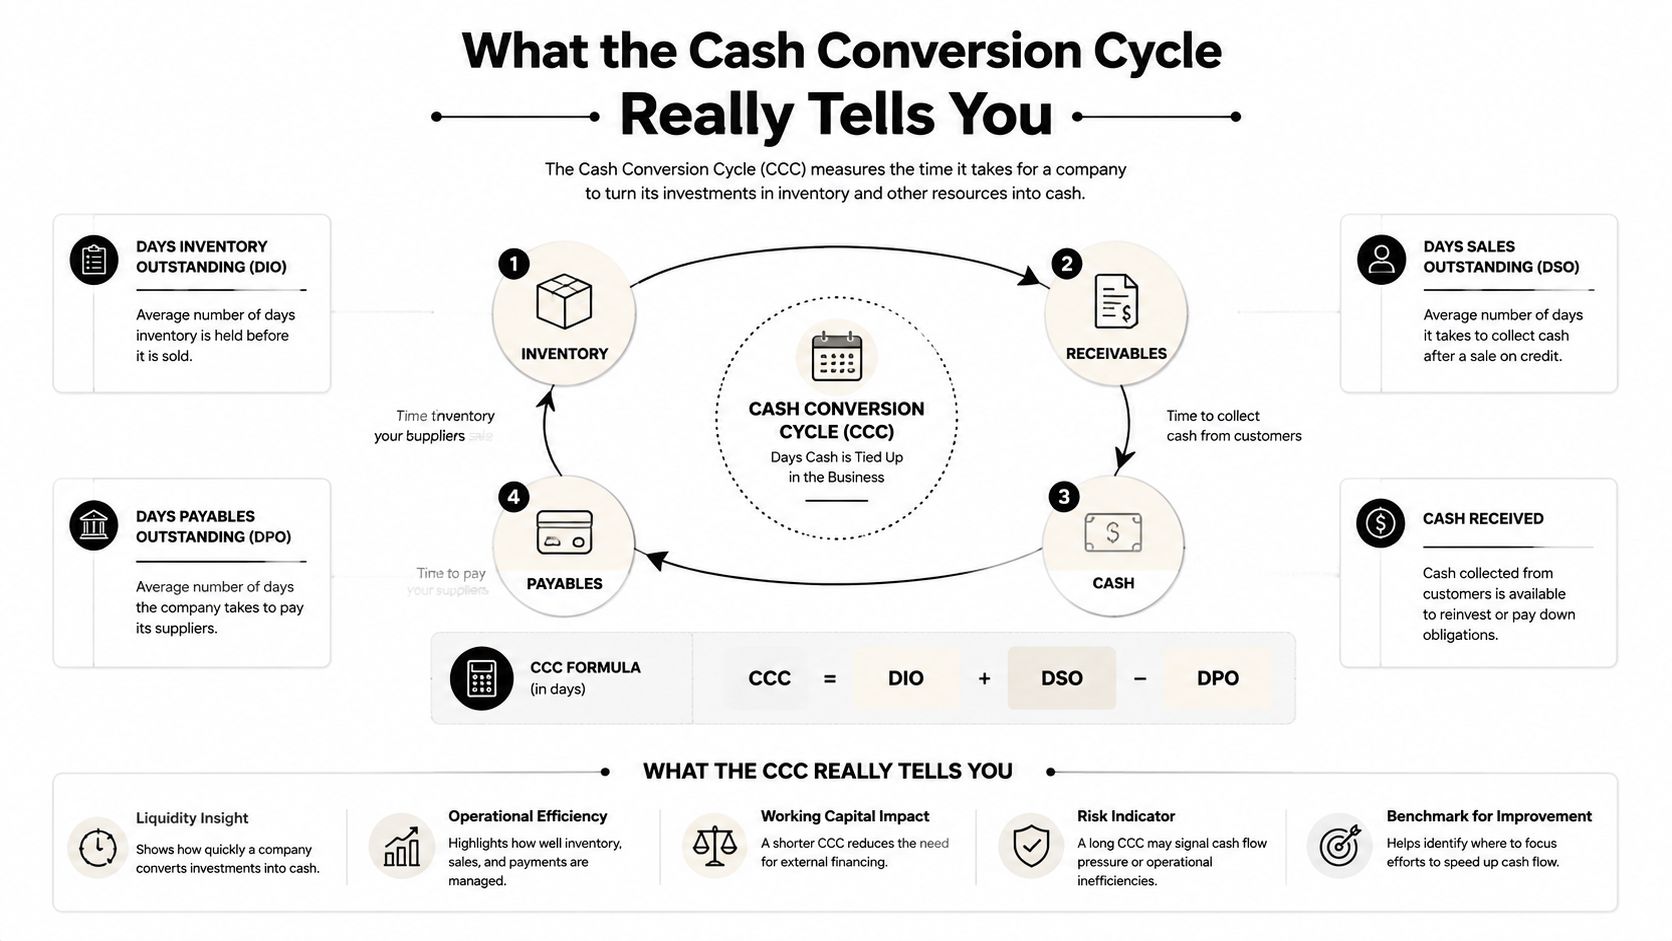
The cash conversion cycle, or CCC, shows how long operating cash stays committed between paying for inputs and collecting customer payments:
CCC = DIO + DSO − DPO
Days Inventory Outstanding (DIO) measures how long inventory remains unsold. Days Sales Outstanding (DSO) measures the average time customers take to pay. Days Payable Outstanding (DPO) measures how long the company takes to pay suppliers. See this cash conversion cycle formula guide for the formula and component definitions.
Read the cycle through a real operating example
A commercial HVAC contractor with $40 million in revenue might show this operating profile:
- DIO: Inventory sits for 38 days.
- DSO: Customers pay invoices in 54 days.
- DPO: Suppliers receive payment after 29 days.
- CCC: 38 + 54 − 29 = 63 days.
The contractor finances operations for roughly two months after cash leaves the bank. A SaaS reseller with the same revenue could have a negative 22-day CCC, because customer cash arrives before the reseller pays certain operating obligations. Revenue alone does not reveal liquidity.
A longer CCC generally means more outside financing is tied up in daily operations. A shorter or negative CCC gives management more flexibility only when service quality and supplier trust hold. Review inventory timing with this inventory aging report guide, especially when slow-moving stock is inflating DIO without supporting sales.
Translate days into cash
In the $40 million example, one day of annual revenue equals roughly $110,000. Reducing CCC by one day therefore frees roughly $110,000 of operating cash, assuming the revenue base and calculation method stay consistent. A few days can matter more than arguments over minor expenses.
Connect CCC to the balance sheet and the 13-week cash flow model. The step-by-step change in working capital explanation helps reconcile changes in inventory, receivables, and payables with the cash movement reaching the bank account. Put each proposed improvement into the weekly forecast. A DSO improvement matters only when the expected collection appears in a specific week.
Use these bands as management prompts:
- Under 30 days: Strong. Protect the position while monitoring service levels.
- 30 to 60 days: Watch. Identify the largest lever before growth raises the funding requirement.
- Above 60 days: Fix now. Assign weekly actions and tie them to the cash forecast.
These bands guide decisions, not universal judgment. Compare the company with its own history and relevant industry peers. Use transaction-level data so a changing revenue mix does not conceal deteriorating performance.
The Three Levers That Actually Free Up Cash
Treat receivables, payables, and inventory as three operating profit centers. Each needs its own owner, metrics, meeting agenda, and cash target. Working capital optimization fails when finance reports the numbers but sales, procurement, and operations don't change what they do.
Receivables need a collection system
Start with DSO, the aging of invoices beyond 60 days, and customer concentration. A low overall DSO can hide a serious problem if one major account controls a large share of outstanding receivables.
The practical moves are straightforward:
- Tighten credit decisions: Set credit limits and approval rules before sales commits to terms.
- Bill progress early: Construction and project businesses should invoice against completed milestones instead of waiting for final completion.
- Offer structured incentives: A 2/10 net 30 term can encourage faster payment, but calculate the discount cost against the cost of borrowing.
- Create a delinquency cadence: Assign calls and escalation steps by delinquency age, rather than sending identical reminders to every customer.
- Track disputes separately: An invoice blocked by a missing purchase order needs a different owner from a customer that won't pay.
Payables should preserve trust and optionality
DPO measures payment timing, but a higher number isn't automatically better. Track the take-rate on available early-payment discounts, supplier concentration, disputed invoices, and the number of payments made outside agreed terms.
Negotiate longer terms before invoices become overdue. Where appropriate, evaluate supply chain finance so suppliers can receive earlier cash while the buyer preserves agreed payment timing. The objective is controlled liquidity, not a public signal that the company pays late.
Inventory requires a service-level guardrail
DIO tells you how long inventory sits, but it doesn't tell you whether the stock protects customer service. Pair DIO with stockout days, inventory turnover, aging, fill rate, and gross-margin contribution.
Use ABC analysis to separate high-value or high-impact items from slow movers. Consider vendor-managed inventory for predictable slow-moving products and consignment for commodity SKUs where supplier ownership can reduce the cash burden. Don't cut every SKU by the same rule.
| Lever | Primary KPI | Healthy Benchmark | Typical Tactical Move | Expected Cash Lift |
|---|---|---|---|---|
| Receivables | DSO and invoices over 60 days | Compare with contract terms and sector history | Progress billing, credit controls, collection cadence | Release cash trapped in unpaid invoices |
| Payables | DPO and on-time payment rate | Pay within agreed terms | Renegotiate terms or use supply chain finance | Delay cash outflow without harming suppliers |
| Inventory | DIO, stockout days, and fill rate | Balance availability with demand | ABC analysis, consignment, vendor-managed inventory | Reduce cash held in excess stock |
The Hackett benchmark cited by Deloitte illustrates the combined effect. In its large-company 2021 comparison, top performers converted cash in 15.8 days, compared with 46.2 days for typical companies. Leaders also collected receivables in 27.8 days versus 48.7 days, held inventory for 28.1 days versus 67.7 days, and paid suppliers in 76.6 days versus 51.2 days. Those figures show why the three levers must be managed together, not optimized in isolation. See the Deloitte working capital management report for the benchmark context.
A $40 million business can sometimes free 8% to 12% of revenue by tightening all three levers together, but that expected range comes from the operating plan, not a guaranteed result. Model the cash effect before approving each action.
Supplier warning: Squeezing payables while ignoring receivables can damage trust, reduce flexibility, and trigger costly supply interruptions.
A 90-Day Roadmap Built Around the 13-Week Cash Flow Model
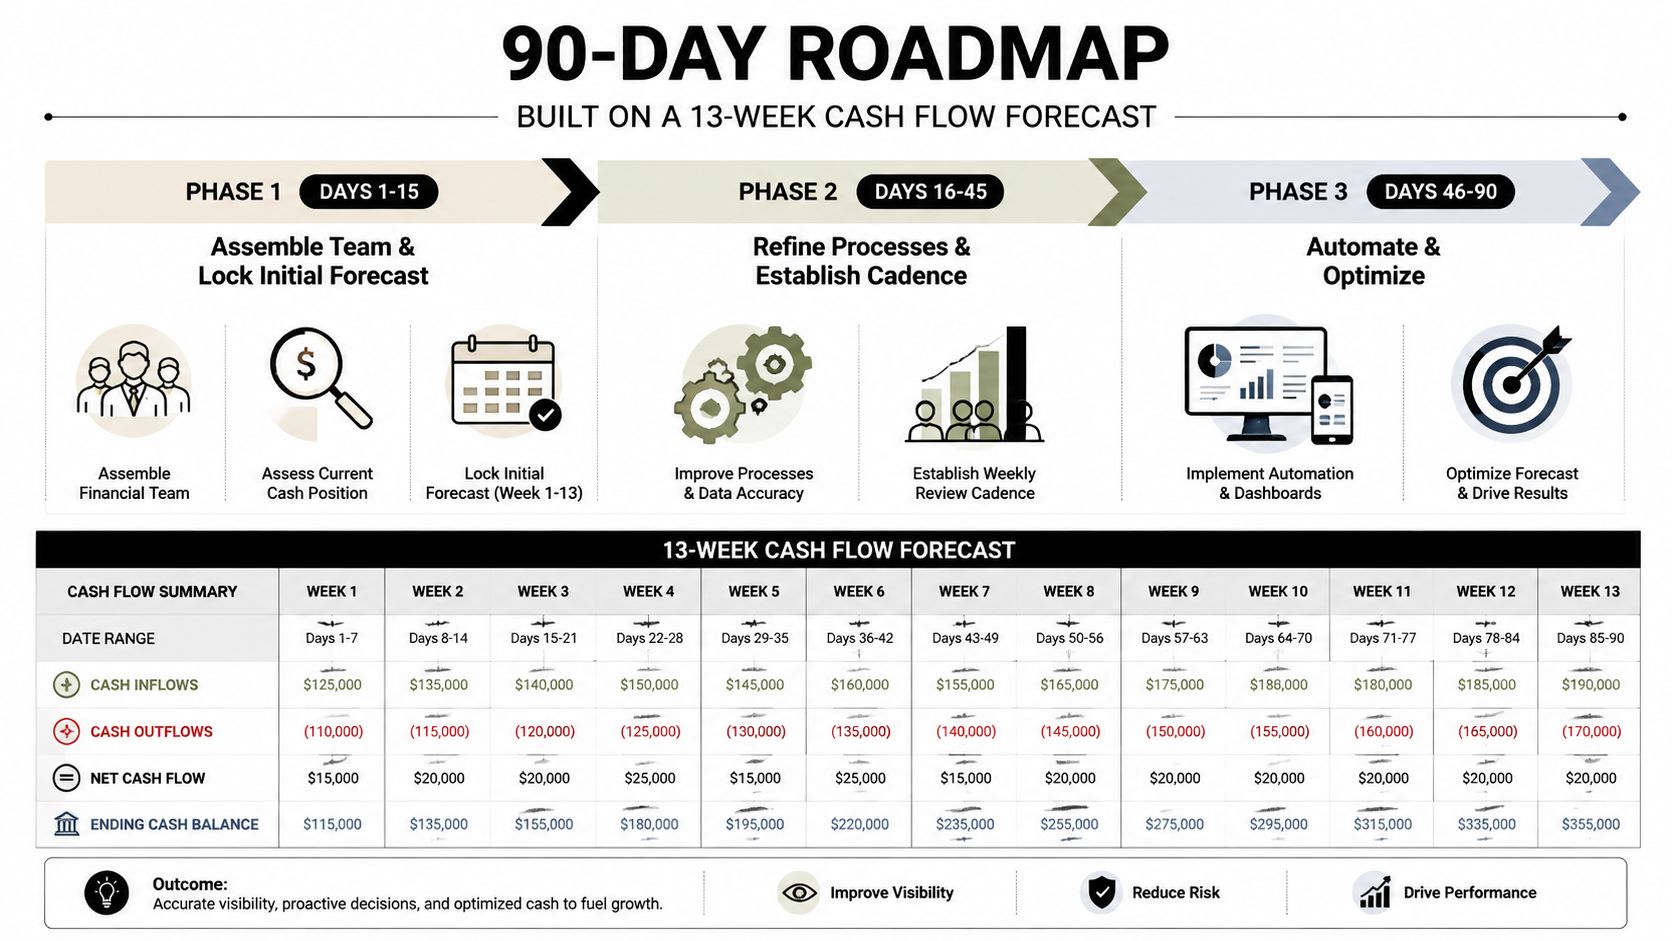
A 13-week cash flow model turns working capital from a monthly financial report into a weekly operating system. Forecast cash receipts and disbursements by week, not by accounting period. Include a minimum cash floor that protects payroll, taxes, debt service, and essential purchasing.
Days 1 through 15
Build the baseline before launching initiatives. Pull the opening bank balance, AR aging, AP aging, committed purchases, payroll, debt payments, taxes, and inventory on hand into one controlled file.
Your week-one baseline report should show:
- Expected customer receipts by account and week.
- Supplier payments by due date and approval status.
- Payroll and tax obligations.
- Inventory purchases and planned production cash needs.
- The minimum cash floor and the weeks at risk.
Lock the first forecast by the end of this phase. Don't wait for perfect data. Mark assumptions clearly and improve them during each revision.
Days 16 through 45
Run three stress cases:
- A 20% revenue dip, with variable costs adjusted realistically.
- A 30-day customer delay, applied to the accounts most likely to slip.
- A supplier-term change, showing the effect of earlier payment requirements.
Assign one accountable owner to each lever. Sales owns collection actions and billing quality. Procurement owns supplier terms and approval flow. Operations owns inventory demand, purchasing discipline, and service-level protection.
By week four, issue the first forecast revision. Compare forecast cash with actual cash, then explain every material variance. A forecast without variance analysis is just a spreadsheet.
Days 46 through 90
Institutionalize a Tuesday morning cash meeting lasting 30 minutes. Review receipts due, payments proposed, forecast variance, and the actions required to keep weeks 7 through 13 above the cash floor.
Set escalation triggers in advance. A missed collection promise, an invoice dispute beyond its agreed resolution date, or a forecast dip below the floor should automatically create an owner-level action. Use the 13-week cash flow model framework to structure the forecast and meeting rhythm.
The week-eight mid-program retrospective should remove actions that aren't releasing cash and expand the ones that are. By week twelve, deliver a board-ready dashboard showing CCC, DSO, DIO, DPO, forecast variance, and the cash floor.
Tie compensation to cash targets carefully. Reward collected cash and reliable service, not delayed payments or inventory liquidation.
How Construction, Distribution, and Professional Services Differ
The same metric changes meaning by industry. A construction company can have a long DSO because billing depends on approvals and retainage. A distributor can have a short collection cycle and still consume cash through excess inventory. A professional services firm may carry little physical stock but lose liquidity in unbilled work and write-offs.
Construction
Construction cash typically lives in progress billing, retainage, work in process, and change-order approval. A practical operating range is 60 to 90 days of DSO, with DIO, DPO, and CCC depending heavily on project structure and contract terms.
The 30-day quick win is to convert milestone billing into weekly draws wherever the contract allows. Require project managers to submit percent-complete information on a fixed schedule, resolve disputed change orders quickly, and review retainage before bidding new work. A construction owner should also review construction cash flow management alongside job-level margin and WIP reporting.
Distribution
Distribution usually carries cash in inventory and supplier programs. Target DSO often sits in the 30 to 45 day range, but purchasing discipline matters just as much as collections. ABC analysis, demand-based reorder points, and vendor-managed inventory can reduce DIO without treating every stock keeping unit identically.
The 30-day quick win is a slow-mover review. Identify items with weak demand, stop automatic replenishment, and negotiate returns, consignment, or supplier-held stock where the relationship supports it.
Professional services
Professional services businesses often hide working capital in utilization, unbilled work, work in process, and write-offs. The useful cash actions are 50% deposits, milestone billing, explicit approval for scope changes, and a written write-off policy.
The 30-day quick win is a weekly unbilled-work report by client and project manager. Every unbilled item should have a billing date, an approver, and a reason it hasn't been invoiced.
| Industry | DSO (days) | DPO (days) | DIO (days) | CCC (days) | Top Lever |
|---|---|---|---|---|---|
| Construction | 60 to 90 | Contract-specific | Project-specific | Contract-specific | Progress billing and retainage |
| Distribution | 30 to 45 | Supplier-specific | Inventory-driven | Inventory-driven | ABC inventory control |
| Professional services | Client-specific | Vendor-specific | Usually limited physical stock | WIP-driven | Deposits and unbilled-work control |
These are operating ranges and decision guides, not universal benchmarks. Compare them with the company's own contract mix, billing rules, customer behavior, and service requirements.
Common Pitfalls That Quietly Destroy Working Capital
Some cash initiatives look effective because the bank balance improves briefly. They still destroy value if they shift the problem to a supplier, customer, or operations team.
Delaying suppliers past agreed terms
Stretching payments beyond agreed terms creates a temporary benefit and a lasting credibility problem. You can lose early-pay discounts, receive less favorable quotes, and force suppliers to protect themselves with tighter terms or surcharges.
Pay on the agreed day, not 30 days past due. If the business needs more time, negotiate before the invoice is late. A transparent term change is a financing decision. Silent delinquency is a relationship failure.
Chasing the wrong receivables
Lowering DSO across the long tail won't solve a concentration problem. If the top three customers represent 60% of AR, start there, even if the other accounts are easier to collect.
Rank the top 20% of accounts by AR balance. For each, document contract terms, disputed invoices, approval contacts, promised payment dates, and the next executive escalation. For smaller teams, this guide to the best invoice follow-up software for SMBs can help organize reminder workflows, but software won't fix unclear billing ownership.
Cutting inventory without measuring service
Reducing stock can free cash, then create expensive emergencies. Stockouts can cause expediting fees, lost jobs, missed service commitments, and purchases at unfavorable prices.
Track fill rate, stockout days, emergency purchases, and customer cancellations before trimming SKU counts. Keep inventory when it protects a critical service promise or has a long replenishment lead time. Remove it when demand is weak, replacement is reliable, and the service benefit doesn't justify the cash tied up.
Your Working Capital Dashboard and the Next Step
A CEO's weekly dashboard should show the operational pulse, not a finance department's rear-view report. Track the 13-week cash forecast variance, DSO, DPO, DIO, CCC, free cash flow margin, and current ratio.
Use company history and sector economics to set target bands. The dashboard should also show the action threshold that forces escalation.
| Metric | Formula | Target Band | Escalation Trigger |
|---|---|---|---|
| 13-week forecast variance | Actual cash minus forecast cash | Narrow, explained variance | Repeated unexplained miss |
| DSO | Receivables divided by credit sales, multiplied by days | Contract-aligned and stable | Deterioration or aging beyond 60 days |
| DPO | Payables divided by purchases, multiplied by days | Within agreed supplier terms | Overdue payments or supplier concern |
| DIO | Inventory divided by cost of sales, multiplied by days | Demand and service-level aligned | Aging stock or rising stockouts |
| CCC | DIO + DSO − DPO | Improving without service damage | Above the company's approved ceiling |
| Free cash flow margin | Free cash flow divided by revenue | Positive and sufficient for planned needs | Falling despite reported profit |
| Current ratio | Current assets divided by current liabilities | Adequate for obligations and covenants | Covenant pressure or near-term liquidity risk |
The broader benchmark picture reinforces the need for weekly control. A JPMorgan analysis of more than 2,700 public companies found average CCC rose from 83 days in 2020 to 90 days in 2023, then improved slightly to 89 days in 2024. In 2024, small companies below $300 million in revenue averaged 120 days, medium-sized companies averaged 100 days, and large companies above $3 billion averaged 65 days. The JPMorgan cash conversion cycle analysis shows why company size and operating model matter.
Your next action is specific. This week, put the last 90 days of AR aging and AP aging into one sheet, calculate weighted DSO and DPO, and identify the top five invoices and top five payables to renegotiate or resolve. Don't wait for the monthly close to reveal a leak. Use that sheet to populate the first 13-week forecast, then assign an owner and deadline to every material cash action.
For businesses between $10 million and $100 million, a fractional CFO can build the forecast, install the dashboard, and coordinate the operating changes without adding a full-time executive hire. AmbitionCFO provides 13-week cash flow modeling, financial forecasting, KPI dashboards, and working capital guidance for founder-led companies in construction, distribution, and professional services. Review the firm's broader financial metrics guide as you set the weekly operating rhythm.
AmbitionCFO helps founder-led businesses build 13-week cash forecasts, improve working capital visibility, and turn DSO, DIO, and DPO into accountable operating actions. Visit AmbitionCFO to discuss a practical cash management plan for your business.