

Tuesday morning arrives, payroll is due, and you're refreshing the bank app instead of making decisions about the business. The income statement says you're profitable. The cash balance says you need to wait before hiring, buying equipment, or paying a supplier. That gap is where founder-led companies get hurt.
A practical cash flow forecasting model turns that uncertainty into a weekly operating view. It connects expected customer receipts, vendor payments, payroll, taxes, debt service, and capital spending to the dates when money moves. The point isn't to produce another finance report. It's to know what decision you need to make before the cash problem becomes urgent.
Table of Contents
- Why Your Business Needs a Cash Flow Forecasting Model
- Direct Versus Indirect Forecasting Methods
- Inputs and Assumptions That Drive the Forecast
- Building a 13-Week Cash Flow Model From Scratch
- Scenario and Sensitivity Analysis for Real Decisions
- Running a Rolling Forecast Without Burning Out Your Team
- Case Study and Your Downloadable Forecast Template
Why Your Business Needs a Cash Flow Forecasting Model
A project reaches its billing milestone, but the customer pays weeks later. Payroll and supplier invoices arrive on schedule. The income statement shows a profit, yet the bank balance cannot carry the gap. That timing problem is why founder-led businesses need a working cash flow forecasting model.
Profit measures performance under accrual accounting. Cash shows whether the bank account can support payroll, suppliers, taxes, debt service, and capital expenditures when they fall due. In project-based and inventory-heavy businesses, milestones, retainage, stock purchases, and collection cycles can make those measures diverge sharply.
A forecasting model converts the pipeline, accounts receivable schedule, accounts payable terms, payroll commitments, and planned spending into a week-by-week liquidity view. A 13-week cash flow model rolls expected inflows and outflows across a 13-week horizon for near-term decisions. This resource emphasizes that each week's ending cash becomes the next week's opening cash.
Use the model before the decision
Build the forecast around decisions, not around the accounting close:
- Hiring: Can the business carry the new payroll commitment through the next collection gap?
- Vendor terms: Which supplier payments can be renegotiated before an AP run creates pressure?
- Credit planning: When should you draw on an existing line instead of seeking expensive emergency financing?
- Capital spending: Can an equipment purchase happen now, or should it wait until a project milestone is collected?
Bring the model into the weekly management meeting. The Relay Cash Flow Compass Report found widespread concern about cash flow visibility, while many businesses still rely on outdated methods and fail to connect forecasts consistently to live business drivers.
Practical rule: If the forecast does not change a decision, it is not finished.
Start with a reconciled bank position. Map the next 60 to 90 days of receipts and payments, then assign owners to collection dates, supplier terms, milestone billing, retainage, and inventory purchases. Use the guide to data-driven decisions for founders to strengthen the habit of turning operating information into management action. For the operating discipline behind that work, review this explanation of what cash flow management means in a business.
Run the model every week, compare forecast with actual cash, and adjust the assumptions that missed. A stale spreadsheet creates false confidence. A living forecast gives you time to collect faster, delay a purchase, renegotiate a payment, or arrange funding before the choice becomes expensive.
Direct Versus Indirect Forecasting Methods
The direct method is the right default for short-term liquidity control. It lists expected cash receipts and cash payments by date, then nets them into a weekly cash position. The indirect method starts with projected profit and adjusts for non-cash items and working-capital movements, such as depreciation, stock, debtors, and creditors.
The indirect method is useful for profit-to-cash reconciliation and monthly reporting. It isn't the best instrument for answering a founder's immediate question: Will enough cash arrive before the next payroll and supplier run?
| Dimension | Direct Method | Indirect Method |
|---|---|---|
| Core mechanics | Forecasts actual receipts and disbursements by date | Starts with projected profit and adjusts for non-cash and working-capital items |
| Primary data | Bank activity, AR, AP, payroll, debt, taxes, and planned spending | Income statement, balance sheet, and accounting projections |
| Update cadence | Weekly or more frequently when liquidity is tight | Usually aligned with monthly reporting and the close |
| Short-horizon use | Shows when cash arrives and leaves | Explains how profit converts into cash |
| Common failure | Weak collection assumptions or stale payment dates | Timing gets obscured inside accounting adjustments |
| Best fit | Weekly liquidity decisions and trigger management | Board reporting, reconciliation, and longer-range planning |
Pick the method that matches the decision
For founder-led companies in the $10M to $100M revenue range, direct forecasting should be the operating model, especially when customer concentration, retainage, milestone billing, or uneven payment behavior distorts the income statement. Those businesses don't need a more elegant reconciliation. They need an honest calendar of cash.
The guide to converting accrual accounting to cash can help finance teams reconcile the two views without confusing them. Keep the indirect method for monthly board reporting where comparability with GAAP matters. Don't force one model to do both jobs.
Inputs and Assumptions That Drive the Forecast
Most forecasts fail in the inputs, not the formulas. A clean spreadsheet filled with optimistic collection dates is still a bad forecast.
Build the model around four groups of information.
Cash inflows
Start with AR by customer, not a single revenue line. For each meaningful receivable, record the invoice date, contractual due date, expected payment week, payment history, and any collection risk.
Add the operating details that change timing:
- Milestone billings: Tie receipts to approved progress claims, completion certificates, or contract events.
- Retainage: Record the expected release date separately from the underlying invoice.
- Recurring receipts: Include retainers, maintenance contracts, subscriptions, or other recurring revenue with explicit collection assumptions.
- Other receipts: Identify financing proceeds, tax refunds, asset sales, or owner contributions as distinct items.
A construction general contractor might have revenue earned on a project this month, an invoice submitted next month, and cash collected later after approval and retainage release. Put those events in separate forecast lines. Don't pretend the revenue date is the cash date.
Cash outflows
Payroll deserves more detail than a single expense row. Split salaried payroll, hourly wages, commissions, bonuses, benefits, and payroll taxes. Then check whether month-end payroll crosses two forecast weeks.
Map AP by vendor using actual terms, not a default assumption that every supplier is paid in 30 days. Include purchase orders, committed project costs, subcontractor payments, freight, rent, software, debt service, interest, payroll taxes, sales taxes, and capex.
A distribution business needs a separate inventory purchase schedule. A seasonal inventory build can absorb cash before the related sales are collected, so inventory receipts and supplier payments should be connected to purchase orders and expected shipment dates.
Timing levers
Timing assumptions deserve their own review. Use customer-specific collection curves where payment behavior differs by account. Estimate how long retainage typically takes to release. Document which vendors you pay on receipt, which follow contractual terms, and which can be extended without damaging the relationship.
A professional services firm should separate WIP, invoicing, and collection. Work performed may create revenue or an unbilled receivable, while cash arrives only after the invoice is issued and the client pays. Deferred revenue creates the opposite distortion, cash arrives before the service is delivered.
Operating assumptions
Keep the major assumptions visible:
- Revenue ramp: What new work is likely to convert into billings and when?
- Gross margin: Which project or product assumptions affect supplier and labor cash?
- Headcount plan: What hires, raises, commissions, or contractor commitments are planned?
- Financing events: When will a draw, repayment, or refinancing settle?
Use a projected sales forecast template to connect the sales outlook to expected billing and collection timing. The three assumptions most likely to sink the model are AR collection pace, payroll timing for month-end payrolls that straddle two weeks, and one-off outflows the owner forgot.
Building a 13-Week Cash Flow Model From Scratch
Build the first version in a spreadsheet your team can understand. Automation can come later. A transparent model that gets refreshed every week is more valuable than an advanced model nobody trusts.
Begin in cell A1 with the opening cash balance from the latest bank reconciliation. Don't use an unreconciled ledger figure. Define Week 1 through Week 13 as columns, and reserve a notes column beside the operating rows so every assumption has an explanation.
Lay out the weekly structure
Separate cash inflows, cash outflows, and the weekly net and ending cash summary. The structure below gives you a workable starting point.
| Row | Week 1 | Week 2 | Weeks 3-12 | Week 13 |
|---|---|---|---|---|
| Opening cash balance | Reconciled balance | Prior week ending cash | Prior week ending cash | Prior week ending cash |
| Scheduled AR collections | Customer-weighted receipts | Customer-weighted receipts | Customer-weighted receipts | Customer-weighted receipts |
| Recurring receipts | Retainers, maintenance, or subscriptions | Recurring receipts | Recurring receipts | Recurring receipts |
| Other inflows | Known non-operating receipts | Known non-operating receipts | Known non-operating receipts | Known non-operating receipts |
| Payroll and benefits | Confirmed payroll commitments | Confirmed payroll commitments | Confirmed payroll commitments | Confirmed payroll commitments |
| AP and project costs | Due supplier and project payments | Due supplier and project payments | Due supplier and project payments | Due supplier and project payments |
| Taxes and debt service | Known obligations | Known obligations | Known obligations | Known obligations |
| Capex and one-time items | Confirmed purchases or deposits | Confirmed purchases or deposits | Confirmed purchases or deposits | Confirmed purchases or deposits |
| Net cash movement | Total inflows minus total outflows | Total inflows minus total outflows | Total inflows minus total outflows | Total inflows minus total outflows |
| Ending cash balance | Opening balance plus net movement | Opening balance plus net movement | Opening balance plus net movement | Opening balance plus net movement |
| Notes | Driver and source | Driver and source | Driver and source | Driver and source |
Use AR data to populate expected receipts. Weight each collection by the customer's actual payment behavior and by the conditions required for payment, such as approval, milestone signoff, or retainage release.
Add the outflows that create surprises
Layer in fixed costs first, including payroll, rent, software, insurance, and recurring debt payments. Then add variable AP tied to purchase orders, subcontractor commitments, inventory purchases, and project costs. Finish with known one-time items such as tax deposits, loan payments, equipment deposits, or planned owner distributions.
Calculate ending cash as a formula:
Ending cash = Opening cash + Total inflows - Total outflows
Set a minimum cash threshold that reflects your obligations and financing access. Use conditional formatting to flag any week below that threshold. The practical guide to creating a cash flow forecast provides a useful reference for organizing the forecast around expected receipts, payments, and ongoing updates.
The weekly loop is simple. Replace the oldest forecast week with actuals, add one new future week, reconcile the variance, and roll the horizon forward. The model becomes useful when the notes explain why the forecast changed.
Scenario and Sensitivity Analysis for Real Decisions
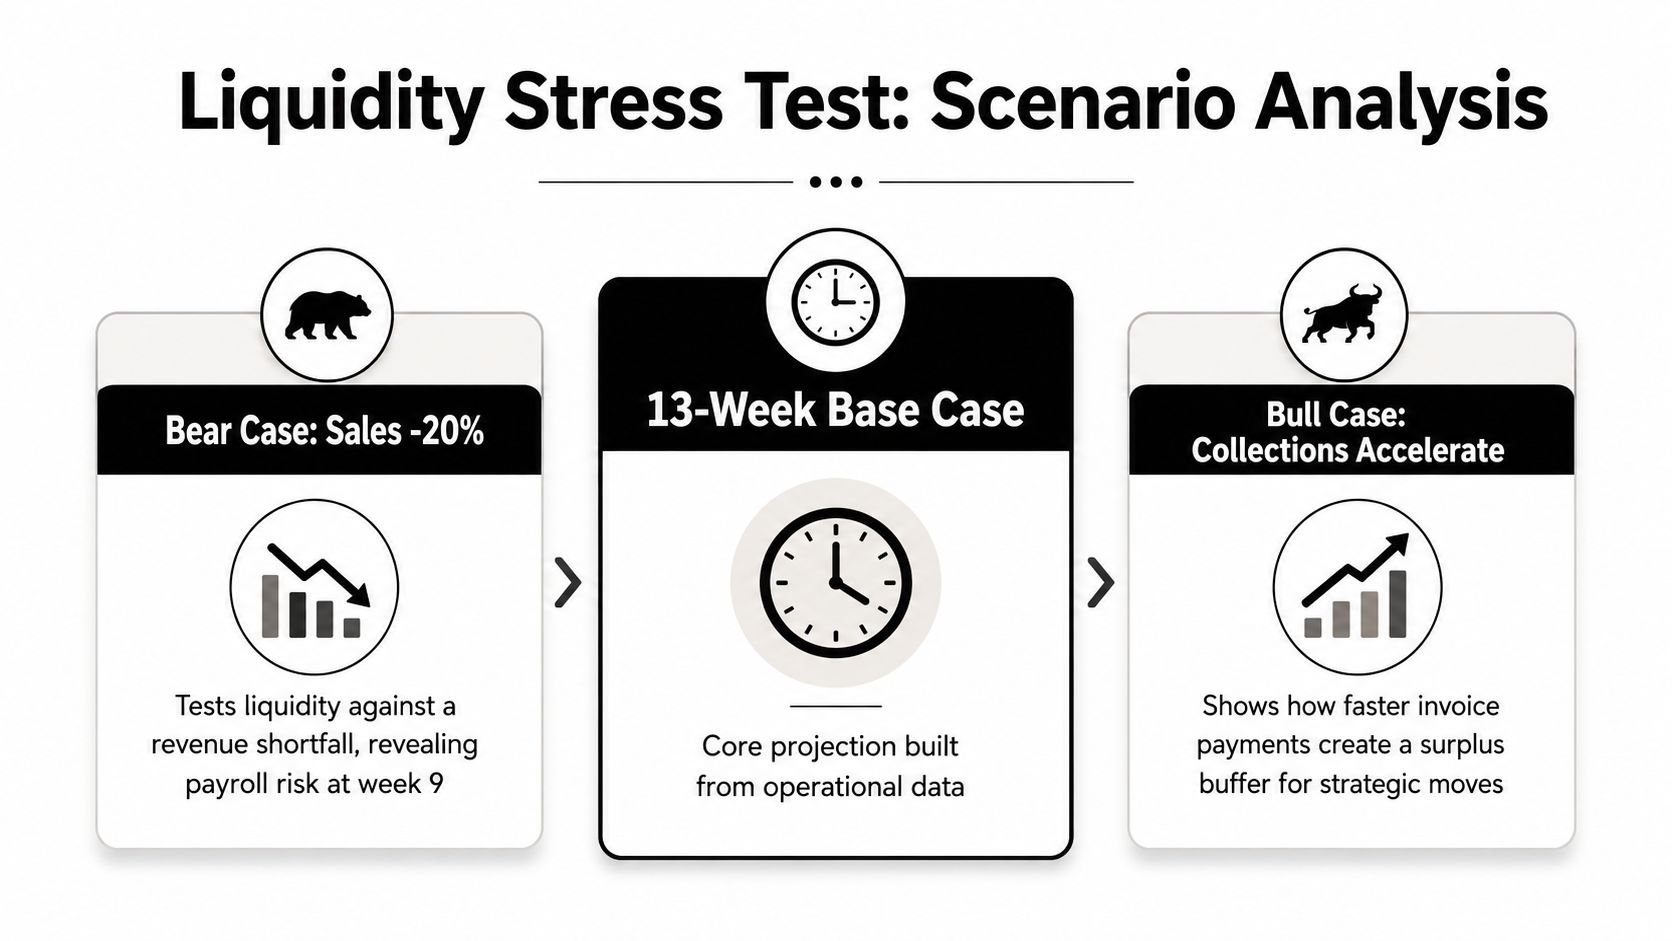
Scenario analysis isn't a board-deck decoration. It's a liquidity stress test that tells you which operating assumption forces a decision.
Start with the base case from your 13-week model. Then create a downside case where the top customer pays 30 days late and revenue takes a 20% haircut, and an upside case where a delayed project milestone pulls forward while AP terms stretch by 15 days. These are the required assumptions for this exercise, and each needs to flow through the same weekly cash logic as the base case.
Measure the decision, not just the balance
Compare each case across three outputs:
- Minimum cash week: Identify when the lowest cash position occurs.
- Threshold breaches: Count how many weeks fall below your defined minimum.
- Runway: Express the available liquidity in months under each case.
A downside case may show that payroll becomes exposed in a particular week. That should trigger a specific response, such as accelerating an invoice, deferring a hire, drawing on a credit line, or renegotiating a vendor term. The output isn't “the bear case is worse.” The output is “if this customer misses the expected payment, we begin collections escalation this week.”
Isolate the fragile assumption
Use a sensitivity table to change one variable at a time. Test a 5% AR collection delay across all customers, then compare the minimum cash position and threshold breaches against the base case. Next, test a retention delay, a supplier payment acceleration, or a major equipment deposit.
The difference between sensitivity analysis and scenario analysis helps keep the exercises distinct. A scenario changes several connected assumptions to represent an operating situation. Sensitivity analysis isolates one lever to reveal what breaks the model.
Don't model every imaginable future. Find the trigger that changes behavior, assign an owner, and set a date for review.
Running a Rolling Forecast Without Burning Out Your Team
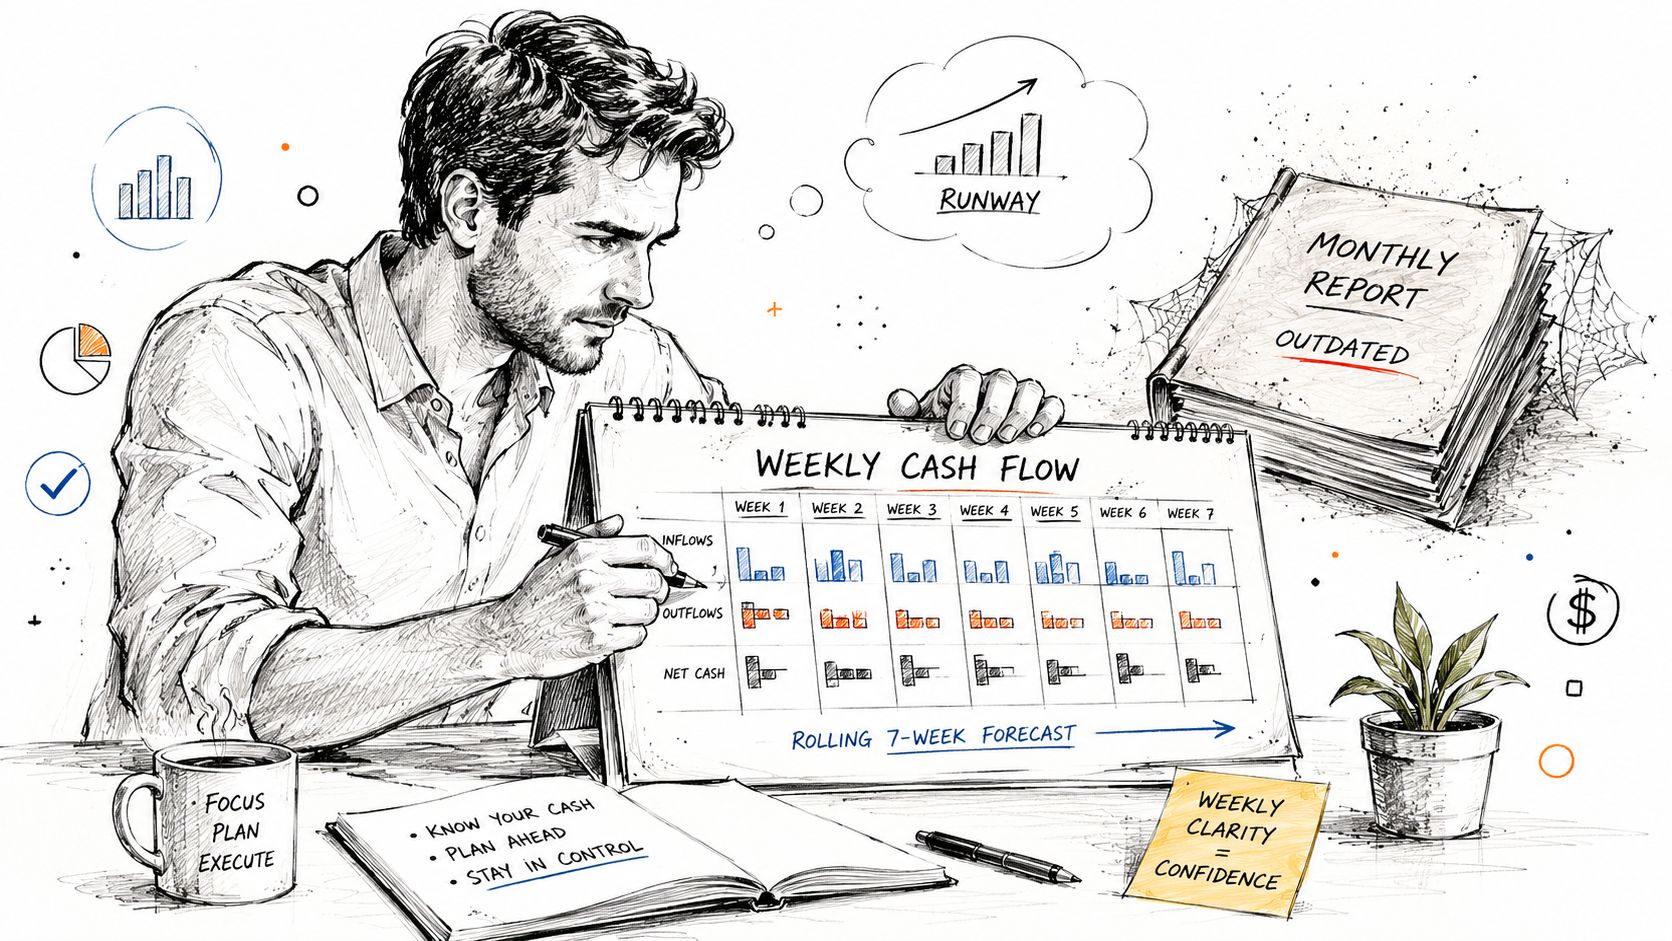
Most founder-led companies refresh cash forecasts monthly. That cadence is too slow for a business exposed to payroll, concentrated receivables, project milestones, or large inventory purchases. A cash problem can develop between monthly updates and become expensive before anyone sees it.
Add one new week every Monday, drop the week that just closed, and replace estimates with actuals. Then reconcile the variance. If a customer was forecast to pay in Week 2 but paid in Week 3, record that miss and adjust the customer's future collection assumption.
Keep the Monday update under control
Cap the process at 45 minutes. The team should update inputs, not rebuild the workbook.
Use a short checklist:
- Bank balance: Confirm the reconciled opening position across the accounts in scope.
- AR movement: Compare the latest aging to the prior week and identify changed payment dates.
- Near-term AP: Confirm supplier, subcontractor, inventory, and project payments due in the next two weeks.
- One-time items: Add any known tax, debt, capex, legal, insurance, or owner-related outflow.
- Variance review: Explain the largest differences between forecast and actual cash.
Pre-build formulas, protect calculation cells, and use consistent input colors. Assign ownership to the founder, head of finance, or another named operator. Put the review on a recurring calendar block before payroll decisions are finalized.
The output should fit on one page. Show ending cash by week, the number of weeks before the threshold is breached, major collection risks, and decisions required from leadership. A forecast nobody reads is still a spreadsheet exercise.
Use the video below as a practical visual reminder of the weekly discipline.
A rolling model also creates a feedback loop. Each variance tells you whether the problem came from timing, an overly optimistic assumption, missing operating data, or a real change in the business. Fix the driver, not just the cell.
Case Study and Your Downloadable Forecast Template
A $28M specialty contractor used a 13-week model to identify a 41-day retention delay on a flagship project six weeks before the delay would have drained its reserves. The alert triggered an AR escalation that recovered $740K ahead of schedule. Those figures come from the example provided for this guide, and they illustrate why project cash must be modeled separately from reported revenue.
The founder changed the collection probability assumption from 85% to 60%. That single adjustment exposed the timing risk in the weekly forecast and forced a decision to delay a $1.2M equipment purchase by one quarter. The model didn't predict the future perfectly. It made the consequence of a plausible delay visible early enough to choose a response.
Start with a usable template
A practical template should include:
- Direct and indirect toggle: Use direct forecasting for weekly liquidity and indirect forecasting for reconciliation.
- Scenario columns: Compare base, downside, and stress cases without rebuilding the model.
- AR aging pull: Connect receivables to customer-specific expected payment timing.
- Payroll waterfall: Separate recurring payroll, variable compensation, benefits, and payroll taxes.
- Rolling-week reset: Replace the closed week with actuals and carry the prior 12 weeks forward.
In week one, populate the opening cash balance, weekly recurring inflows, and weekly recurring outflows. Then add the current AR aging, known AP commitments, payroll dates, taxes, debt service, and one-time items. Every assumption should have a note that states its source and expected timing.
Run the base scenario this Friday using last week's bank statement and current AR aging. Then schedule a 30-minute weekly review every Monday before payroll and hiring decisions are finalized.
AmbitionCFO builds rolling 13-week cash flow models, variance analysis, executive dashboards, and operating forecasts for founder-led businesses in construction, distribution, and professional services. Visit AmbitionCFO to discuss the cash flow visibility and decision discipline your leadership team needs.