

If your board packet leads with one tidy overhead percentage, you're flying with one gauge. You need not for profit performance indicators that answer a plainer question. Can we keep our promise to the people we serve next month, next quarter, and next year? That answer takes fuel, direction, crew capacity, and proof you arrived somewhere worth going.
Table of Contents
- Why a Single Percentage Fails the Mission
- Four Indicator Families and the Numbers to Track
- How to Turn Liquidity into Months of Runway
- Program Ratios That Do Not Prove Impact
- Outcomes, Engagement, and What Counts as Success
- Build the One-Page Board Dashboard and Start This Month
Why a Single Percentage Fails the Mission
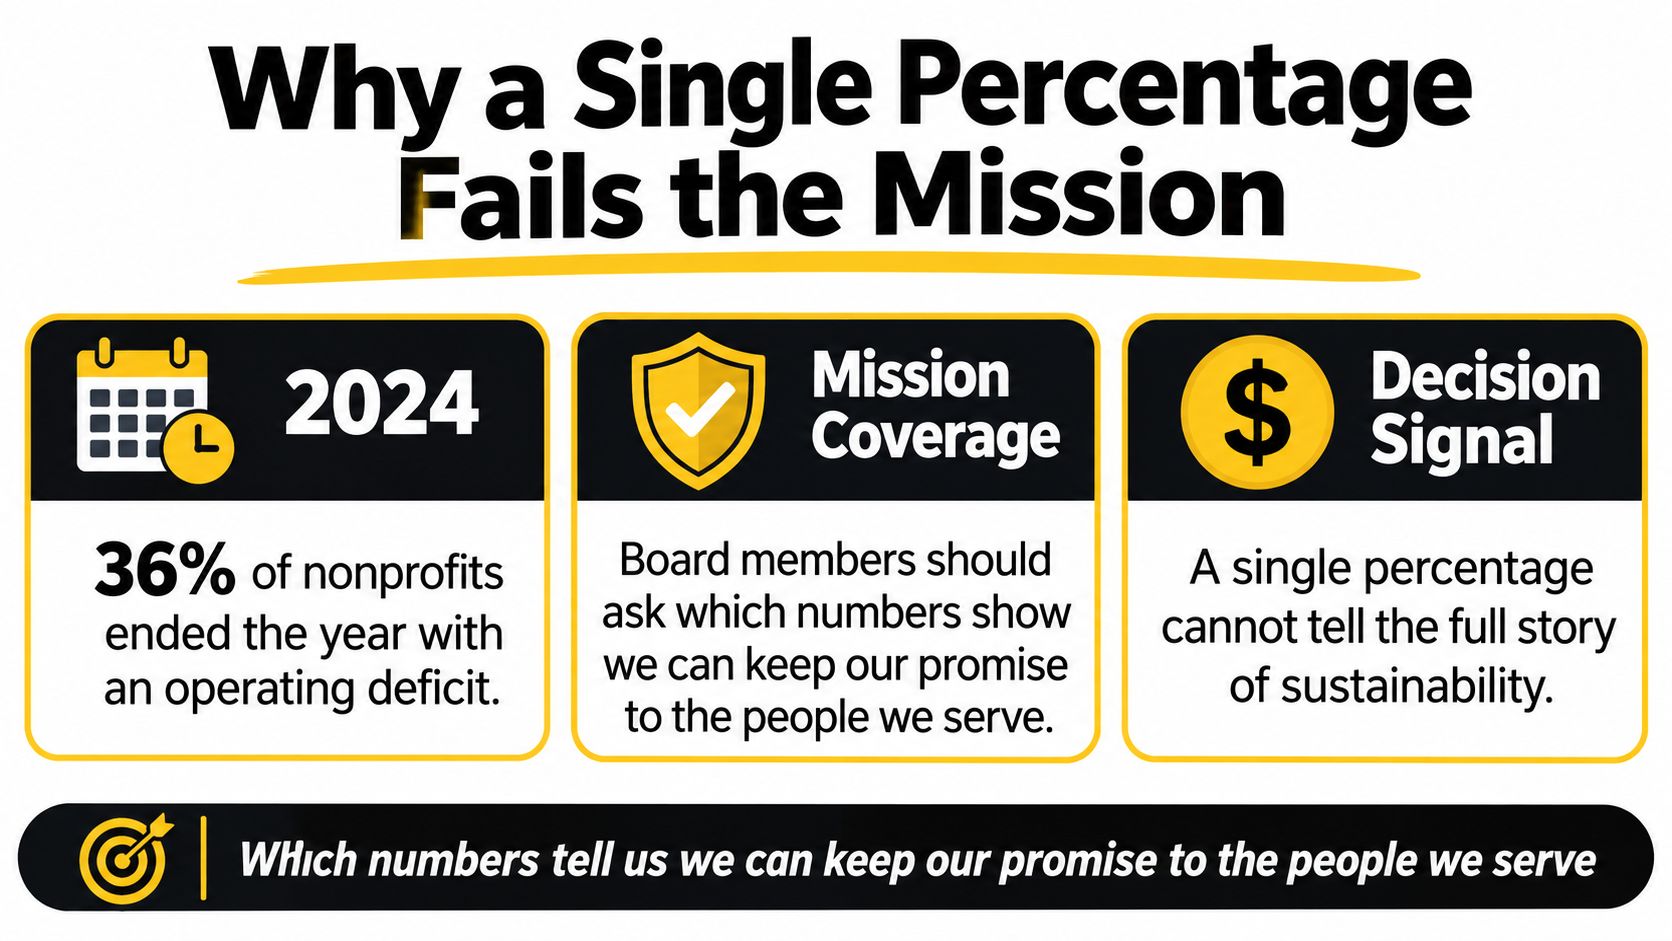
In 2024, 36% of nonprofits ended the year with an operating deficit, the highest level in the past 10 years of its survey, according to the Nonprofit Finance Fund 2025 State of the Nonprofit Sector Survey. An organization can report a respectable program percentage and still run out of money to run the program.
That's the trap. A board member isn't really asking whether overhead looks lean. They're asking which numbers show the work can continue.
The Cockpit Test
Think of your packet as a cockpit. Airspeed matters, but it doesn't tell a pilot how much fuel remains, whether the destination is still ahead, or whether the crew can fly the next leg. Overhead is airspeed. Useful, narrow, and dangerous on its own.
A performance indicator is a measure you repeat on a set schedule because it should change a decision. If a number never leads to a hire paused, a reserve moved, a price changed, or a program redesigned, it's decoration.
Decision rule: Keep the indicator only if you can name the decision it would change.
Four Families, One Flight
You'll build four families in order. Financial capacity is fuel. Operational delivery shows whether the engine turns fuel into service. Mission outcomes show whether you reached the right place. Stakeholder engagement shows whether donors, participants, and partners still trust the route.
Financial health lets the mission continue. It isn't the mission. Churches wrestling with that distinction may find crafting a Scripture-rooted mission statement helpful for naming the destination before choosing gauges. For the flight itself, pair your indicators with a disciplined actual versus budgeted review so surprises surface while you can still correct course.
The payoff is practical. Fewer midyear cuts. Fewer meetings that end with concern and no action. More meetings that end with a clear move.
Four Indicator Families and the Numbers to Track
Start with these ten lines. They're enough for a first board scorecard, and you can calculate most of them from this month's books.
Starter nonprofit performance indicators
| Indicator | Formula | Planning range | Review |
|---|---|---|---|
| Current ratio | Current assets ÷ current liabilities | Above 1.0 so short-term assets cover short-term bills | Monthly |
| Days cash on hand | Unrestricted cash ÷ average daily cash expense | At least 90 days, matching a 3 month starting reserve | Monthly |
| Operating reserve in months | Expendable net assets ÷ average daily expenses, then × 30.4 | 3 to 6 months to start; more if grants are late or concentrated | Monthly |
| Full-cost operating surplus | (Unrestricted revenue − operating expenses) ÷ unrestricted revenue, after capital, debt principal, and reserve contribution | A small surplus can still be too thin once renewal and debt are funded | Quarterly |
| Program expense ratio | Program service expenses ÷ total functional expenses | Compare with similar missions and your own trend, not a universal cutoff | Quarterly |
| Overhead ratio | (Management and general + fundraising) ÷ total functional expenses | Read only beside outcomes, revenue growth, and runway | Quarterly |
| Reach and completion | People served and the share who finish the service | Trend against the annual goal, not a one-year snapshot | Quarterly |
| Cost per successful outcome | Program cost ÷ outcomes achieved | Compare with your history before comparing with other missions | Quarterly |
| Unrestricted revenue reliability | Unrestricted revenue ÷ total revenue, plus share from the top funders | Rising unrestricted share and less concentration | Quarterly |
| Donor or funder retention | Returning donors or funders ÷ prior-year donors or funders | Year-over-year improvement, paired with unrestricted growth | Annually |
Read the Families in Order
Financial capacity comes first because a mission without cash stops, however worthy it is. The first four rows tell you whether bills are covered, how much time you have, and whether this year's surplus is real after the full cost of staying open.
Operational delivery is next. The program and overhead ratios belong here as trends, not grades. For a broader view of measuring delivery quality and reliability, look at whether services arrive on time, at the promised quality, and without burning out the team delivering them.
Mission outcomes separate activity from change. An output is what you do, such as classes held. An outcome is what changes for a person, such as a credential earned.
Stakeholder engagement closes the loop. Unrestricted revenue gives you choices. Concentration takes them away. Retention shows whether supporters come back after seeing your work.
Why Four Families Beat One Ratio
A 2025 peer-reviewed study analyzing 2,222 indicators of nonprofit success across Vienna, Shenzhen, and the San Francisco Bay Area found recurring measures spanning goal attainment, resource acquisition, reputation, operational efficiency, internal relationships, and stakeholder engagement, as reported in Nonprofit Management and Leadership. Financial health mattered, but so did staff and volunteer quality, cohesion, and whether outsiders used the service.
That's why these not for profit performance indicators work as a system. They're the nonprofit version of the financial metrics every business owner should track, adapted to mission instead of profit.
Circle any row you can't calculate today. That blank isn't failure. It's your first improvement task.
How to Turn Liquidity into Months of Runway
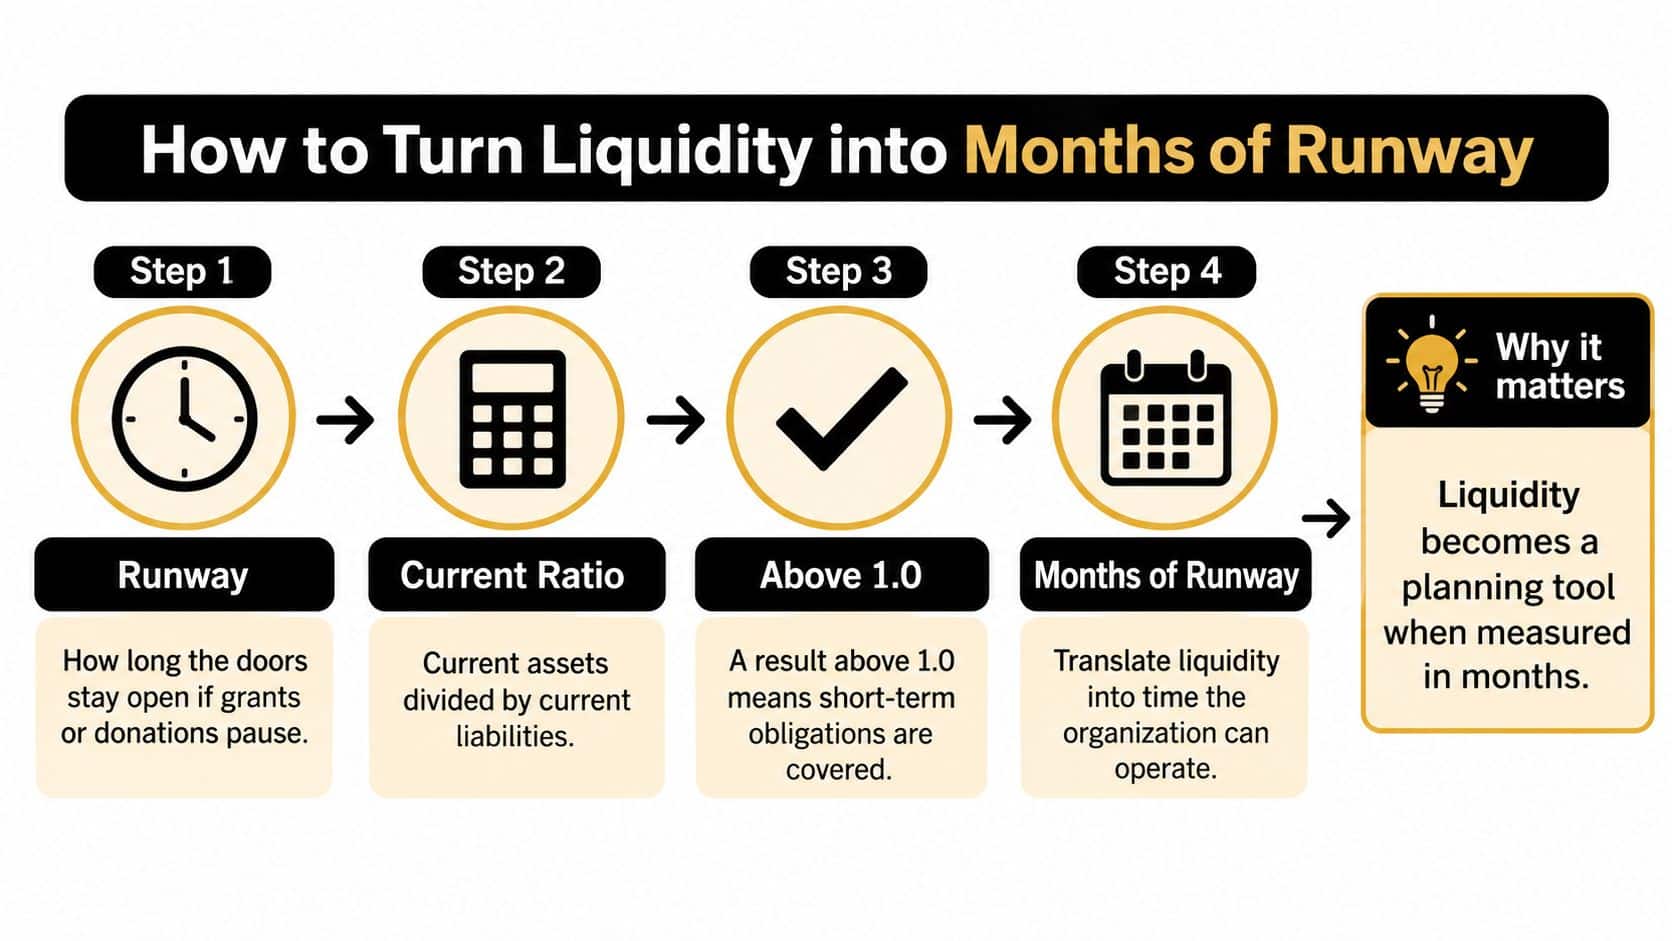
Runway means how long the doors stay open if grants or donations pause. Boards understand months faster than they understand abstract liquidity, so translate cash into time.
Start simple. The current ratio is current assets divided by current liabilities. Above 1.0, short-term assets exceed short-term bills. Below it, you're relying on future receipts to pay present obligations.
Five Steps to Expendable Reserves
- List net assets: Start with unrestricted and temporarily restricted net assets.
- Subtract what you can't spend: Remove net investment in property and equipment and other nonexpendable amounts.
- Find daily cost: Divide annual total expenses by 365.
- Convert to months: Divide expendable net assets by average daily expenses, then express the result in months.
- Strip out restricted cash: Exclude donor-restricted balances from available reserves and rerun the figure.
The Sage guide to nonprofit financial health metrics works the math this way: $900,000 in expendable net assets and $1.8 million in annual expenses means daily expenses of approximately $4,932, giving about 182 days, or 6 months, of coverage. It also multiplies by 30.4 to express days in months.
Say your own result is 2.4 months. You don't have a vague cash concern. You have about ten weeks before hard choices arrive.
Set the Target From Your Risk
Three to six months is a starting conversation, not a law. Raise the target when a few government contracts pay late, debt payments are heavy, or a program can't pause without harming people. Lower flexibility demands a bigger cushion.
Too little cash forces emergency cuts. Too much idle cash can mean the mission is sitting unfunded in a bank account.
What to Do at Each Level
Below three months, freeze net new hiring and nonessential capital. Rebuild a 13-week forecast of grant and donor receipts. Name, in writing, which program would shrink first, before a crisis names it for you.
Within six months, give the reserve a board-approved purpose. It's protection for a defined risk, not spare spending money that any budget overrun can absorb.
Recalculate monthly. Stress-test a 60-day grant delay, a 10 percent volume drop, and one surprise cost. If you want the mechanics behind the balance sheet side, a focused liquidity analysis helps you separate cash you own from cash you can use.
Program Ratios That Do Not Prove Impact
An organization reports $2.4 million of program expenses and $3 million of total functional expenses. That is an 80% program expense ratio and a 20% overhead ratio. It sounds efficient. The only thing it proves is how costs were classified; changed lives need different evidence.
Build It From Form 990
Use IRS Form 990, Part IX, as your map. Column A is total functional expenses. Column B is program services. Column C is management and general. Column D is fundraising.
- Program expense ratio: Column B ÷ column A.
- Overhead ratio: (Column C + column D) ÷ column A.
Those mechanics matter because allocations differ between organizations. One nonprofit puts a program director's full salary in program. Another splits supervision time into management. Same work, different ratio. A salary coded to program can raise the percentage without adding a single graduate, bed, or meal.
When More Overhead Builds More Mission
A longitudinal study of U.S. Habitat for Humanity affiliates from 2010–2016 found that higher overhead was associated with more houses built and greater revenue raised, with positive but diminishing returns once overhead exceeded roughly 15%, according to Nonprofit Management and Leadership. Other research on arts and cultural nonprofits suggests the overhead relationship is not always linear.
Staffing, technology, compliance, evaluation, and fundraising all sit in overhead. Each can raise the ratio while helping you reach more people or raise more money next year. Read overhead beside outcomes and months of runway: a starved back office and a bloated one can both fail the people being served.
Benchmark Without Worshipping the Number
Pull functional expenses for peers from public Form 990 filings. Match on budget size and program model. Compare your ratio with the peer median band and your own three-year trend, rather than with a single peer or a universal cutoff.
Say you're at 80%, your peer band runs from 70 to 85 percent, and your completion rate is falling. The ratio says you're normal. The people leaving mid-program say investigate before you cut or spend.
Place both ratios beside cost per beneficiary, outcome attainment, unrestricted revenue growth, donor retention, delivery capacity, and the months of runway already on your dashboard. A segment margin formula works the same way for a business line: it shows which part carries its weight instead of letting one blended percentage speak for everything.
Watch for thinning: If overhead falls while completions fall, you aren't getting more efficient. You're getting thinner.
Outcomes, Engagement, and What Counts as Success
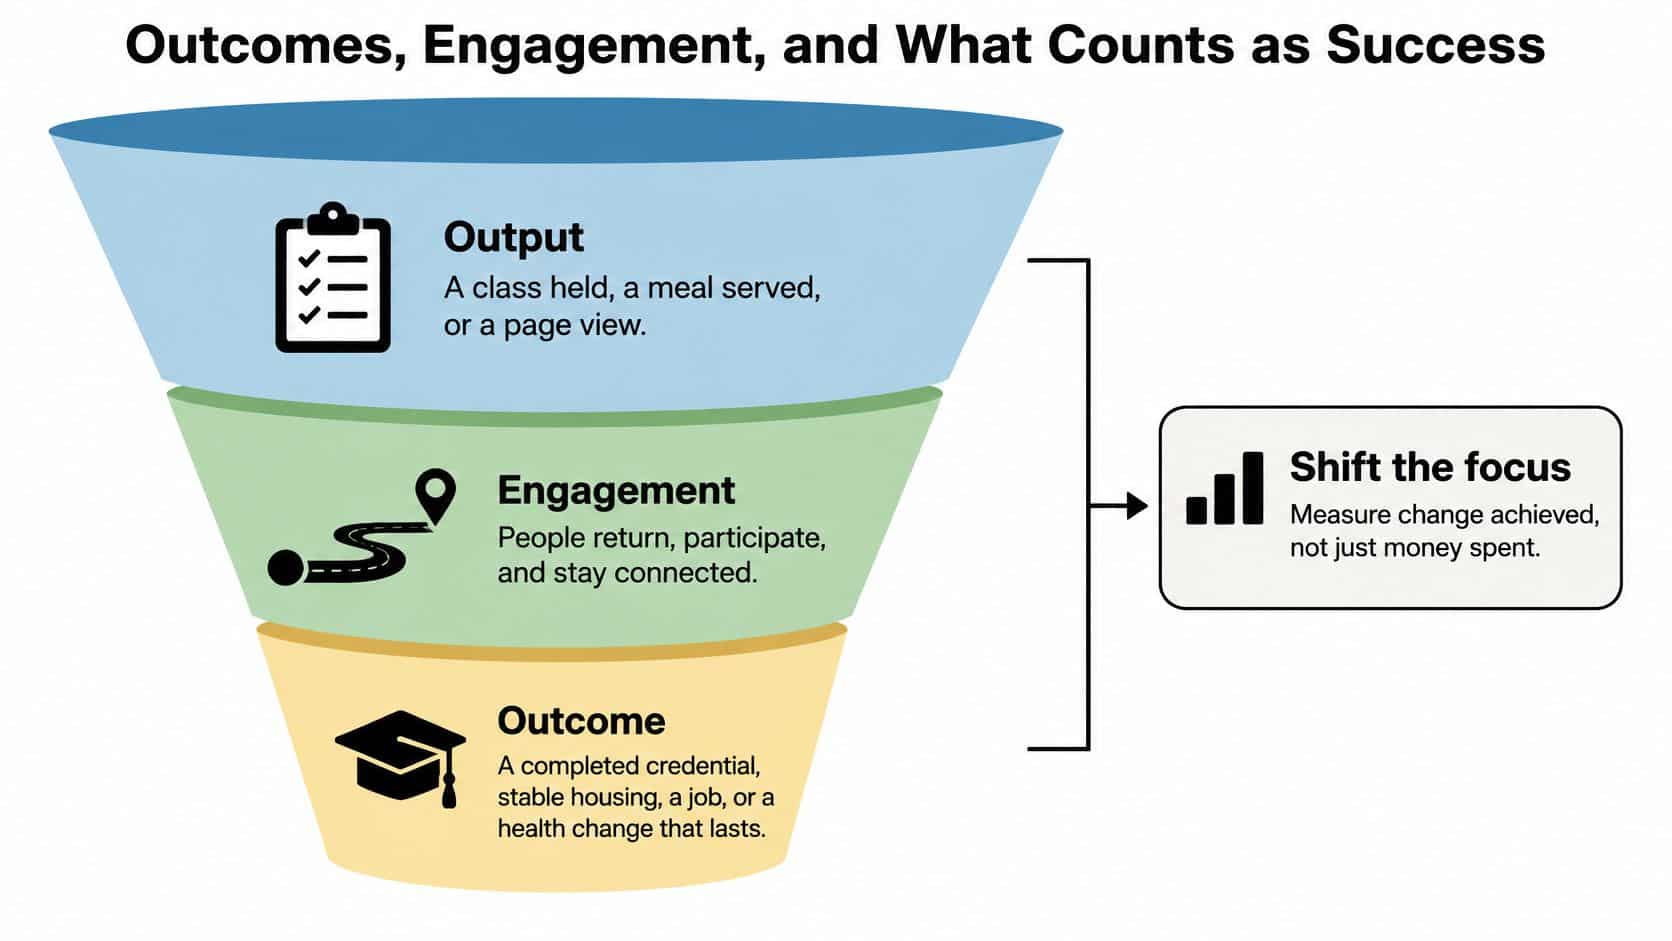
A class held is an output. A meal served is an output. A page view is an output. None of them tells you whether a person is better off.
An outcome is the change your mission promises. A completed credential. Stable housing. A job kept. A health measure that improves and holds.
Two Jobs for Outcome Data
A Harvard Business School working paper reported that approximately 84%–88% of surveyed organizations found outcome measurement useful for communicating results and identifying effective practices, while 76% said it helped improve service delivery.
Those are two different jobs. External accountability tells funders what happened. Internal learning tells your team what to change on Monday. Design for both, or the funder report will eat the learning.
Build a Three-Rung Ladder
- Leading indicators: Qualified inquiries, completed referrals, volunteer activation, and course completion tell you people are entering and moving.
- Intermediate indicators: Continued participation, service adherence, and repeat engagement tell you they stayed long enough for change to be possible.
- Outcome indicators: Knowledge gains, housing stability, employment, health, or policy change tell you the mission result arrived.
Report each rung with sample size, who is included, and what you can't claim. If half your participants vanish before follow-up, say so. A strong result on a thin sample is a hint, not a headline.
Apply the Same Test Online
Digital numbers flatter easily. Recent coverage in Johns and Taylor on measuring digital impact reports that only 30% of nonprofits use goal-conversion tracking effectively, even though 85% believe impact measurement improves fundraising, and it identifies budget constraints as the main technology obstacle for 89% of organizations and lack of in-house expertise for 64%.
A donation conversion proves fundraising worked. It doesn't prove a beneficiary's life improved. Page views may show curiosity, not service uptake. Connect each digital metric to a rung, or label it candidly as reach.
Start small. One program. One outcome. A before-and-after measure already sitting in case files. If you need a structure for that discipline, the grant evaluation advice from Grantlas offers a practical way to monitor whether funded work delivers what it promised.
Before your next meeting, write one sentence. Name the change a finished participant should be able to show. If you can't write it, you can't measure it yet.
Build the One-Page Board Dashboard and Start This Month
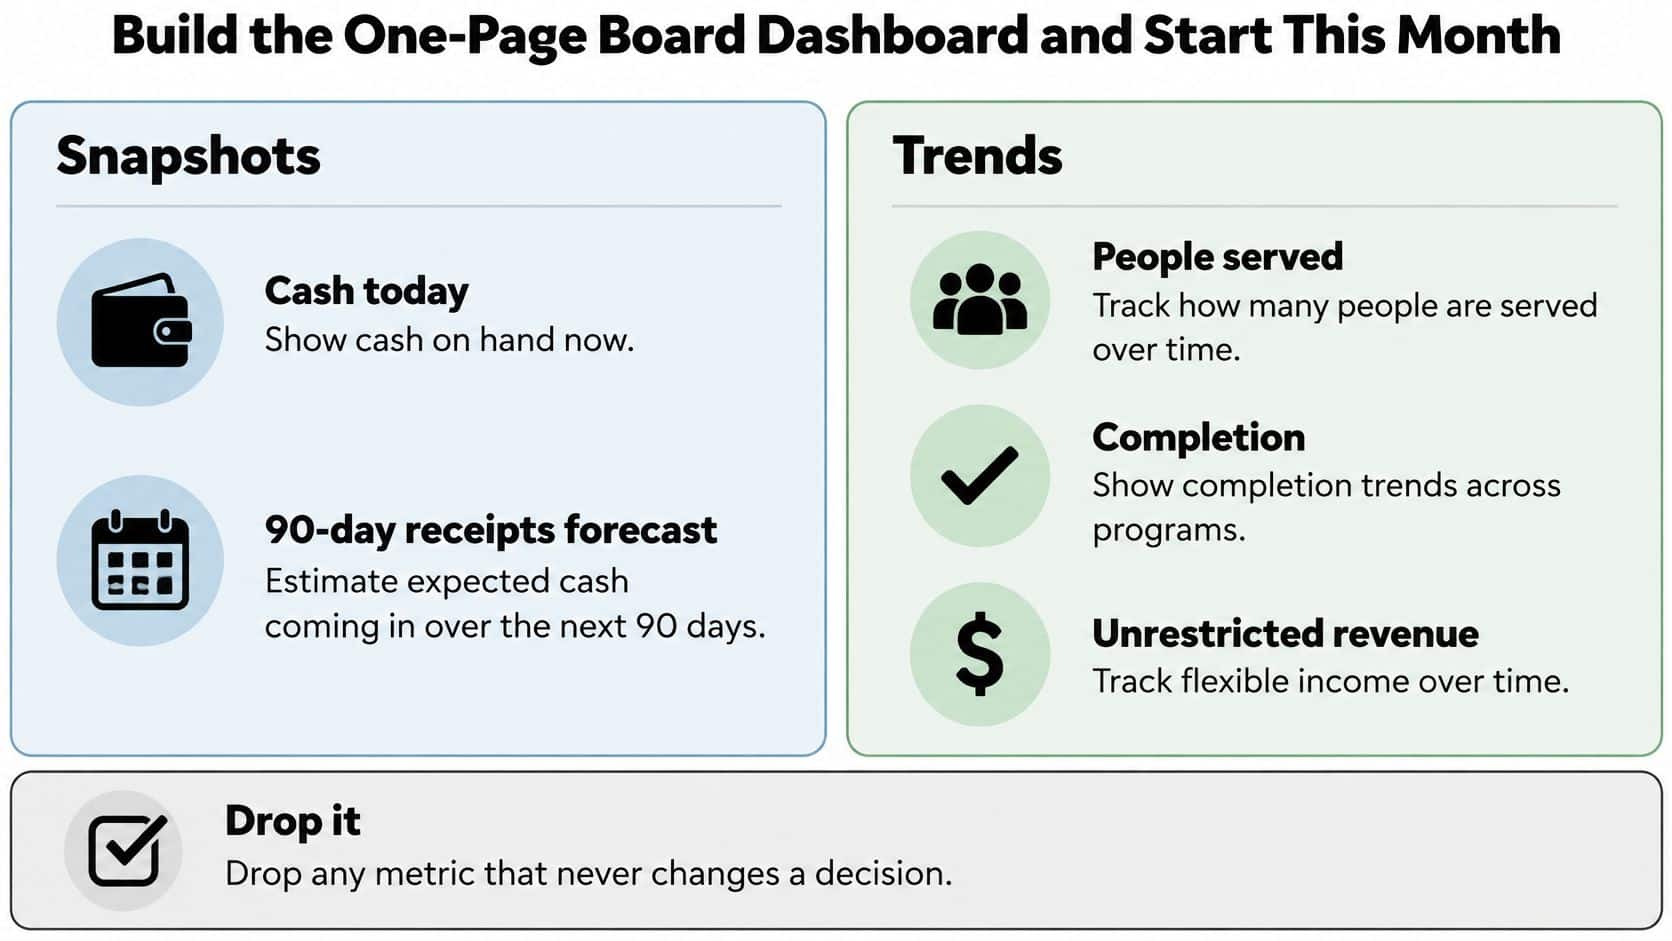
One page. That's the discipline. If it doesn't fit, you're reporting activity instead of governing.
Put snapshots on the left, cash today and a 90-day receipts forecast. Put trends on the right, people served, completion, and unrestricted revenue. A snapshot without a trend scares or soothes without context. A trend without today's cash invites confident plans you can't fund.
Let the Table Set the Agenda
Who reviews which indicators and when
| Meeting | Indicators on the page | Decision it should force |
|---|---|---|
| Monthly finance huddle | Current ratio, days cash on hand, reserve months, 13-week receipts forecast | Pause hiring or capital if reserves are under three months |
| Quarterly program review | People served, completion, cost per successful outcome, program ratio, overhead ratio, full-cost surplus | Grow, reprice, or redesign a program that looks lean but changes little |
| Annual board strategy | Four-family scorecard, peer comparison, reserve policy, staff and volunteer capacity | Reset next year's targets and the purpose of the reserve |
Each meeting owns different not for profit performance indicators and a different decision. That's what turns a report into governance. If you're building the mechanics from scratch, start with the basics of what a KPI dashboard is and keep the design boring. Boring gets read.
We build Executive KPI Dashboards that give leaders ongoing visibility into the metrics that drive value, and the same principle holds here. A dashboard nobody trusts by the third meeting is worse than a paper page everybody checks.
Test Break-Even Before You Celebrate It
The Nonprofit Finance Fund guide to top indicators of nonprofit financial health gives this example: unrestricted revenue of $5.2 million against operating expenses of $5 million produces a reported operating surplus of $200,000, or 4% of revenue. If the nonprofit also needs $120,000 for equipment replacement and $100,000 for planned debt principal payments, the apparent surplus is $20,000 short.
So management must raise revenue, reduce cost, or phase the purchases. A break-even budget that funds no asset renewal, no reserve contribution, and no cash timing isn't healthy. It's a slow leak with good manners.
Track it on one worksheet. Unrestricted revenue. Total operating expenses. Planned capital spending. Debt principal. Reserve contribution. Review it quarterly and ask whether growth is financially supported or consuming reserves.
Full-cost question: After renewal, debt, and reserves are funded, is anything actually left?
Your Four Moves This Month
First, fill the page. The executive director and treasurer complete the ten starter lines with the latest value, prior-year value, a named owner, and the meeting that reviews it. Before the next board meeting, finish at least the first six financial lines using last year's functional expenses and this month's cash balance.
Second, treat blanks as tasks. A blank line gets an owner and a date. It doesn't get deleted because the data is inconvenient.
Third, set the trigger. Adopt a temporary reserve aim of three to six months and write the sentence that starts a cash-preservation plan. For example, if reserve months fall below three, hiring and nonessential capital pause until the finance huddle releases them.
Fourth, pick one outcome. Choose one program and one outcome sentence. Share the draft page with the board chair before it reaches the full board, so the first conversation is about decisions, not formatting.
Benchmark only against peers of similar size and model. Your own trend matters more than a stranger's ratio.
The 90-day win isn't a prettier packet. It's a meeting that can say, in numbers, whether you have the fuel to continue and whether the work is changing lives.
Build your one-page scorecard this month, run the runway math, and bring the finished page to a conversation about what the numbers should change. At AmbitionCFO, we help leaders build KPI dashboards, 13-week cash flow models, and forecasts that turn reporting into decisions, and we'd be glad to review your draft page with you.