

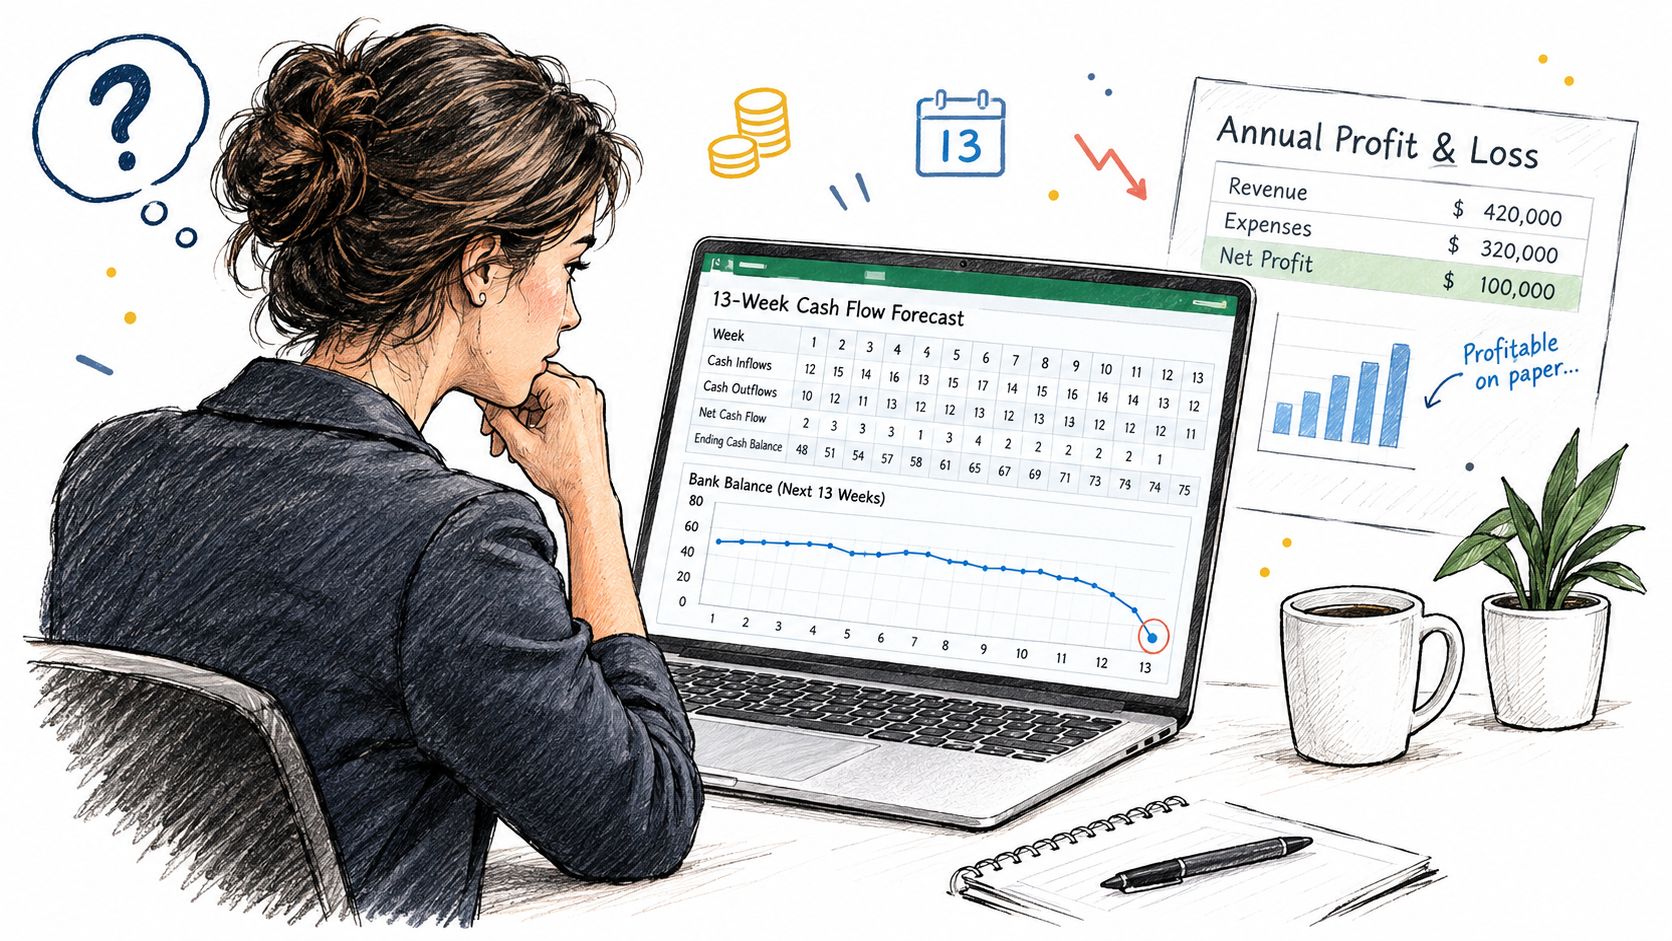
A founder watches the bank balance fall below Friday's payroll, despite a profitable week. Billings look fine, but materials, a tax estimate, or a subcontractor draw came due before customers paid.
A cash flow forecasting Excel template should show whether cash covers the next thirteen weeks. That means tracking dated receipts and payments, not relying on an annual profit view. A polished yearly file can still hide a two-week cash shortfall.
Excel has served as a familiar working tool for about four decades. Microsoft announced Excel for Apple Macintosh in 1985, followed by its first Windows version in 1987. By the mid-1990s, it had become the dominant spreadsheet, helping make its grid familiar across construction, distribution, and professional services. The history of Microsoft's 1985 launch covers its introduction, not a reason to trust a monthly budget pasted into a spreadsheet.
Build the workbook as a controlled 13-week decision model. Convert accounts-receivable aging and retainage into expected weekly receipts, then connect operating drivers to dated outflows. Use the model to identify a cash gap early and decide what to change. A familiar grid is useful only when its timing reflects how the business actually collects and pays.
Table of Contents
- Why Profit Still Leaves the Bank Short
- Sort Sources and Uses Before You Build
- Build the Rolling 13-Week Workbook
- Turn Aging into Weekly Cash Receipts
- Test Base Downside and Upside Cases
- Keep Forecast Accuracy Honest Each Week
- Choose Your Next Move on the Model
Why Profit Still Leaves the Bank Short
A founder-led contractor between $10 million and $100 million can post a strong week and still miss payroll. Sales cleared the target. Then wages, a materials release, and a tax payment hit the same ten days. Nothing on the income statement changed overnight. The operating account did.
A profitable week that still misses payroll
Cash-flow forecasting is a timing exercise, not a profitability exercise. An invoice can be revenue today while the deposit arrives 30, 60, or 90 days later. Payroll, subcontractors, rent, equipment, taxes, and debt leave on their own calendars. Academic tests of firm-level cash prediction, covering one period ahead and several periods ahead, found that a nonlinear grey-box model beat a linear panel benchmark out of sample. A single annual growth rate is the wrong engine for that job, as the Glasgow research on cash-flow prediction makes clear.
The dollar version of a timing miss: for a $10 million company, a 5% collection-timing error shifts $500,000 of receipts relative to plan. For a $100 million company, the same percentage is $5 million.
Weekly columns earn their place because payment timing is volatile. One model should hold beginning cash, expected collections, committed disbursements, discretionary spending, financing activity, and projected ending cash. You are looking for the week the balance slips under a floor you chose, not for a flattering year-end total.
If billings live in an operations system, the forecast is only as honest as the dates that system passes along. ERP deployment choices for SMB owners decide whether those dates stay current. Accrual books will still disagree with the bank until you finish converting accrual results into cash.
The workbook ahead is a rolling file you can update, stress, and use before you hire, buy equipment, or take a slow-pay contract.
Sort Sources and Uses Before You Build
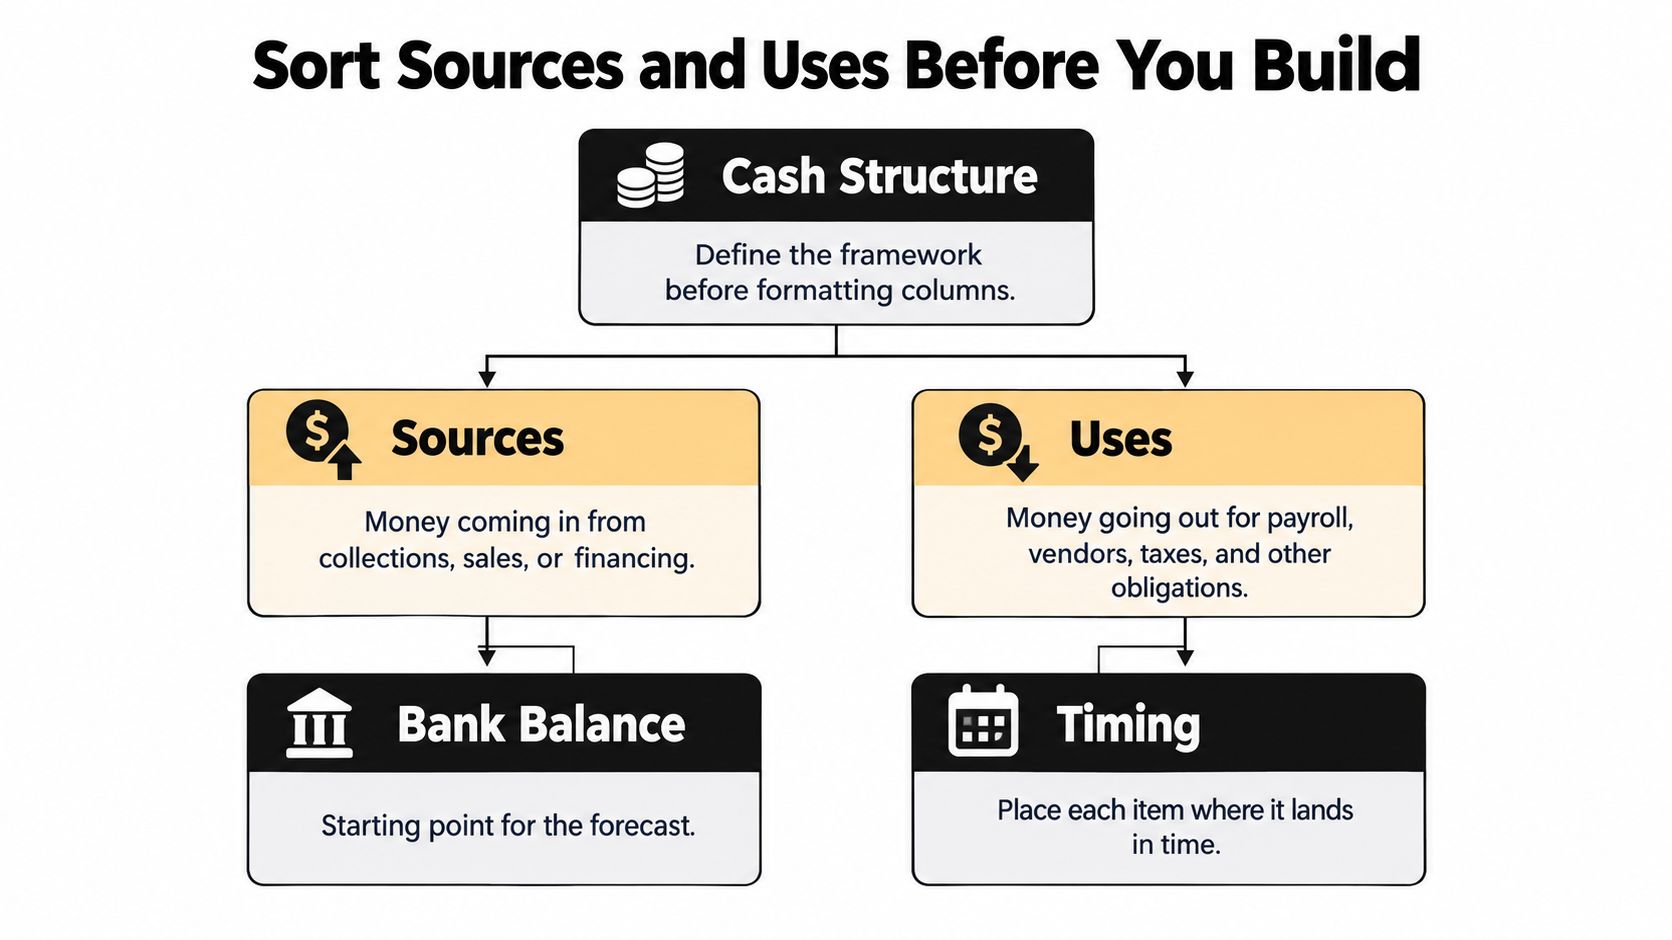
Formatting columns before you know the rows is how a profit-and-loss statement gets pasted into Excel and called a forecast. Classify the cash first.
Three buckets that belong on paper
FDIC guidance on sources and uses splits the list cleanly.
- Sources of cash: customer sales, interest, loan proceeds, and the cash already in the bank.
- Operating uses: the day-to-day cost of purchasing and selling. Payroll, materials, subcontractors, and ordinary vendor bills live here.
- Non-operating uses: equipment purchases, principal repayments, inventory build, taxes, and owner draws. These still reduce cash when the income statement looks healthy.
A contractor buying a skid steer is the clearest case. The purchase doesn't hit operating expense the way this week's crew or this week's materials do. It still leaves the account. Reported profit can stay positive while ending cash falls through the floor. If that line isn't on the sheet, the model will bless a purchase the bank can't fund.
The continuity rule
Total cash available minus total uses of cash equals ending cash. That ending cash is next period's opening cash. Link the cells. Don't retype the balance, because a retyped number is where continuity errors start.
Minimum cash is the floor you will not willingly cross. Name it before you open the file. It might be payroll plus a week of vendors, or the amount that keeps a covenant comfortable. The label matters less than refusing to discover the floor after you've already spent past it.
A shop that runs jobs in repair shop management software still has to place parts and payroll on the week cash leaves, not the week the ticket closes. The same discipline is what working capital management is for. Draft the row list on paper. Sources, operating uses, non-operating uses, then the minimum-cash line. Open Excel after that list is honest.
Build the Rolling 13-Week Workbook
The row list tells you what cash is. The workbook tells you when it lands. Build a rolling 13-week receipts-and-disbursements model, not a monthly profit forecast. Established 13-week setup guidance starts from cash you can verify and keeps actuals separate from forecasts.
What each week must calculate
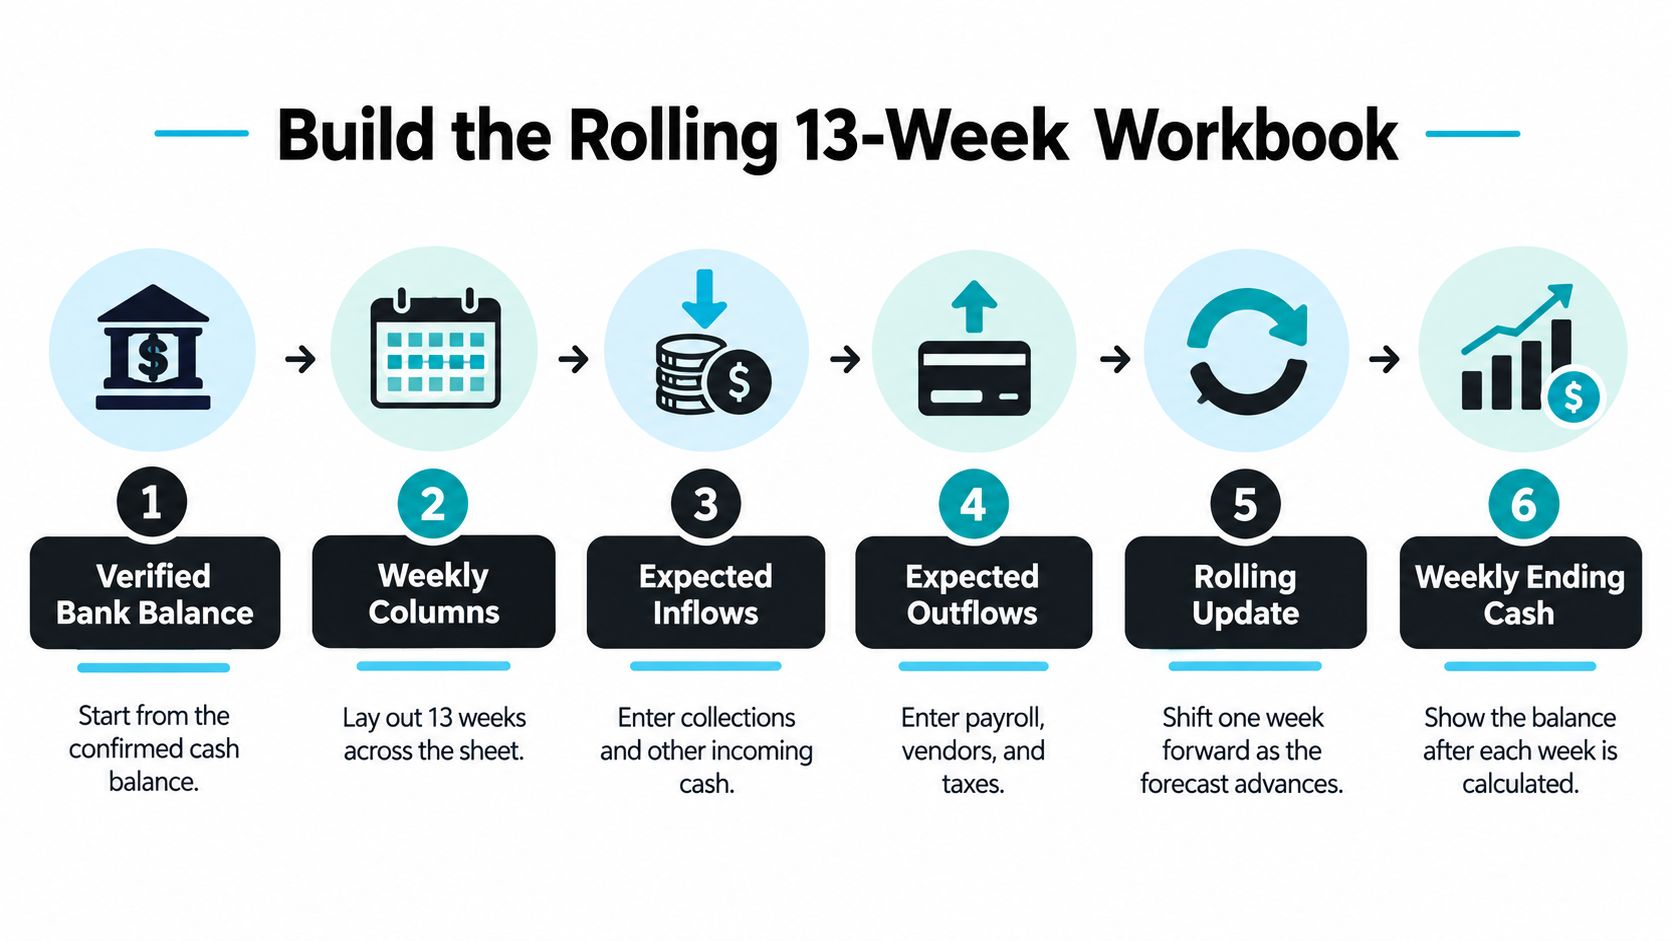
Start with the verified bank balance, not book cash. If the ledger disagrees, the bank wins for this purpose and the difference is a reconciliation job.
Lay thirteen columns, one week each. Give rows to customer receipts, payroll, taxes, subcontractors, inventory, debt service, capital expenditures, and other committed payments. For every week, total the inflows, total the outflows, compute net cash flow, and close with this identity.
Ending cash = beginning cash + inflows − outflows.
Roll that ending balance into the next week's beginning balance. On Monday, replace the week that just ended with actuals and add a new week thirteen so the horizon stays constant. Place receivables and payables on the expected settlement week, not the invoice date. Terms are a promise. Settlement is cash.
Signs, locks, and the Monday roll
Add three control pieces beside the weekly grid.
- An assumptions tab holds collection days, payroll changes, material timing, and planned capex. Drivers live here, not buried in formula cells.
- A variance tab sits ready for actual against forecast. You will use it every week.
- A scenario selector switches base, downside, and upside without copying the workbook three times.
Enter receipts as positive numbers and payments as negative numbers. FDIC small-business cash-flow instructions are explicit about the minus sign. Beginning cash of $80,000, receipts of $150,000, and outflows entered as −$190,000 produce ending cash of $40,000. Enter those same outflows as a positive $190,000 and the sheet reports $420,000. The liquidity problem disappears into a bad sign.
Protect every formula cell. Managers should edit assumptions and actuals. They should not be able to overwrite the roll-forward.
The practical outcome is a direct cash-in, cash-out model you can roll every Monday. Thirteen weeks is long enough to see a tax payment or an equipment deposit, and short enough that a wrong assumption gets corrected before it compounds into a fake year.
Turn Aging into Weekly Cash Receipts
The receipt row is where most monthly templates quit. They ask for "income" and call it cash. Construction retainage, milestone billing, overdue invoices, and extended terms make earned revenue a poor proxy for what hits the bank.
Intuit's 2025 small-business survey found that 56% of U.S. small businesses had outstanding invoices, averaging $17,500 owed, and 47% reported invoices more than 30 days overdue. Businesses with more overdue invoices were more than 1.4 times as likely to report cash-flow problems. Longer terms made it worse. 60% of small businesses with longer payment terms reported cash-flow problems, versus 40% among businesses with immediate terms. Your forecast should show that gap in weeks, not in a shrug.
Pick the method by week
A direct 13-week view uses three collection methods, matched to how far out you are looking. The 13-week cash flow forecast method is the clean split.
How to Place Collections Across 13 Weeks
| Method | Best weeks | What it uses |
|---|---|---|
| Aging assignment | Weeks 1–4 | Specific open invoices placed on the week you expect payment |
| Collection curve | Weeks 5–13 | Historical collection percentages applied to sales not yet invoiced |
| DSO-style estimate | Outer weeks, quick read only | A days-sales-outstanding average when invoice detail isn't available yet |
Keep retainage and disputed invoices off the ordinary schedule. They are not "net 30 with a delay." They are cash you may not see until a punch list closes or a claim is settled. Give them their own rows and a probability you are willing to defend.
Reconcile forecast receipts to the accounts-receivable ledger every week. If the aging report says customers owe a number and the receipt schedule adds up to something else, the model has drifted. Fix the schedule, not the ledger.
An auditable trail from invoice to expected week is what building an auditable collections process is for. Pair that schedule with a projected sales forecast so unbilled work enters the curve instead of arriving as a lump called "revenue." The controller's job is to refresh the receipt weeks from the aging report, not to type a monthly income guess.
Test Base Downside and Upside Cases
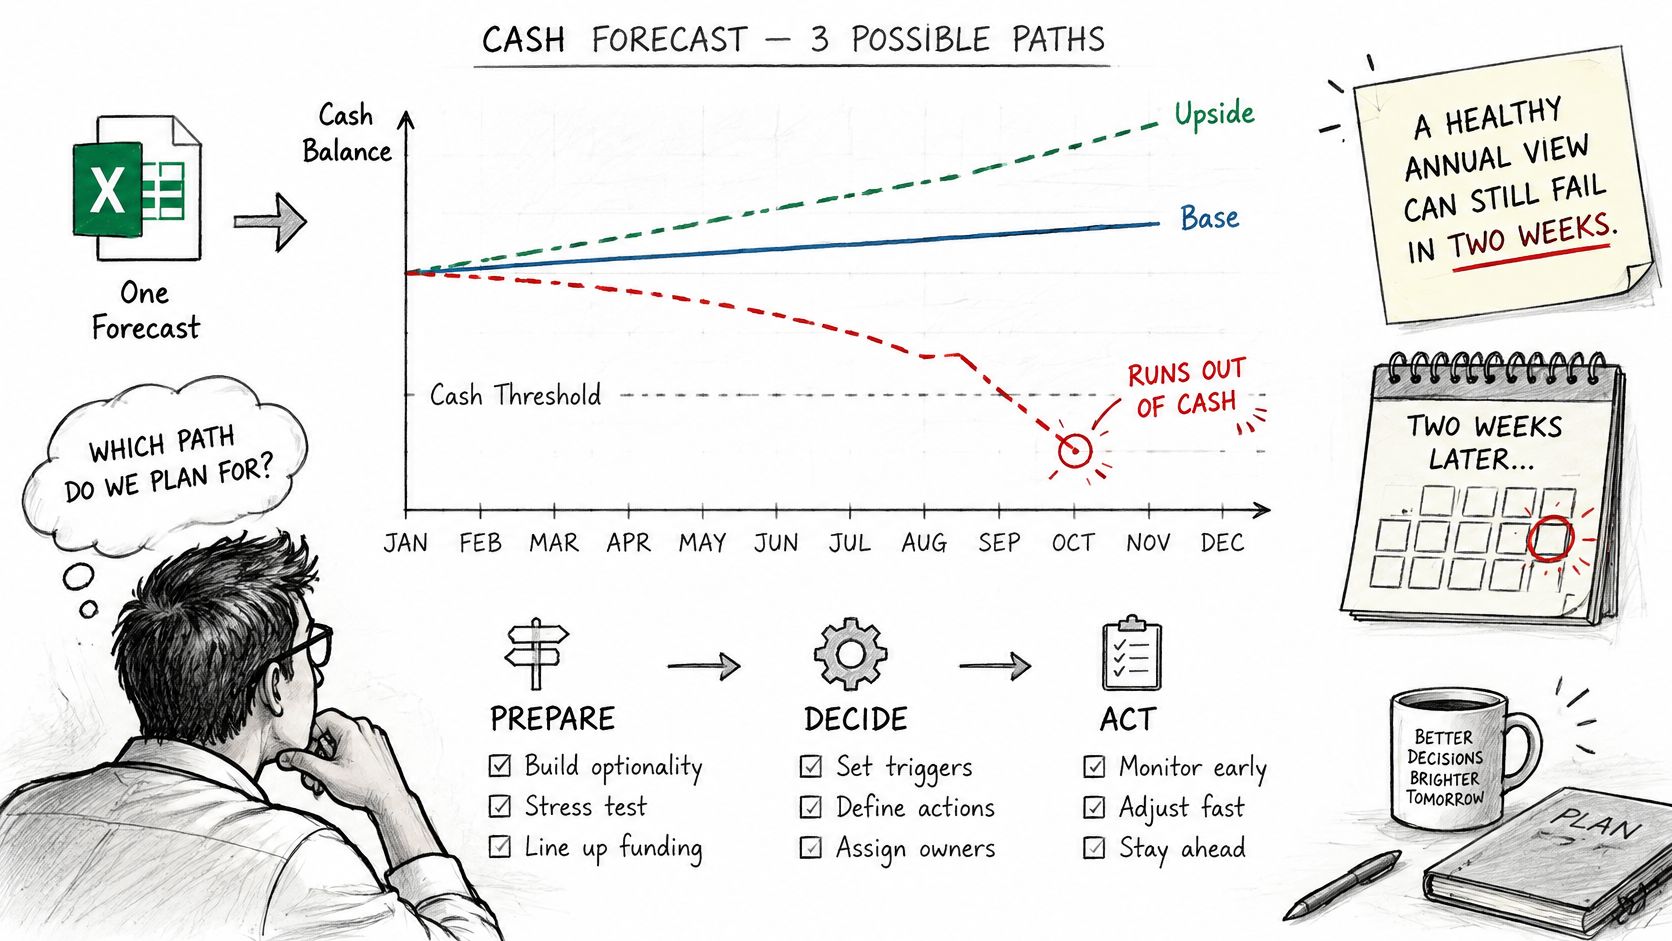
One calculated path is a starting point. Decisions need three. A polished twelve-month view can look healthy while cash fails in two weeks. Driver-based scenario planning starts with collection days, backlog conversion, labor, gross margin, supplier terms, and planned capital spending. It does not start with a blanket growth percent applied to last year's profit.
Three decisions on the same drivers
Build the cases from moves you might make.
Base uses the collection pattern you can defend, the payroll you have, and capex already committed. This is the path you manage to unless a driver breaks.
Downside delays collections, raises payroll, pulls material purchases forward, and drops in one unexpected payment. If ending cash breaks the minimum here, you don't have a plan. You have a hope.
Upside only accelerates cash you can collect or spending you can defer. A fantasy "customers pay faster" case is not a strategy.
Walk three choices on that same grid. A hire shows up as payroll in specific weeks, not as an annual salary divided by twelve. An equipment purchase moved earlier is a non-operating use in that week. Check whether ending cash stays above minimum cash, and whether the binding constraint is borrowing capacity, payroll coverage, or covenant headroom. A large contract with slow pay can lift the backlog and still starve weeks three through eight.
Name the action on the case before you fall in love with the chart. Delay the purchase, invoice the milestone sooner, or line up financing before you sign.
That is scenario planning in operating language. You should be able to say what happens if collections slow, a project slips, or payroll rises, and which case you will run the business against.
A short walkthrough of how operators read those paths:
Keep Forecast Accuracy Honest Each Week
Scenarios imagine a future. Monday checks last week. A clean layout is not accuracy.
Treat these bands as planning targets, not laws. Aim for about ±5% variance on one-to-three-month forecasts, and tolerate about ±15% on six-to-twelve-month views. The cash-flow forecast planning benchmarks present them that way. The same discussion notes that organizations with strong cross-functional cash visibility can reach up to 90% quarterly accuracy against cash-flow targets, and it cites a widely repeated warning that 88% of spreadsheets contain errors. Treat 88% as a risk flag for this workbook, not as a measurement of your file.
A variance habit, not a prettier sheet
Each week, by line, compute (actual − forecast) ÷ forecast. Label the miss before you "fix" the number.
- Timing: the cash was real and landed in the wrong week.
- Volume: the amount of work or purchasing was wrong.
- Price: the rate, discount, or unit cost moved.
- Omission: a tax payment, bonus, or draw was never on the sheet.
A paired projected-and-actual layout makes that label obvious. Erie County's cash-flow spreadsheet instructions put projected figures in as cash expected during the month and actuals in after close, rounded to the nearest dollar. If January collections were forecast at $120,000 and came in at $105,000, the variance is −$15,000. One miss can be noise. The same miss for three weeks means the collection assumption is wrong, and every future week inherited it.
The people who own collections, purchasing, payroll, and operations refresh their drivers. A founder guessing all four will drift. Broken formulas, hard-coded assumptions, inconsistent dates, and a model that isn't tied to the bank are how a handsome sheet lies.
Lock formula cells. Use data validation on dates and signs. Add a reconciliation test to the bank balance and a flag when ending cash goes negative. More on building that rhythm sits in this note on forecasting accuracy. The payoff is a forecast you trust enough to time vendor payments and tax remittances instead of discovering them on the day they clear.
Choose Your Next Move on the Model
You don't need another annual template. You need an owner for the one you just designed.
Keep the 13-week file in-house if you will update assumptions every week, tie it to the bank, and look at the downside before you hire or buy. That discipline is enough for many owners.
Ask the bookkeeper for actuals and the bank tie, not for the strategy. Clean history is essential. It is not a decision about a contract, a crew, or a machine.
Bring in senior help when capital decisions, job margins, or an exit in the next three to ten years outgrow a spreadsheet you maintain alone. AmbitionCFO, led by John Myklusch, works with founder-led construction, distribution, and professional-services companies from $10 million to $100 million that want 13-week cash modeling, margin analysis, forecasting, KPI dashboards, and exit planning without a full-time CFO salary above $200,000. The firm embeds with the owner, works nationally from Orlando, and does not replace bookkeeping, tax, audit, valuation, or fundraising.
Open a blank workbook this week. Enter this morning's bank balance. Map the next thirteen Fridays with collections from the aging report and every committed payment on its real date. If any Friday sits under your cash floor, don't wait for the month-end package to admit it.
AmbitionCFO builds and runs the 13-week cash model with founder-led owners so hiring, equipment, and contract decisions sit on weekly cash instead of a flattering annual file. The work covers cash timing, margins, forecasts, and exit planning for construction, distribution, and professional services. If your first thirteen Fridays already show a week under the floor, visit AmbitionCFO and put a senior forecast owner on it.