

Your income statement says the business had a strong month. Revenue is up, gross margin looks healthy, and the profit line gives you confidence to hire, buy equipment, or take on a larger contract. Then payroll is due, suppliers are calling, and the bank balance is lower than it should be.
The question you're trying to answer is simple: why is a profitable business still short of cash, and which operational decision will release it? The answer usually sits inside your working capital cycle, not in the profit and loss statement. This guide shows you how to calculate it, find the trapped cash, manage it with a rolling 13-week forecast, and turn better cash conversion into a stronger business before an eventual exit.
Table of Contents
- The Profitability Illusion and Cash Flow Reality
- Deconstructing the Cash Conversion Cycle Formula
- Global Benchmarks and Industry Realities
- Working Capital Traps in Construction and Distribution
- Optimizing Liquidity with 13-Week Cash Flow Modeling
- The Hidden Risks of Aggressive Cycle Shortening
- Connecting Cash Conversion to Exit Planning and Valuation
The Profitability Illusion and Cash Flow Reality
A founder-led distributor wins a large customer. The sales team celebrates, the income statement records revenue, and the gross profit appears attractive. But the company has purchased stock before the customer pays, carried payroll and freight costs during fulfillment, and accepted payment terms that push collections well beyond delivery. Growth has increased the accounting profit while reducing the cash available to operate.
That isn't a bookkeeping error. Profit measures economic performance. Cash measures timing. A sale can improve profit immediately while the related cash remains trapped in inventory or receivables. If suppliers require payment before customers settle invoices, the owner funds the gap through retained cash, an overdraft, or expensive short-term borrowing.
The working capital cycle is the hidden mechanism behind that gap. It tracks the time between paying for operating inputs and collecting cash from customers. A longer cycle forces the business to finance more activity internally. A shorter cycle gives the owner more flexibility to fund hiring, equipment, debt reduction, or growth without constantly asking the bank for help.
Practical rule: Revenue growth is only valuable when your business can convert it into usable cash without creating a larger financing requirement.
The symptoms of a bloated cycle
You'll often see the problem before you calculate the metric. Warning signs include:
- Receivables rising faster than revenue: Sales are being recorded, but customers aren't paying at the same pace.
- Inventory accumulating: Cash is sitting in finished goods, work in progress, or materials that haven't produced a sale.
- Supplier pressure increasing: Vendors are shortening terms, placing accounts on hold, or requiring deposits.
- Profit without liquidity: The business reports earnings but struggles to fund ordinary payroll, tax, or supplier obligations.
- Growth requiring emergency finance: Every new contract creates another cash shortage instead of strengthening the bank balance.
Your first diagnostic should connect the accrual numbers to actual cash movement. The accrual-to-cash conversion guide provides a useful framework for making that translation. For a broader perspective on how finance supports operational decisions, Bridge Global's perspective on strategic finance is also worth reviewing.
Don't chase more sales until you know how much cash each sale consumes and when it returns. A founder who fixes collections, inventory discipline, and payment timing can improve liquidity without adding a single new customer. That's often a faster route to control than pushing the sales team to produce more top-line growth.
Deconstructing the Cash Conversion Cycle Formula
The core measurement behind the working capital cycle is the Cash Conversion Cycle, or CCC:
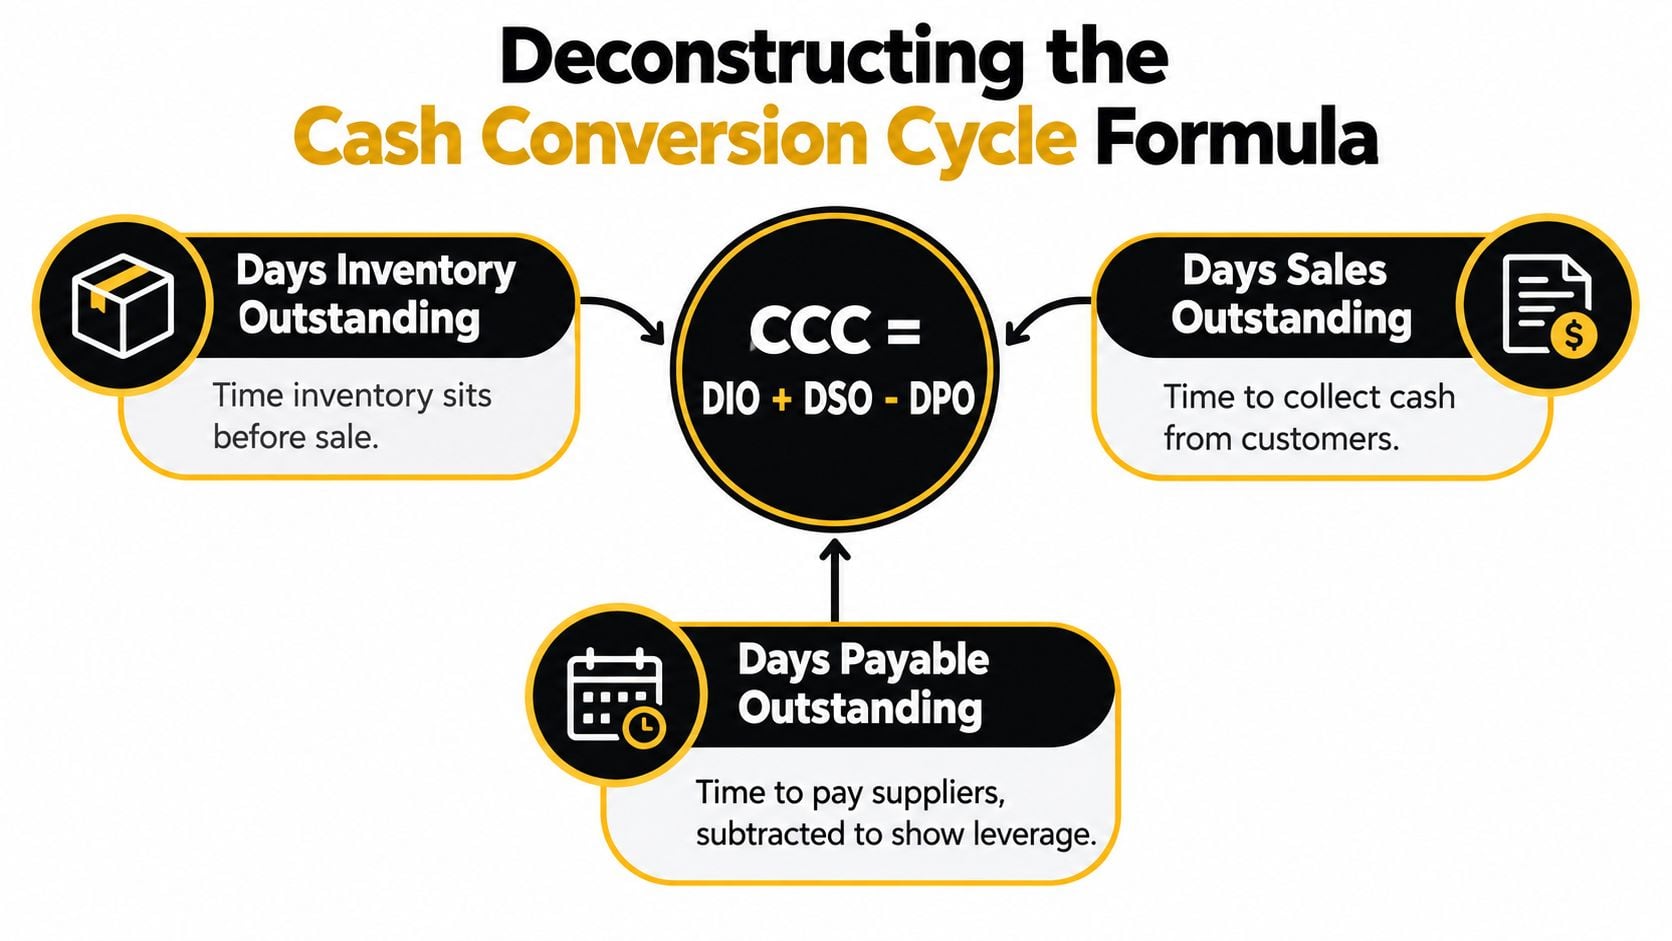
CCC = Days Sales Outstanding + Days Inventory Outstanding − Days Payables Outstanding
Finance teams also express the same structure as DIO + DSO − DPO. The result is a net-days measure of how long operating cash remains tied up between paying suppliers and collecting from customers, as explained by JPMorgan's working capital benchmarking guide.
DIO shows where inventory cash is parked
Days Inventory Outstanding, or DIO, measures how long inventory sits before sale. A high DIO can indicate overbuying, weak demand forecasting, slow production flow, obsolete stock, or purchasing decisions made without reference to customer demand.
Use this calculation:
DIO = (Average Inventory / COGS) × Days in Period
The operational levers are specific. Review purchasing quantities, identify slow-moving items, separate essential stock from speculative stock, and connect reorder decisions to actual sales velocity. The inventory turnover ratio guide can help you examine that relationship from another angle.
DSO exposes collection friction
Days Sales Outstanding, or DSO, measures how long customers take to pay after a sale. It captures the consequences of unclear billing, disputed invoices, weak credit controls, missed approvals, milestone delays, and inconsistent follow-up.
Calculate it as:
DSO = (Average Accounts Receivable / Revenue) × Days in Period
JPMorgan cites 30 days or less as standard for most B2B trade, although your own customer mix and contracts determine whether that benchmark is realistic. Treat DSO as an operating metric, not an accounting statistic. The owner should know which customers create the delay, which invoices are disputed, and which internal handoff prevents payment.
DPO is supplier timing, not free cash
Days Payables Outstanding, or DPO, measures how long the company takes to pay suppliers. Its formula is:
DPO = (Average Accounts Payable / COGS) × Days in Period
A higher DPO can preserve cash, but only when the business pays according to agreed terms and maintains supply continuity. The calculation tells you how much supplier financing exists. It doesn't tell you whether that financing is sustainable.
To calculate your own cycle, pull average inventory, average accounts receivable, average accounts payable, COGS, revenue, and the relevant reporting period from your accounting system. Calculate each component separately before combining them. If the CCC is worsening, you'll know whether the cause is inventory, collections, supplier timing, or a combination.
Global Benchmarks and Industry Realities
Founders regularly ask for the “right” working capital cycle number. That question is incomplete. A service firm with minimal inventory and rapid billing operates under different cash economics from a distributor carrying stocked products or a contractor funding materials and labor before collecting a milestone payment.
The global environment has made that distinction more important. Allianz Trade's 2025 analysis found that global CCC rose above 67 days of turnover in 2025, about 3 days above its 10-year average and roughly 4 days longer than the pre-2020 level of 63 days. The analysis also found that DIO represented almost 80% of the CCC level and more than 80% of its change across 2014–2025.
That finding matters operationally. Inventory, not just collections, has become the dominant source of working capital pressure in the global data. If your management team only discusses overdue invoices, it may be ignoring the larger cash commitment sitting in stock and work in progress.
What the broader benchmark says
A separate historical benchmark placed global working capital requirements at 76 days of turnover at the end of 2023, the highest level since 2008 and 2 days higher than the prior year. The same analysis estimated approximately €1.56 trillion of excess working capital could be released worldwide, based on more than 19,000 listed companies. In the United States, large public companies improved in 2024, with average CCC falling to 37 days from 38.3 days in 2023, a shift of about 1.3 days. These figures come from Allianz's working capital research.
Use those figures as context, not as a target for your company. A universal CCC goal can lead you to cut inventory that protects service levels or pressure suppliers who are critical to delivery.
DSO Benchmark Escalation Thresholds
| DSO Range | Classification | Action Required |
|---|---|---|
| Under 15 days | Very fast | Preserve the process and verify that sales terms support profitable growth |
| 15–30 days | Strong | Monitor customer mix and prevent slippage |
| 30–45 days | Healthy | Review trends and isolate problem accounts |
| 45–60 days | Watch zone | Escalate collections, billing quality, and credit controls |
| 60–90 days | High or fragile | Treat collections as a leadership priority and model the funding gap |
These thresholds are a practical guide, not a universal rule. Zoho's cash conversion cycle guide emphasizes that benchmarks must reflect the industry and business model. Set your baseline from your own historical trend, customer contracts, inventory requirements, and service promises. Then manage the direction of travel every month.
Working Capital Traps in Construction and Distribution
A construction company can report an acceptable gross margin on a project while the bank account deteriorates. The contractor pays labor, subcontractors, materials, insurance, and equipment costs as work progresses. The customer pays after a milestone is approved, and retainage or disputed change orders can delay the final collection. The margin may be real, but the cash timing is hostile.
Distribution creates a different trap. The owner buys in bulk to secure availability, pricing, or customer service levels. Supply chain delays encourage even more safety stock, while slow-moving products consume warehouse space and cash. The company may sell at a healthy margin, yet DIO keeps expanding because purchasing decisions are disconnected from actual demand.

Construction needs billing discipline
Construction and project-based companies should review the full path from work performed to cash received:
- Contract setup: Confirm billing milestones, approval requirements, retainage provisions, and change-order procedures before work begins.
- Field documentation: Make sure project managers submit evidence needed for invoice approval without delay.
- Invoice accuracy: Eliminate avoidable disputes caused by missing backup, incorrect quantities, or unapproved changes.
- Job cost visibility: Compare committed costs with the billing schedule so overruns don't consume cash unnoticed.
- Collection ownership: Assign responsibility for each open receivable instead of treating collections as an administrative task.
For a deeper operating framework, use this construction cash flow management resource. Visibility across orders, inventory, deliveries, invoices, and supplier commitments also matters. Kagool's supply chain visibility insights offer useful context for connecting those operational signals.
Distribution and services need different controls
Distribution leaders should segment inventory by demand, margin, and strategic importance. A product that protects a key account may deserve stock even when its turns are slower. A product with weak demand and no strategic value deserves a liquidation plan, not another purchase order.
Professional services businesses often carry less physical inventory, but that doesn't make the cycle irrelevant. Unbilled work, delayed timesheets, milestone invoicing, client approvals, and long payment terms can create a receivables-heavy cycle. The fix is usually earlier billing triggers, tighter scope control, and a weekly review of delivered work that hasn't yet become an invoice.
The right question isn't “which department caused the cash problem?” It's “which operational handoff delayed conversion?” Construction, distribution, and services each need a different answer.
Optimizing Liquidity with 13-Week Cash Flow Modeling
Payment terms alone won't manage a dynamic working capital cycle. A historical income statement tells you what the business recognized. A balance sheet shows what remained at a reporting date. Neither reliably tells you whether cash will cover the supplier run, payroll, debt service, and tax obligations in the next few weeks.
A 13-week cash flow model gives leadership a forward view of actual cash timing. Build it weekly, use realistic collection dates rather than invoice due dates, and update it every week. The model should show opening cash, customer receipts, payroll, suppliers, taxes, debt, capital spending, and other material outflows.
Turn CCC levers into weekly decisions
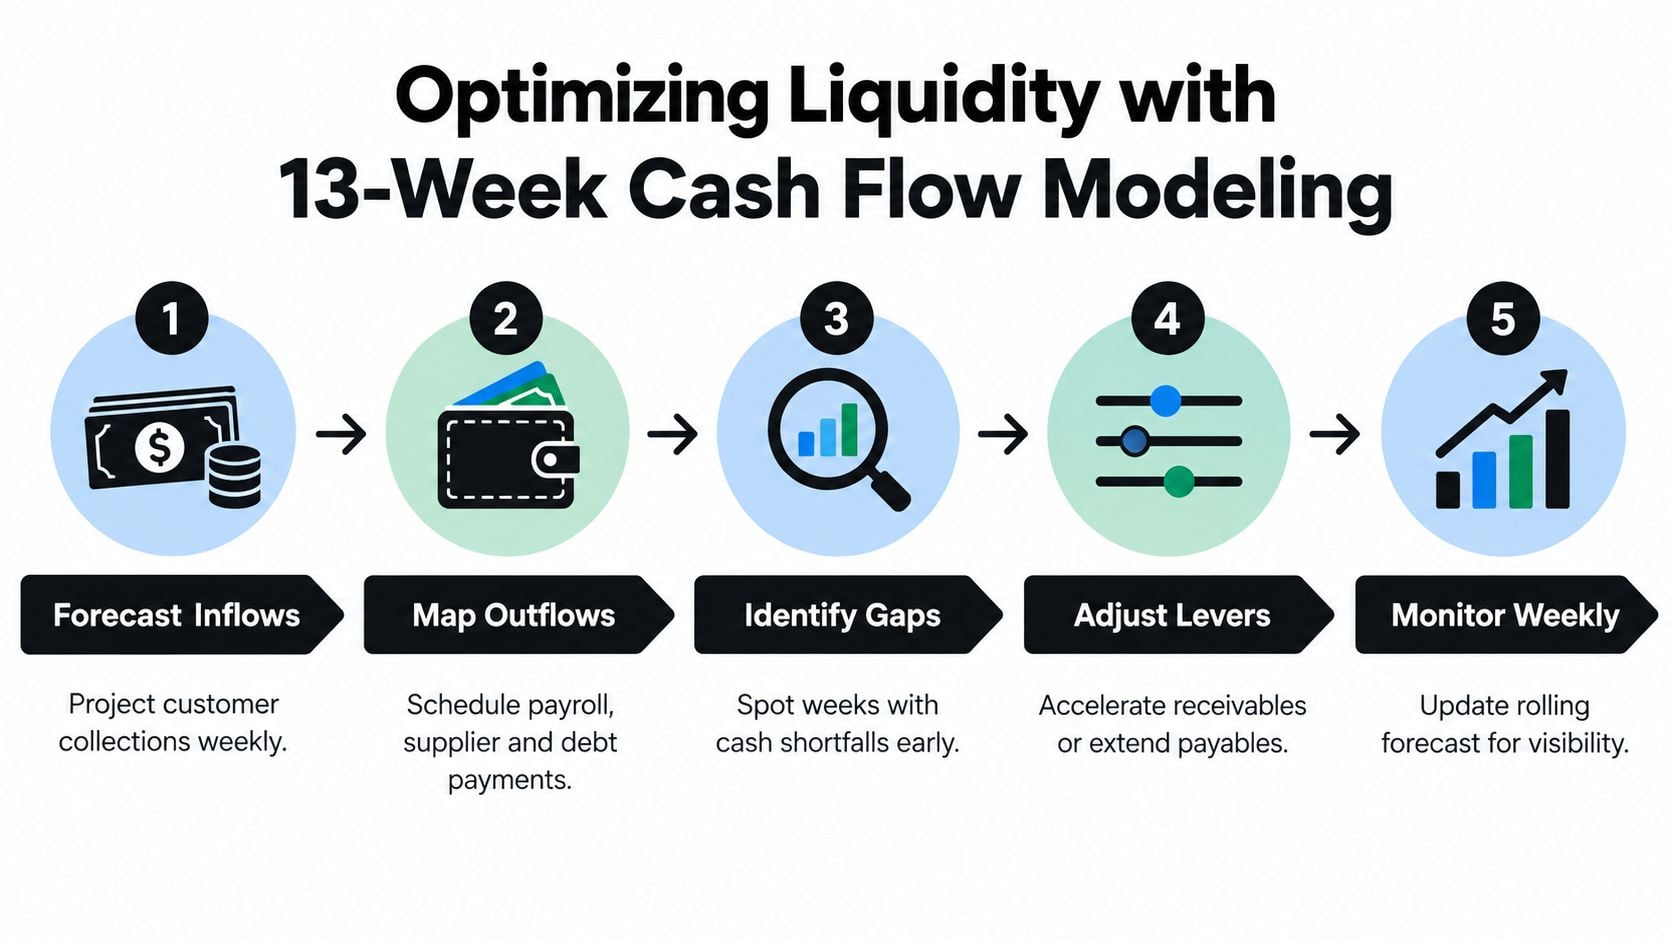
Map each working capital initiative to the week in which cash should move:
- Forecast inflows: List expected customer collections by account and expected receipt week. Separate committed receipts from optimistic assumptions.
- Map outflows: Schedule payroll, supplier payments, debt service, taxes, rent, and planned capital expenditures.
- Identify gaps: Flag weeks where the projected bank balance falls below the operating cushion your leadership team requires.
- Adjust levers: Pull forward valid invoices, resolve disputes, change purchasing dates, sequence capital spending, or negotiate supplier timing responsibly.
- Monitor weekly: Replace assumptions with actual receipts and payments, then extend the forecast with another future week.
The 13-week cash flow modeling guide provides a practical foundation for building this process.
Test the operational consequence
Suppose your team wants to reduce inventory purchases. Don't record the decision as a generic cost-saving initiative. Identify the purchase orders affected, the expected cash dates, the customer orders at risk, and the service impact if stock arrives late. Then place those changes into the forecast.
Do the same with receivables. If a customer promises payment, record the promise separately from the probability of receipt. If a payment slips, update the forecast immediately. A model that remains unchanged after actual cash misses is a report, not a management tool.
AmbitionCFO offers fractional CFO support that includes 13-week cash flow modeling, working capital analysis, KPI reporting, and forecasting for founder-led businesses. The value of the process is not the spreadsheet itself. It's the weekly operating discipline that connects finance, sales, purchasing, project delivery, and leadership decisions.
The Hidden Risks of Aggressive Cycle Shortening
Shortening the working capital cycle usually improves liquidity, but the wrong method can weaken the operating model. Stretching DPO by paying suppliers late may preserve cash in the immediate period while damaging trust, removing favorable commercial terms, or making a critical vendor less willing to reserve scarce inventory.
The same problem appears when owners cut DIO without understanding service requirements. Excess inventory is expensive, but stockouts can interrupt project schedules, delay customer deliveries, and damage relationships. A lower number isn't automatically a better business outcome.
Optimize the system, not one metric
Use a decision test before changing any lever:
- Customer impact: Will tighter credit or faster billing damage a valuable relationship?
- Supplier impact: Are revised payment practices consistent with agreed terms and commercial reality?
- Operational impact: Could reduced inventory create missed deliveries or production disruption?
- Forecast impact: Does the 13-week model show a real cash benefit, and when will it arrive?
- Exit impact: Will a buyer see repeatable process improvement or a temporary pull-forward of cash?
Receivables pressure has remained structural. PwC found that DSO rose from 47.3 days in 2015 to 50.0 days in 2024 across company sizes and regions, as reported in Deloitte's working capital management report. That makes collection process quality more valuable than a one-time push to collect a few large invoices.
Buyers also notice whether cash conversion is dependable. A company that produces a strong quarter by delaying suppliers may face questions when normal terms resume. A company with documented billing controls, disciplined purchasing, and predictable collections presents a more durable operating model.
Working capital optimization becomes hidden risk transfer when the business moves pressure from its own bank account onto customers, suppliers, or service delivery without removing the underlying friction. Preserve the relationships that protect revenue and supply, then improve the process that causes the delay.
Connecting Cash Conversion to Exit Planning and Valuation
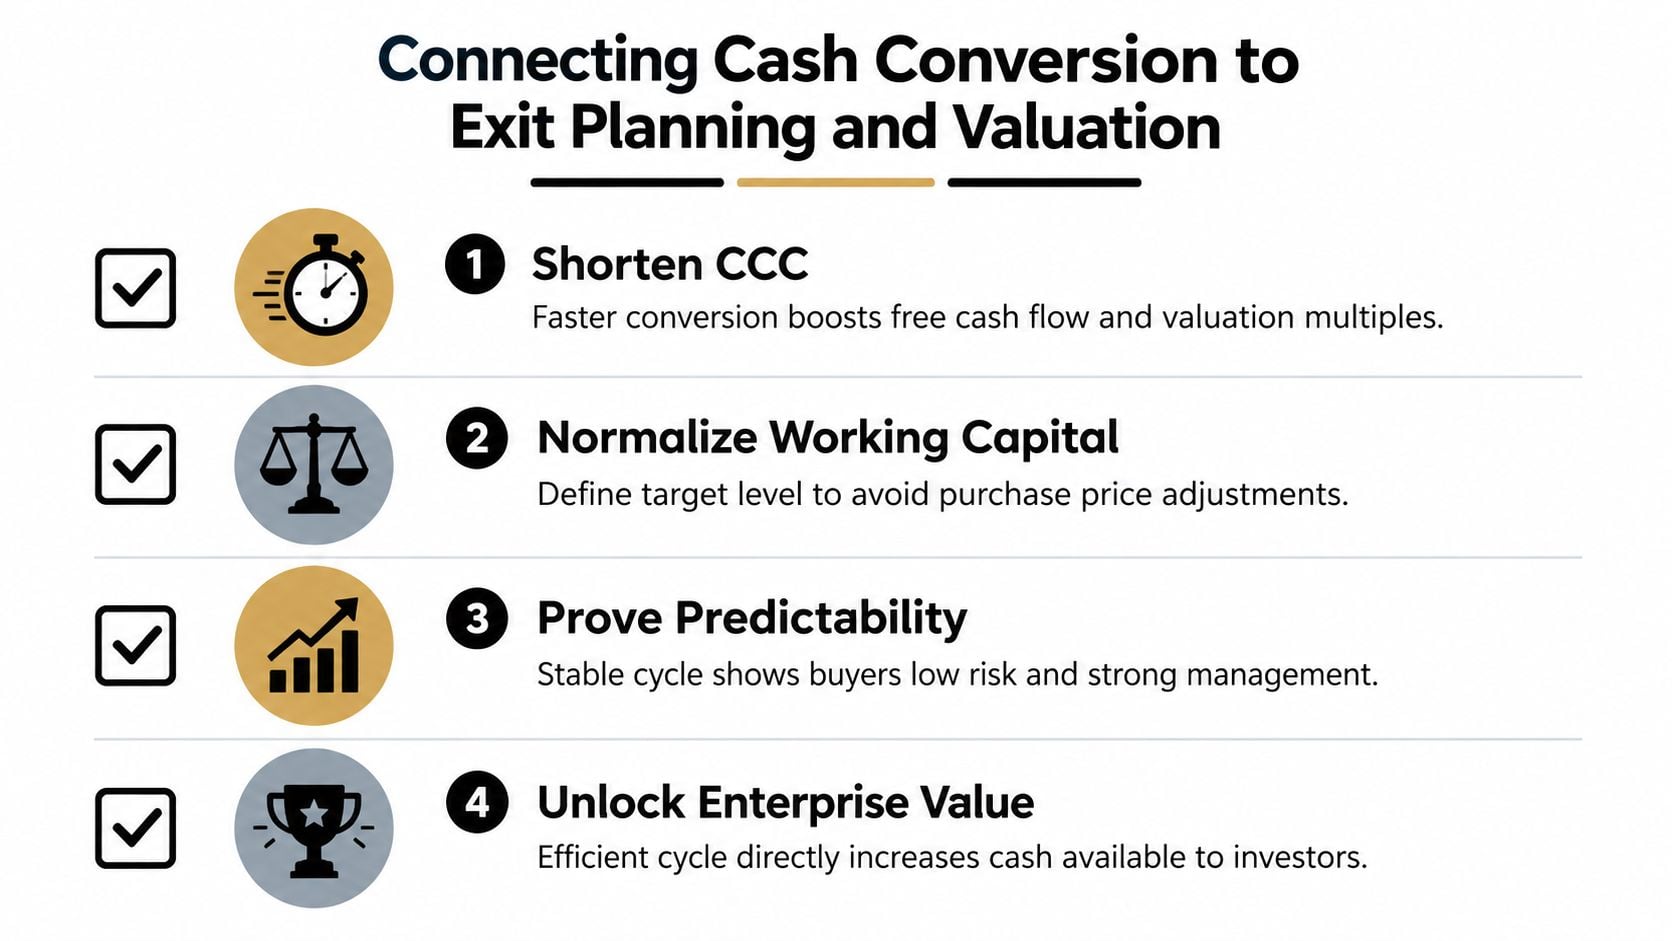
A buyer doesn't evaluate your business only by its reported earnings. During diligence, the buyer wants to understand how much cash the business needs to operate normally, whether that requirement is stable, and whether the reported working capital reflects ordinary conditions.
A bloated or volatile working capital cycle can affect negotiations in practical ways. The buyer may argue for a higher working capital peg, identify a funding need after closing, or reduce the price to account for cash that remains trapped in receivables, inventory, or work in progress. Better conversion supports more cash availability, stronger predictability, and a cleaner explanation of how the business operates.
Audit the cycle before a buyer does
Start this review well before you begin a sale process:
- Calculate DIO, DSO, and DPO separately. Don't rely on one blended CCC number. Find the operating lever creating the cash requirement.
- Review the trend. Identify whether the cycle is improving, deteriorating, or swinging with project timing and seasonality.
- Segment receivables. List overdue invoices by customer, dispute reason, owner, and expected cash date.
- Age inventory. Separate productive stock, committed project materials, slow-moving items, and obsolete items.
- Document normal working capital. A buyer needs evidence of the level required to run the business, not a temporary balance created by unusual payment timing.
- Run a weekly cash forecast. Connect collections and supplier commitments to the actual bank balance.
- Create accountability. Give sales, operations, purchasing, and finance specific actions tied to DSO, DIO, and DPO.
You don't need a universal target. You need a defensible operating baseline and a management process that produces predictable cash. Owners evaluating the broader economics of a transaction can also review the value of a private company and consider how working capital supports the story told to buyers.
Bring in fractional CFO support when the owner is still making major hiring, equipment, contract, or expansion decisions without a forward cash model. AmbitionCFO works with founder-led companies on cash flow visibility, working capital analysis, KPI dashboards, forecasting, and exit planning. Visit AmbitionCFO to discuss your current DSO, DIO, DPO, and 13-week cash flow model, then turn trapped operating cash into a measurable strategic advantage.