

You raised prices, revenue held, and the bank balance still looks worse. That's the uncomfortable position many founder-led businesses face after a strong sales month. The problem usually isn't one bad expense line. It's the interaction between labor, materials, utilization, overhead, financing, customer demands, and the way your team measures profitability.
The right question is not, “What does this cost?” It's which factors affecting cost are changing, who owns them, and what decision should follow. For a business between $10M and $100M, the answer should determine what you measure, what you reprice, what you renegotiate, and what work you walk away from.
Table of Contents
- Why Two Founders Can Sell the Same Thing at the Same Price and Make Very Different Money
- Direct Costs, Indirect Costs, Fixed Costs, and Variable Costs in Plain English
- The Cost Drivers That Move the Needle for Founder-Led Businesses
- How the Same Cost Driver Behaves Differently Across Construction, Distribution, and Services
- Measuring Cost Drivers by Job and by Client
- Why Higher Costs Do Not Always Lead to Higher Prices
- Mitigation Habits That Actually Protect Margin Quarter After Quarter
- Your First 30 Days of Cost Driver Control and Founder FAQs
Why Two Founders Can Sell the Same Thing at the Same Price and Make Very Different Money
A founder of a 40-person HVAC firm raised prices 8% in January. Ninety days later, revenue looked healthy, but net margin had shrunk. Wages climbed 12%, fleet fuel became more expensive, and a large client began demanding overnight calls without paying a premium.
The company sold more or less the same service at a higher list price. It still made less money per job.
That outcome is common because founders often treat price as the main margin lever while ignoring the speed and behavior of the underlying costs. Labor can rise faster than a scheduled price increase. A customer can change the service mix without changing the contract value. A job that looks profitable on an invoice can become unattractive after overtime, emergency dispatches, rework, and management time.
Practical rule: A price increase protects margin only when it reflects the current cost to serve.
Start with a 90-day diagnostic:
- Compare old and current unit economics. Review labor hours, materials, travel, subcontractors, overtime, and service frequency by job or customer.
- Separate volume from mix. Revenue can rise because you sold more low-margin work, not because the business improved.
- Identify uncompensated demands. Overnight calls, custom reporting, expedited freight, and repeated revisions are costs even when the customer calls them “service.”
- Assign an owner to each major variance. A variance without an owner becomes background noise.
Job and client analysis gives you the detail required to see the difference between revenue growth and profitable growth. The segment margin formula is a useful starting point for comparing contribution across customers, services, territories, or product lines.
The rest of your cost review should follow this logic. Don't ask whether costs are “high” in isolation. Ask whether the cost belongs to a job, customer, capability, or strategic decision, and whether your pricing model captures it.
Direct Costs, Indirect Costs, Fixed Costs, and Variable Costs in Plain English
Finance terminology becomes easier when you use one business everyone understands: a burger restaurant.
Direct costs attach clearly to a specific burger. The beef patty, flour used for the bun, packaging, and hourly line-cook time all increase when the restaurant prepares and sells another meal. If you're calculating the cost of one order, these inputs belong directly to that order.
Indirect costs keep the kitchen operating but don't land neatly on one plate. Rent, grease-trap service, utilities, kitchen supervision, cleaning, and the manager's salary support every meal. You still need to recover them through pricing, but allocating them to each burger requires a reasonable method.
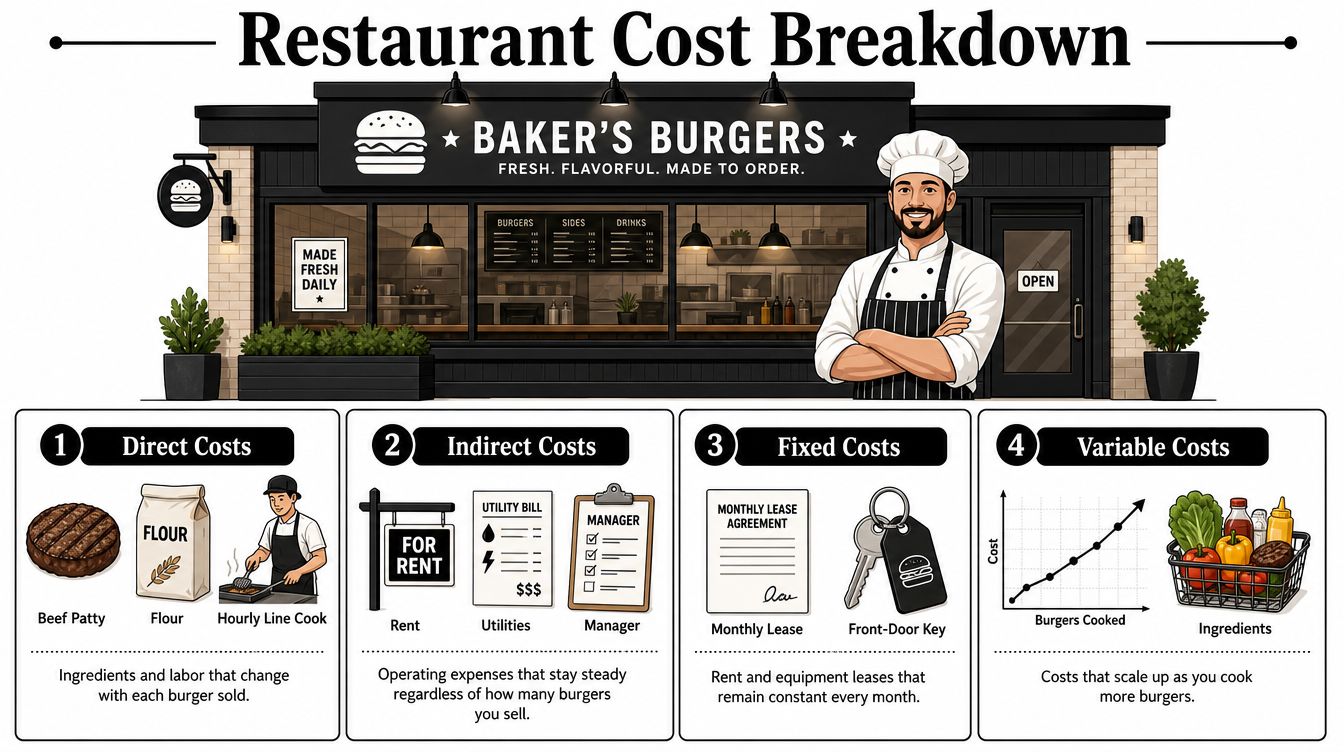
Fixed costs remain broadly stable across changes in sales volume. The restaurant lease and equipment lease don't change because the dining room serves fewer customers on a quiet evening. These costs create operating leverage, because additional sales can spread them across more orders, while weak volume leaves fewer orders to carry them.
Variable costs move with output. Ingredients, disposable containers, card-processing fees, and some delivery costs rise as the restaurant sells more burgers. Variable cost is not automatically bad. A sale that covers its direct variable cost and contributes something toward overhead may be useful, provided it doesn't consume scarce capacity needed for better work.
The same four buckets in your business
Map the analogy onto your own P&L:
- Direct costs: Technician time on a service call, materials installed on a construction project, inventory purchased for a customer order, or consultant hours delivered to a client.
- Indirect costs: Dispatch, estimating, quality control, warehouse supervision, software administration, and finance support.
- Fixed costs: Facility rent, salaried management, equipment leases, and certain insurance premiums.
- Variable costs: Freight, fuel, hourly labor, commissions, packaging, subcontractor charges, and transaction fees.
Overhead can also be fixed or variable. A foreman's salary may stay stable as production changes, while trucking costs rise and fall with output. Both remain indirect costs that must be allocated into product or job cost, as explained in Cost Accounting for Dummies.
Use the classification to decide what to manage. Direct variable costs belong in quoting and job reviews. Fixed overhead belongs in capacity planning. Indirect costs need an allocation method that helps managers make decisions rather than merely producing an attractive report.
The Cost Drivers That Move the Needle for Founder-Led Businesses
A cost driver is an activity or condition that causes a cost to change. The important point is that the biggest driver changes by sector and phase. Labor may dominate an installation business, inventory economics may dominate distribution, and utilization may determine profit in professional services.
Labor and people costs
Labor includes wages, payroll taxes, benefits, overtime, recruiting, training, and the cost of unfilled positions. In construction, persistent labor shortages can raise total project cost even when freight pressure eases. Labor costs have also made up a higher share of total construction costs than at any point in the last four years, according to Mortenson's Q4 2025 Construction Cost Index.
In services, utilization is the sharper question. A person who spends time on business development, administration, holidays, internal meetings, or quality control isn't producing billable revenue during that time, while much of the salary and overhead remains. Measure delivered hours against available capacity by role and service line before adding headcount.
Materials, inventory, and supply chain
Steel, copper, and aluminum have remained high because supply is constrained and demand remains strong. Copper prices rose nearly 20% in late 2025 amid global supply interruptions, while transportation stabilized enough that metals and long-lead electrical equipment became more significant pressure points than trucking and warehousing. Those conditions make procurement timing and allowance design commercial decisions, not back-office details.
Distribution owners need a complete inventory carrying-cost view. Capital cost, warehousing, insurance, shrink, taxes, obsolescence, and handling all contribute to the cost of holding stock, as outlined in this utilization and inventory economics analysis.
Overhead, technology, and capital
Rent, software, facilities, vehicles, maintenance, and management create the cost base your revenue must support. Review each tool by workflow and owner. Software that duplicates reporting, scheduling, or quoting functions may be more expensive than its subscription suggests because it also consumes implementation and administrative time.
Financing creates another layer. Higher interest rates, labor shortages, supply-chain disruption, and materials inflation were identified as key construction cost drivers in CBRE's 2022 US Construction Cost Trends report. The same logic applies to equipment purchases, facilities, expansion, and inventory funding. Debt service can increase while inflation narrows the margin available to service that debt.
| Cost Driver | Construction Example | Distribution Example | Professional Services Example | Margin Lever |
|---|---|---|---|---|
| Labor | Skilled-trade availability, overtime, productivity | Warehouse labor, picking efficiency | Billable utilization and staffing mix | Reprice, schedule, or redesign delivery |
| Materials and inputs | Metals, electrical equipment, subcontractors | Product cost, freight, obsolescence | External specialists and delivery tools | Negotiate, substitute, or add allowances |
| Overhead | Site management, facilities, insurance | Warehouse and fleet capacity | Rent, software, administration | Remove duplication and improve capacity use |
| Financing | Equipment and project borrowing | Inventory funding and fleet finance | Expansion and technology investment | Re-underwrite the investment |
| Customer-specific work | Scope changes, rework, delays | Minimum orders and special handling | Custom reporting, revisions, support | Contract boundaries and service tiers |
Review the table with your leadership team and mark each line as a pricing lever, operating lever, or walk-away signal. Some actions improve gross margin. Others only increase revenue while leaving the underlying economics untouched.
How the Same Cost Driver Behaves Differently Across Construction, Distribution, and Services
The same input can produce three different commercial outcomes.
A construction company on a fixed-price contract absorbs most cost movement unless the agreement includes escalation language or a change mechanism. A distributor may pass freight through on a quote but still lose money when minimum order quantities, fuel surcharges, or low-volume deliveries alter the economics of a SKU. A professional services firm billing time and materials has a clearer path to pass labor cost through, but only if the client accepts the rate and the scope remains controlled.
Construction cost benchmarking requires more than a headline price. Scope, unit basis, location, cost basis, market capacity, and risk allowances all change the benchmark, and shell-only work cannot be compared with turnkey delivery. A historical benchmark should be indexed to current market and location factors, then adjusted for site conditions, procurement, labor, and risk, as detailed in this construction cost benchmarking guide.
| Cost Driver | Construction (Fixed-Price) | Distribution (SKU) | Professional Services (T&M) |
|---|---|---|---|
| Labor | Absorbed unless contract terms permit adjustment | Raises handling and fulfillment cost | May pass through through updated hourly rates |
| Materials | Creates allowance, escalation, or change-order exposure | Changes landed cost and reorder economics | Usually limited to purchased inputs |
| Freight | Affects delivery and mobilization | Directly changes SKU margin | Often included in overhead or reimbursed |
| Customer changes | Rework, delay, disruption, and lost productivity | Special packaging, rush orders, and minimums | Extra meetings, revisions, and support |
| Capacity | Crew availability determines schedule and cost | Warehouse space and stock availability matter | Utilization determines revenue capacity |
Think of each driver as putting your company into one of three modes:
- Absorption: Your contract or price structure leaves you carrying the increase.
- Pass-through: Your terms let you charge the customer, assuming demand supports it.
- Exposure: The cost may appear in a quote or P&L, but timing, volume, or operating friction still leaves you vulnerable.
For distribution owners, this inventory carrying cost formula helps quantify the financing and operating burden behind apparently profitable stock. Don't judge a product only by purchase price and selling price. Include the cash tied up while it waits to move.
Change orders deserve special treatment in construction. They commonly include direct costs, overhead and profit, and consequential costs caused by delay, disruption, or productivity loss, according to the Change Order Protocol. The closer a project gets to completion, the more expensive changes can become, particularly when they create overmanning, project-manager time, processing delays, or untracked productivity loss, as documented in ASCE research on change-order impact0733-9364(2004)130:6(762)).
Measuring Cost Drivers by Job and by Client
Run this exercise in your first week. Don't wait for a new enterprise system. Most founder-led companies can start with QuickBooks, Sage, JobCost, and a disciplined spreadsheet. Cost plus discipline beats software plus procrastination.
Start with job-level margin
Pull completed and active jobs, projects, orders, or engagements. For each one, tag:
- Direct labor: Hours by employee, crew, role, or subcontractor.
- Materials: Purchased, installed, consumed, or shipped inputs.
- Subcontracts: External production, specialty trades, and outsourced delivery.
- Allocated overhead: A consistent share of supervision, facilities, equipment, and support.
Then calculate contribution margin by job. Contribution margin is revenue less the costs that change because you accepted and delivered the work. Use it to compare jobs, but don't confuse it with final net profit. A project can show positive contribution while consuming so much management time or capacity that it weakens the business overall.
For construction and project businesses, compare your estimates with actual labor, material, and schedule performance. Bidwell project cost guides can provide useful context when you're tightening the estimating and preparation process.
Then measure the client
Client profitability requires a broader cost-to-serve view. Subtract not only delivery cost, but also support tickets, rework, scope creep, custom reporting, payment terms, expedited shipping, and senior leadership time.
A large customer can be strategically important and still be commercially weak. If one client produces 40% of revenue but consumes 60% of service hours, that gap demands a decision. The answer could be a rate adjustment, narrower service boundaries, a dedicated delivery model, or an orderly exit.
Use a weekly exception report rather than a giant monthly workbook. Flag jobs with falling margin, clients with rising service hours, orders with unusual freight, and projects where actual effort has moved beyond the estimate. The principles in what job costing means support this operating rhythm, but the tool matters less than consistent coding and review.
A practical client scorecard should show:
- Revenue and gross margin
- Labor hours and seniority mix
- Rework or return activity
- Support volume
- Average collection time
- Contract exceptions and unpaid extras
Give every red flag an owner and a decision date. A report that doesn't change quoting, staffing, purchasing, or contract terms is only accounting.
Why Higher Costs Do Not Always Lead to Higher Prices
Higher costs create pressure. They don't automatically create pricing power.
A customer decides whether your price is acceptable based on alternatives, urgency, perceived value, switching friction, and budget. Your cost explains why you need a price, but it doesn't prove the customer will pay it. Research from the New York Fed examines firm pricing through demand strength, compensation costs, profit margins, and non-labor costs, reinforcing the point that input cost is only one part of the pricing decision in Staff Report 1062.
Three founder truths matter:
- A cost increase is not a pricing formula. If a service line becomes more expensive to deliver, test the market before applying a blanket increase.
- Value-based pricing beats cost-plus when differentiation exists. Customers may pay more for speed, risk reduction, technical expertise, or guaranteed availability. They may reject a higher price for work they view as interchangeable.
- Some work should be redesigned or dropped. A weak segment can consume your best people and create hidden rework without producing acceptable contribution.
Consider a professional services firm whose clients can't absorb a major increase in junior consultant rates. Doubling those rates may protect the firm's theoretical margin while pricing the client out. A better move could be changing the staffing mix, standardizing deliverables, limiting revisions, or reserving senior people for decisions that require their expertise.
A distributor faces a different trade-off. Absorbing a freight increase on a high-volume account may preserve a relationship that supports warehouse utilization and repeat orders. That doesn't make absorption automatically correct. It means the owner should calculate the full account economics, then decide whether to pass through, renegotiate terms, change order minimums, or exit low-value deliveries.
Accounts-receivable friction belongs in the same conversation. The analysis of AR inefficiency in professional services is a useful reminder that delayed collection and billing friction can reduce the economic value of a client even when the quoted gross margin looks attractive.
Mitigation Habits That Actually Protect Margin Quarter After Quarter
Cost mitigation fails when it becomes an annual budget exercise. Founders need a recurring operating system that catches movement before it becomes a quarterly surprise.
Run a 15-minute weekly cost-driver review. Look for unusual labor hours, material changes, freight charges, overtime, rework, returns, utilization shifts, and new vendor fees. The meeting should end with named owners and specific decisions, not a general instruction to “watch costs.”
Build a rolling 90-day procurement calendar. List long-lead materials, major renewals, expected demand, vendor commitments, contract expirations, and equipment requirements. Procurement becomes cheaper when your team has time to compare suppliers and negotiate rather than buying under deadline pressure.
Put the review on the calendar
Use a monthly scorecard with three views:
- Cost as a percentage of revenue by category: Shows whether labor, materials, overhead, or financing is consuming a larger share of sales.
- Gross margin by client or job: Shows where revenue fails to translate into contribution.
- Rework, return, or failure rate by job: Shows the operational costs that estimates often miss.
Quarterly, renegotiate with your top five vendors. Ask for revised terms, volume pricing, delivery commitments, substitutions, lead-time guarantees, or consolidated purchasing. Re-quote at least one major input every quarter, even when the current supplier relationship is strong.
Maintenance deserves a place in the margin review. Emergency repairs create downtime, rush procurement, and schedule disruption. Owners evaluating ways to cut maintenance spend with predictive maintenance should connect maintenance data to missed production, overtime, and customer commitments rather than tracking repairs as an isolated expense.
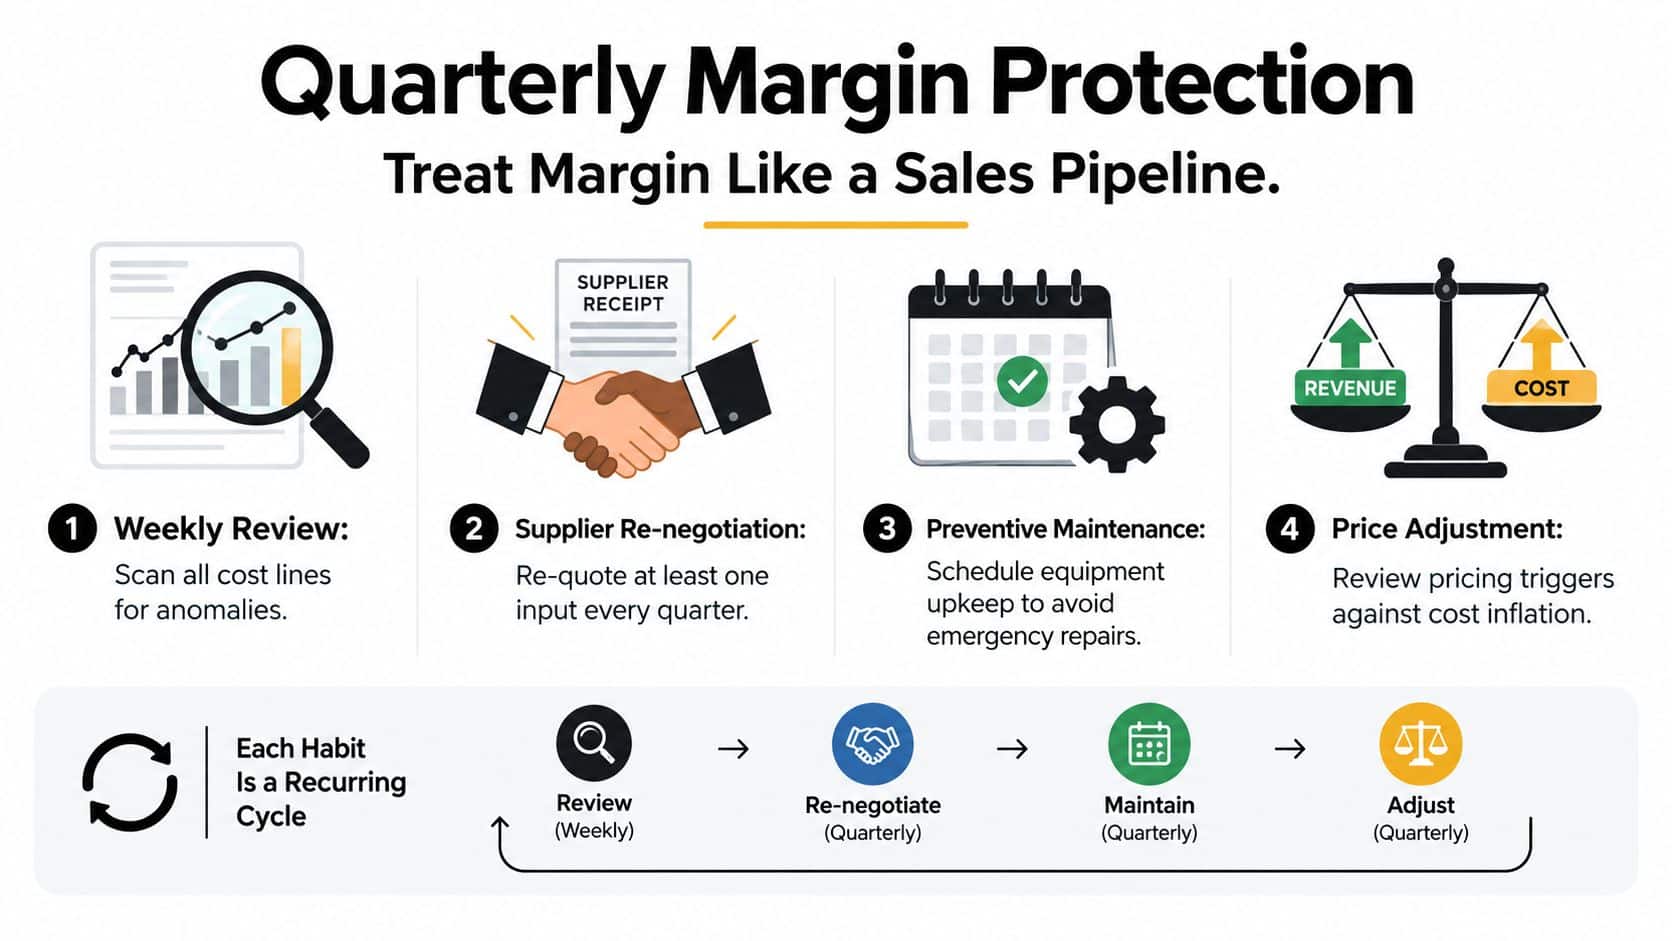
Use the principles in cost-cutting strategies to distinguish genuine cost reduction from shifting expenses into another period or department. Cutting an input that causes rework isn't savings. Delaying maintenance isn't savings. Removing a low-value process that nobody needs is savings.
Habits beat initiatives because they produce decisions repeatedly. Treat margin like a sales pipeline, review it weekly, and make cost ownership part of each manager's job.
Your First 30 Days of Cost Driver Control and Founder FAQs
Take one action this week. Pull the last 90 days of your P&L and tag every line as fixed, variable, direct, or indirect. Don't aim for perfect accounting. Aim for a usable map of where money leaves the business.
Then follow this sequence:
- Week one: Classify the P&L and identify missing job or client tags.
- Week two: Rank the top ten cost lines by absolute impact and volatility.
- Week three: Assign an owner and review cadence to each line.
- Week four: Build the first dashboard and hold the first monthly review.
A 13-week cash flow model will help connect cost decisions with collections, vendor payments, payroll, debt service, and upcoming commitments.
Founder FAQs
When should I raise prices? Raise prices when the customer value, contract terms, or market position supports the change. If demand is weak, redesign the offer or segment pricing instead of applying a blanket increase.
How often should I renegotiate vendors? Review major vendors quarterly and re-quote critical inputs when supply, lead time, or volume changes.
When should I drop an unprofitable client? First verify the true cost to serve, then attempt a defined correction. Walk away when the client rejects commercially reasonable terms and continues consuming constrained capacity.
Should I hire a controller or a fractional CFO first? Hire a controller for transaction accuracy, close discipline, and accounting operations. Use a fractional CFO when you need interpretation, forecasting, margin decisions, capital planning, or owner-level strategy. AmbitionCFO provides fractional CFO advisory services including cash flow modeling, job and client margin analysis, forecasting, and KPI dashboards for founder-led businesses.
If you want a clear view of which factors affecting cost are eroding your margin, visit AmbitionCFO to discuss a practical review of your jobs, clients, cash flow, and operating drivers. Bring your last 90 days of financial data, and turn the review into specific pricing, renegotiation, staffing, and walk-away decisions.