

Which customers deserve more of your cash, capacity, and attention? The popular answer, focus on your biggest customers and ignore the rest, is too crude to guide a capital decision. Your largest account might also be your most expensive account to serve.
Use the 80/20 rule in business to test where you earn profit after delivery costs, when that profit becomes cash, and how much dependence on those relationships you can afford. That gives you something useful to change this quarter, not just a slogan to repeat.
Table of Contents
- What the 80/20 Rule Means in Business
- How to Find Your Vital 20% in Five Steps
- What Real Profit Concentration Data Shows
- Apply the 80/20 Rule to Cash Before Profit
- Set Resource Priorities With ABC Tiers
- Where the 80/20 Rule Misleads Business Owners
- Confirm Your Vital 20% Before You Reallocate Capital
What the 80/20 Rule Means in Business
The 80/20 rule says that a small share of inputs, often about 20%, drives most results, often about 80%, but the split is a hypothesis to test rather than a law.
Think of a restaurant where a handful of regulars might fill tables reliably and order profitable meals, while an oversized menu creates purchasing and preparation work. The useful question isn't which diners spend the most. It's which relationships and menu choices leave the owner with money after serving them.
The principle has economic roots. Vilfredo Pareto published his income-distribution research in Cours d'économie politique in 1896–1897, using tax and property data to examine how income and wealth concentrated among a relatively small population share, as described in Pareto's historical background. He wasn't prescribing a customer-management strategy.
Joseph M. Juran later translated that concentration idea into quality improvement, identifying the “vital few” causes that deserved management attention and helping establish the Pareto chart as a ranking tool, according to Juran's professional history. The managerial lesson is to rank consequences before distributing effort.
Define the profit you're trying to protect
Before exporting anything, agree on the economics:
- Contribution profit means revenue minus the direct costs of delivering it. It's the amount available to cover shared overhead and generate operating profit.
- Cost-to-serve means the additional crew time, support effort, account administration, and payment risk a relationship consumes beyond its directly recorded delivery costs.
- Cash contribution adds timing to the decision. An attractive accounting margin doesn't tell you when the money reaches your bank account.
Owners usually test customers, jobs or products, and costs. Keep revenue concentration separate from profit concentration, because a high-volume client can require expensive exceptions that a sales report doesn't reveal.
For a full contribution analysis, include account-specific support without counting the same expense twice. Use documented hours, delivery records, and collection activity rather than spreading every cost equally.
The question to take into your finance meeting is simple: Which customers create the profit after delivery costs? With usable records, you can build an initial answer within a week.
How to Find Your Vital 20% in Five Steps
Turn your invoice and job-cost history into a ranked account list. Start with a consistent reporting period, and don't let perfect cost allocation delay a useful first pass.
The workflow below keeps the analysis focused on profit rather than sales volume.
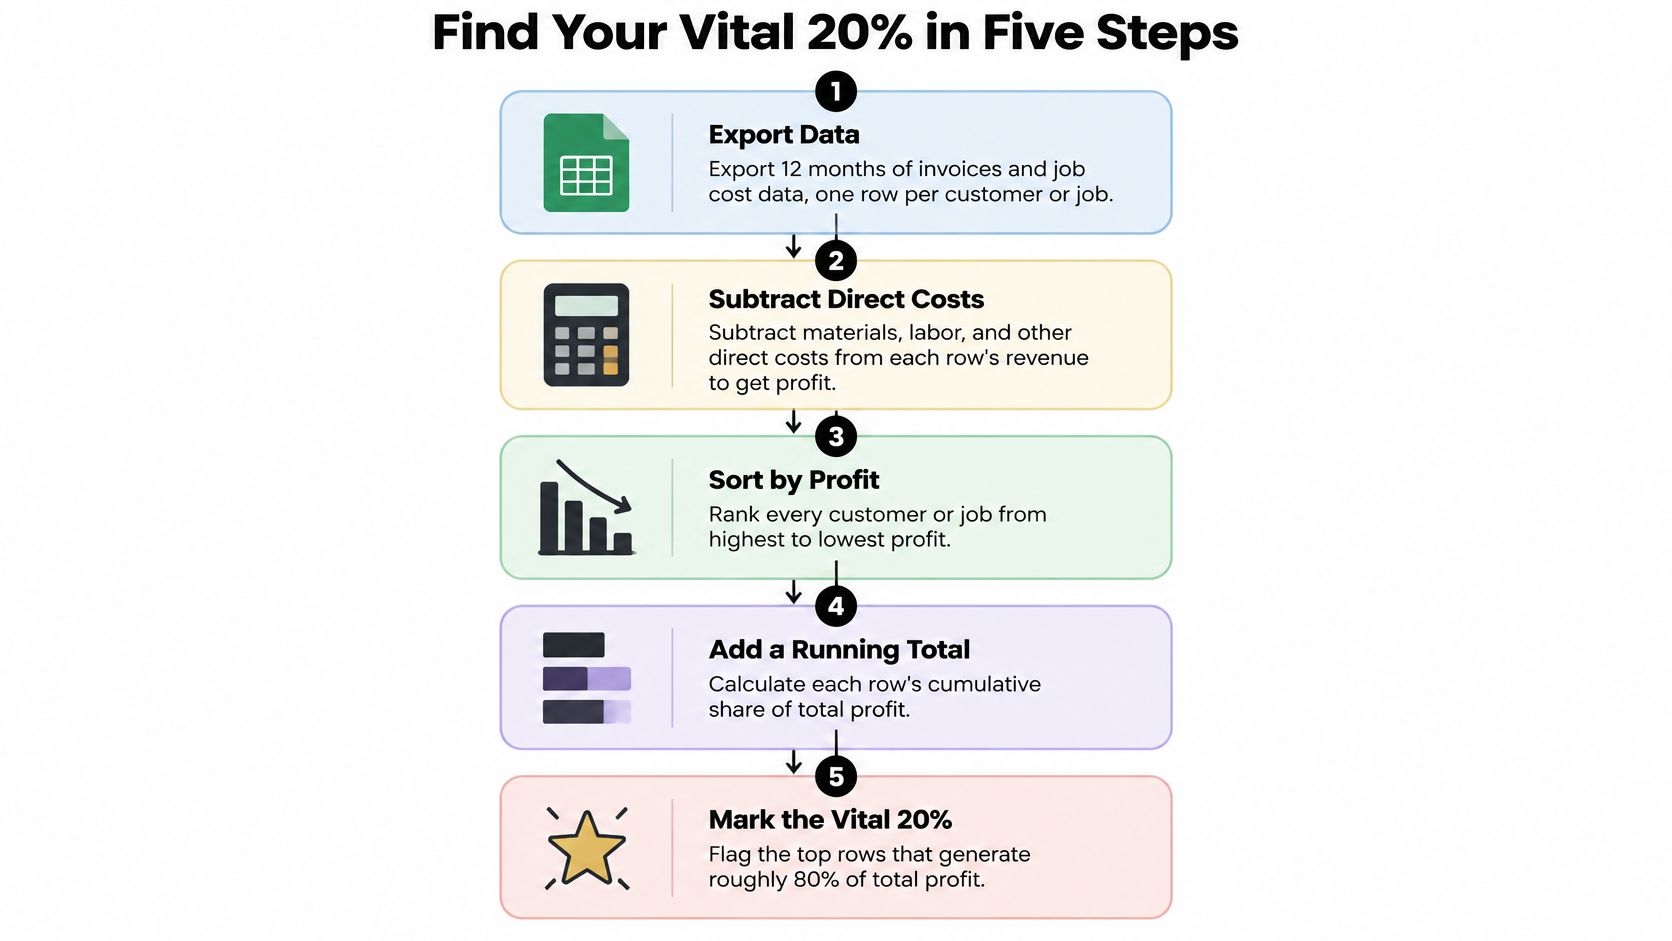
Build the ranking
Export the underlying records. Pull invoices, credits, job costs, and payment activity for the last twelve months, then aggregate them into a customer or job summary. Keep the transaction detail available so your team can investigate unusual results.
Subtract delivery costs and attributable support. Include materials, labor at a loaded rate, subcontractors, freight, commissions, warranty work, delivery expense, and evidence-based customer support. Record discounts consistently, either in net revenue or as a deduction, never both.
Sort by contribution profit. Put the highest-profit accounts first and retain negative results at the bottom. Ranking by revenue alone can conceal the accounts that consume scarce crews, inventory, or senior staff without an adequate return.
Add cumulative shares. Divide running contribution profit by total contribution profit, and running customer count by total customers. Plot those shares to see where profit accumulates, recognizing that loss-making accounts can pull the final total downward.
Assign operating segments. Separate the profitable core, break-even middle, and loss-making tail based on the economics you find. Give each segment a management action rather than forcing the accounts into predetermined quotas.
That workflow follows the contribution-analysis logic described in the customer and profitability analysis research. For a practical companion, use this customer profitability analysis guide.
Give each segment a different operating rule
The ranges below are diagnostic reference points, not enrollment targets. The customer-profitability analysis summarized by Leonard Brown describes approximately 20%–25% profitable customers, 50%–60% roughly break-even customers, and 20%–25% unprofitable customers.
Three customer segments and the action for each
| Segment | Typical share of customers | Role in profit | Action |
|---|---|---|---|
| Profitable core | 20%–25%, as cited above | Produces most contribution profit | Protect crew capacity, assign senior attention, set pricing floors |
| Break-even middle | 50%–60%, as cited above | Covers overhead with little left over, depending on allocation | Reprice, standardize scope, add minimum fees |
| Loss-making tail | 20%–25%, as cited above | Subtracts from total profit | Fix cost-to-serve, add surcharges or payment terms, or exit |
For a contractor, the practical result might be a small group of repeat accounts with predictable scheduling and clean change orders, alongside a busy account that repeatedly requires overtime and collection work. That's an illustrative operating pattern, not evidence that your company will have the same distribution.
Create a reusable worksheet with these columns: customer or job, net revenue, materials, loaded labor, subcontractors, freight, warranty, other attributable costs, support allocation, contribution profit, cumulative profit share, cumulative customer share, and assigned segment. Add an action owner and review date.
Before making account decisions, reconcile the worksheet to your financial statements and identify costs you've left unallocated. If total contribution is negative or close to zero, cumulative percentages become misleading, so work from absolute profit and loss amounts instead.
Your output should be a list you can act on this month, with visible assumptions rather than false precision.
What Real Profit Concentration Data Shows
A bank customer-profitability study found that the top 20% of retail customers generated 82% of retail profits; profit per account balance averaged 2.53% for that group versus 0.71% for the bottom group, according to the bank customer-profitability study. The researchers ranked customers by profitability, not by account size.
That ranking is the part worth copying. A large balance, frequent order, or impressive annual sales total doesn't prove a customer deserves first claim on your capacity.
Read the evidence without borrowing its answer
Bank profit per balance, customer lifetime value, and contribution profit measure different things. None of them transfers cleanly into your budget.
| Evidence | Key figures | Decision lesson |
|---|---|---|
| Bank retail-customer study | Top 20% of customers produced 82% of retail profits; profit per balance averaged 2.53% for that group versus 0.71% for the bottom group | Measure economic return per account, not size alone |
| TechInc and FashInc research | As reported in that study, the top 20% contributed more than 90% of total profits, and high-value TechInc customers carried roughly 25 times the lifetime value of medium- or low-value customers, per MIT Sloan Management Review | Heavy losses at the bottom can inflate concentration at the top |
| Leonard Brown customer-profitability analysis | Profitable, break-even, and loss-making ranges cited earlier | Diagnose separate customer groups rather than imposing a fixed split |
Treat the TechInc figures as a finding inside one study, not a benchmark for your construction company, distribution business, or professional-services firm. Concentration that extreme carries a second warning. If a handful of accounts funds your overhead, losing one hurts more than the margin math suggests. Pair any concentration finding with a revenue cap per account before you let your business depend on it.
Understand why profit shares can exceed the whole
Here's a hypothetical I use to show the mechanics: profitable accounts generate $1.2 million in contribution, loss-making accounts burn $200,000, and reported operating profit lands at $1.0 million. The profitable group produced more than 100% of the final number.
There's no contradiction. You're comparing the positive group's earnings with a smaller total after losses.
Interpretation rule: When an account segment looks extraordinarily profitable, inspect the losses elsewhere before assuming the winning segment has exceptional economics.
In your own books, keep customer contribution separate from fully allocated operating profit. A customer can contribute positively while looking unattractive after an arbitrary overhead allocation, and cutting that customer won't make the overhead disappear.
Run the math with a consistent segment margin formula. Then ask which expenses would actually leave, which capacity you could redeploy, and whether a replacement account would beat the current one after cost-to-serve and payment timing.
The evidence supports testing for concentration. It can't hand you your company's split, and it can't prove which intervention will work.
Apply the 80/20 Rule to Cash Before Profit
Profit rankings can wait a week. Cash rankings cannot. A customer can look attractive on margin and still leave you short when payroll clears, because margin arrives on an income statement while cash arrives on a customer's payment schedule. Firms with healthy margins run into uneven cash flow all the time, so treat profit as a promise and collections as the deliverable.
That is why the 80/20 test belongs on your receivables before your P&L.

Rank customers by open balance and days outstanding
Pull your open receivables and sort every customer by current open balance, largest first. Add a running cumulative column and mark where roughly 80% of the money sits. For most firms a small group of accounts holds most of it, though your split may run closer to 70/30 or 90/10. That top group gets your attention first.
Then run the same sort on overdue balances by days outstanding. Usually a still smaller group holds most of the delay, and those accounts control your cash timing far more than any company-wide average. Days sales outstanding measures how long sales take to turn into collections, but the average hides the two or three accounts doing the actual damage.
An overdue invoice blocked by a dispute needs escalation. An approved invoice waiting on a scheduled payment run needs a confirmed date. Rank each item by balance, expected release date, and the action required.
Where cash waits and how to rank it
| Cash leak area | Question to ask | Metric to track | Typical fix |
|---|---|---|---|
| Receivables | Which customers hold most open invoices? | Days sales outstanding and aging by customer | Tighten terms and chase the largest balances first |
| Unbilled work in progress | Which jobs consume cost before billing? | Billings versus costs by job | Milestone billing and retainage review |
| Vendor payments | Which suppliers drive most cash outflow? | Spend and payment terms by vendor | Renegotiate terms with top-spend vendors |
Work in progress is work you have already spent labor and material on but have not yet billed. Keep it separate from unbilled revenue, which is completed work awaiting an invoice. The first needs cost control; the second needs paperwork.
Feed the largest balances and the longest delays into a 13-week cash forecast, the near-term horizon that shows whether collections land before payroll and supplier payments fall due. Include a downside case where an expected collection slips or a billing milestone is not approved.
Set a ceiling on customer concentration
A heavy receivables ranking cuts both ways. Chasing your biggest overdue accounts first is smart; letting any one account carry an outsized share of your cash is not. Decide the maximum share of open receivables a single customer may represent, and treat crossing that ceiling as a trigger to renegotiate terms, require deposits, or slow new work until the balance clears. The 80/20 finding should sharpen your collection effort, not deepen your dependence on a few accounts.
For a specialty contractor, a concentrated receivables balance might justify owner involvement in a disputed change order before another sales push. Winning additional work can require more labor and material spending before it generates cash, so do not assume growth solves the immediate gap.
Turn the forecast into assigned actions
Name who will resolve the dispute, submit the missing billing documentation, confirm the customer's payment date, or negotiate supplier terms. Replace hopeful collection dates with evidence from the customer.
Use working-capital optimization to connect those decisions across receivables, inventory, and payables. For owners operating in Australia, Everglow Prosperity's cash flow strategies for Australian businesses provides a geographically relevant companion resource.
Do not improve the forecast by delaying every supplier. Protect essential supply relationships and negotiate explicitly.
Set Resource Priorities With ABC Tiers
ABC analysis gives inventory, materials, and purchasing teams different control rules for different levels of financial exposure. The reference ranges below combine the representative classifications described in ABC analysis guidance and the research cited later in this section; they aren't fixed quotas or a single exact allocation.
ABC classes and typical shares of items and value
| ABC class | Typical share of items | Typical share of value | Control level |
|---|---|---|---|
| A | 10%–20% of items | 70%–80% of value | Frequent cycle counts, tight reorder points, purchase approval |
| B | About 30% of items | About 15% of value | Moderate review intervals and periodic checks |
| C | 50%–70% of items | 5%–10% of value | Simple periodic replenishment |
Use the visual to connect annual usage value with the control level each category needs.
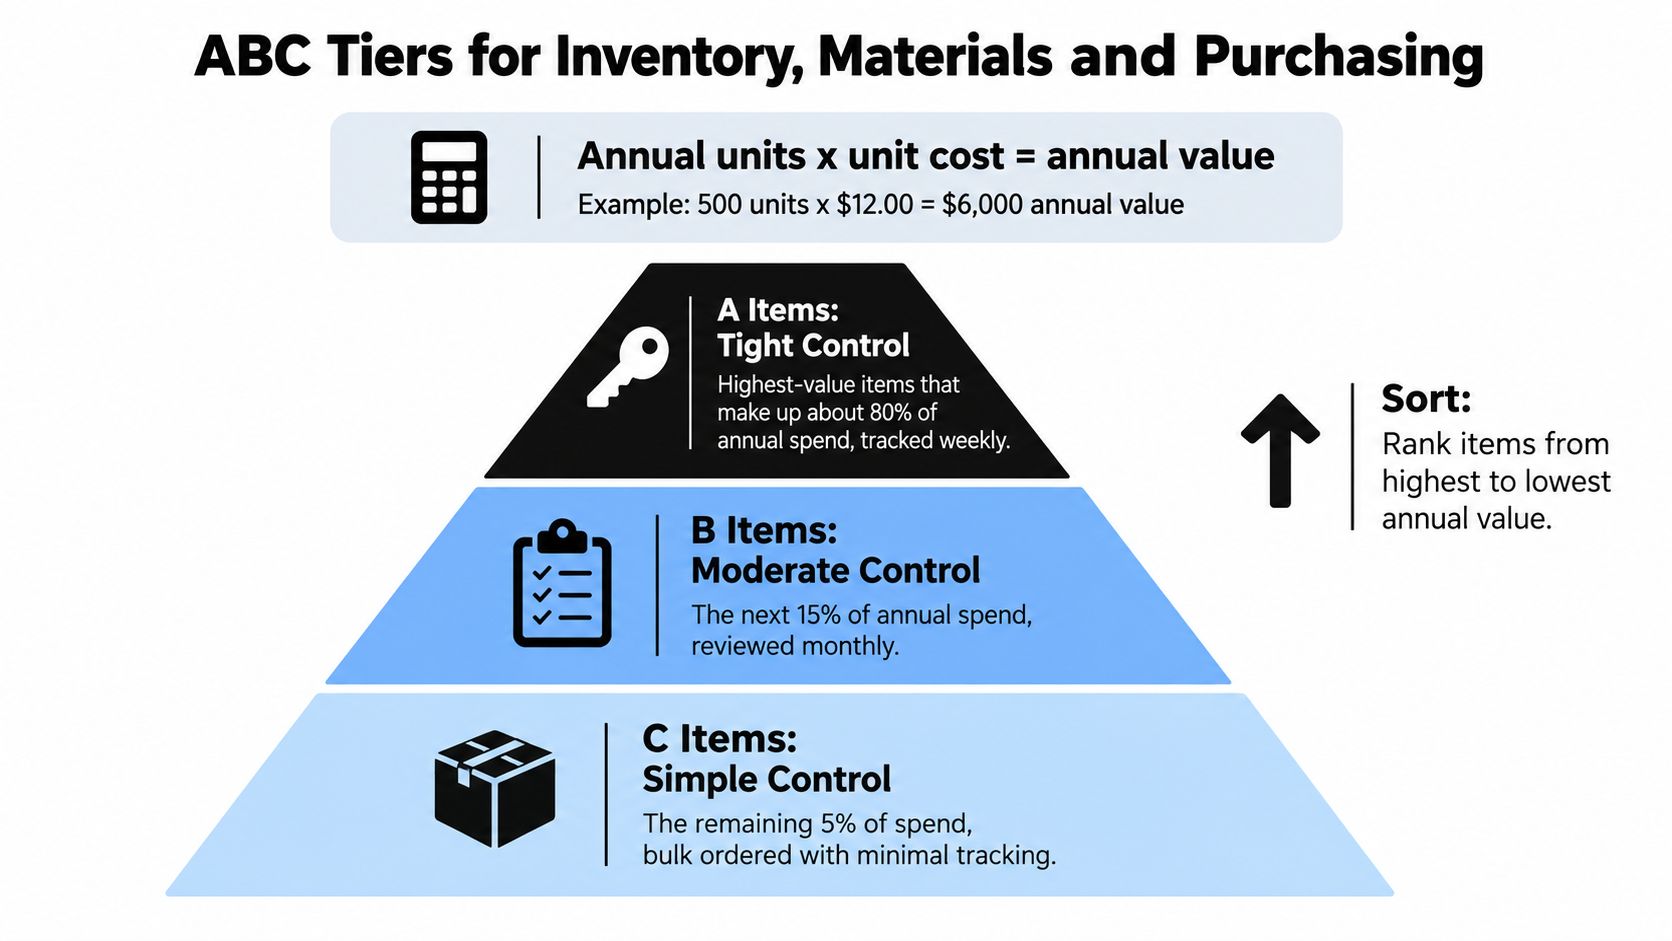
Calculate exposure before setting controls
Multiply each item's annual units consumed or sold by unit cost. Sort those annual usage values from largest to smallest, calculate the running share, and assign classes using your actual distribution.
For a distributor, the A list becomes the purchasing manager's priority review queue. Check demand assumptions, supplier reliability, reorder points, and excess purchase requests before spending time polishing controls on inexpensive, slow-moving items.
For a construction business, apply the ranking to commonly purchased materials, equipment parts, and subcontractor categories. A purchasing category with substantial annual spend deserves negotiation and review, even if each individual order looks ordinary.
The inventory-management research on ABC analysis recommends overlaying criticality and lead time, then reviewing classifications monthly using inventory turns, fill rate, aged stock, and gross margin return on inventory investment. That last measure compares gross margin with the money invested in inventory.
Keep operational importance separate from price
A low-dollar replacement part can stop equipment or delay a job. Mark it as operationally critical even if its annual usage value places it in C.
Use a separate criticality flag rather than manipulating the financial ranking. Otherwise, your team can't distinguish expensive exposure from inexpensive but essential availability.
The following video offers an additional visual companion to the inventory discussion.
Connect inventory decisions with your product mix strategy. A product that earns an attractive margin but requires difficult inventory commitments needs a different stocking policy from an easily replenished item.
Give purchasing staff clear authority boundaries, documented exceptions, and a review owner. The benefit comes from changing purchasing behavior, not merely adding category labels to a spreadsheet.
Where the 80/20 Rule Misleads Business Owners
A distribution could look like 10/90 or 2/30 rather than the familiar ratio. Treat those as possible patterns to test, not benchmarks supported by your company records.
For a broader financing context, the QuickBooks small-business financing report is relevant background, but it doesn't establish your customer-profitability curve. Only your own transaction-level analysis can do that.
Avoid the three damaging shortcuts
- Cutting the bottom automatically. A lower-ranked customer may still make a positive contribution toward shared expenses. Remove the account without removing costs or replacing its contribution, and you can leave the business worse off.
- Expanding dependence on the winners. Giving your strongest customers more attention is sensible. Building hiring, equipment, and debt commitments around an increasingly narrow account base is a different decision.
- Treating the ranking as permanent. Pricing, service demands, project mix, and payment behavior change. An account's previous position doesn't entitle it to today's best terms.
Set a customer concentration limit before approving further expansion. Choose a maximum exposure that fits your obligations and cash reserves, measuring dependence through gross profit and outstanding receivables as well as sales.
Keep alternative accounts active. Then model losing your largest relationship: identify the cash shortfall, unused capacity, committed purchases, and expenses you could realistically remove.
Focus on your best relationships without making the company's survival depend on their renewal.
Check the economics before an exit
Before cutting a segment, answer these questions in writing:
- Cause of the loss: Is the problem price, uncontrolled scope, delivery inefficiency, or account-specific support?
- Strategic value: Does the relationship provide a credible route to better work, or are you using that argument to excuse persistent losses?
- Remaining overhead: Which expenses disappear when the account leaves, and which stay?
Use a disciplined overhead reduction review alongside the account decision. Don't assign a slice of rent to a customer and then assume that slice becomes savings when you stop serving it.
The rule can't prove causation, predict customer response to repricing, or identify future demand. It tells you where to investigate first.
That's its proper role: a prioritization question, not an automatic answer.
Confirm Your Vital 20% Before You Reallocate Capital
This week, choose customers or jobs and build the ranking using the worksheet columns above. Name the strongest account in the profitable core and the largest account in the loss-making tail, then select a specific intervention for the latter.
Write down its current contribution profit, collection performance, and the cost you intend to change. Your number to beat should come from the ledger, not from an outside benchmark.
Put the decision on a review calendar
Set a 90-day review as your management checkpoint. Use the same segment definitions and cost treatment before and after the change so you can distinguish genuine improvement from a revised allocation.
- Track the account: Compare contribution profit and days sales outstanding against the baseline.
- Verify the cash: Confirm that the largest receivables have been collected or have documented payment plans.
- Approve capital deliberately: Test hiring, equipment, or contract commitments against the downside cash forecast.
AmbitionCFO uses 13-week cash flow modeling and margin analysis to build this decision view for founder-led businesses with $10M to $100M in annual revenue. Led by John Myklusch, CPA, CEPA, the firm is based in Orlando and serves clients nationally.
Leave the meeting with a named segment, a measured baseline, an accountable owner, and a date on the calendar. That's enough to start improving the economics this quarter.
AmbitionCFO offers fractional CFO guidance to identify which customers and jobs generate worthwhile profit and when that profit becomes cash. Visit AmbitionCFO to request a margin review of your top 20% and your cash timing, then use the findings to set your next pricing, capacity, and capital decisions.