

Revenue is up, the bank balance is tight, and a customer favorite has just slipped out of stock. The sales report says to push the winners and cut the slow movers, but it doesn't show which offers are tying up cash, skilled labor, warehouse space, or leadership attention.
For a founder-led business, product mix strategies work only when they connect customer demand to the capacity and cash available to serve it. The practical question isn't only what sells. It's which products, jobs, service lines, or customer segments make the best use of constrained resources, and whether a proposed change still works when the cash forecast gets uncomfortable.
Table of Contents
- The Moment a Product Mix Stops Working
- Mapping Your Current Mix With Four Measurable Dimensions
- The Constrained Contribution Margin Model
- A Decision Matrix for SKU Rationalization
- Mix, Pricing, and 13-Week Cash Stress Testing
- Running a Monthly Product Mix Review
- Your Next 90 Days and the Action Worth Taking This Week
The Moment a Product Mix Stops Working
A distributor can add popular lines and still find that more cash is sitting in inventory while freight costs and fulfillment demands crowd out better opportunities. A contractor can grow its backlog, yet struggle to staff the mix of jobs it has promised. In both cases, the top line looks healthy, but the business has taken on work that consumes capacity faster than it produces usable cash.
The instinct is often to cut the slowest seller. That can help, but sales volume alone won't reveal whether an offering supports a key account, fills otherwise idle capacity, or bundles with a more profitable product. Nor does a P&L necessarily show how much labor, expediting, payment delay, or service time that offering absorbs. The binding constraint is the resource that limits what the business can deliver or sell. It might be skilled labor, warehouse capacity, supplier availability, or sales attention.
A product-mix decision is therefore a resource-allocation decision. Before changing the list, bring operations, sales, and finance together to compare customer demand with fully loaded costs and cash timing. A useful pricing and cost analysis framework can help teams spot where discounts and delivery costs are eroding the economics behind a sale.
The 13-week cash forecast matters because a promising margin improvement can still create a short-term cash squeeze. For example, reducing a stocked item may release working capital, but if a major customer switches to a special-order substitute, longer lead times or larger purchase commitments could delay the benefit.
Start with the constraint, not the slowest seller. A low-volume offer may be worth keeping if it protects a profitable relationship or uses capacity that would otherwise sit idle.
| Question | What it forces you to measure | What a good answer looks like |
|---|---|---|
| What resource is limiting profitable growth? | Labor, machine time, inventory, cash, or channel capacity | A named constraint, supported by operating data |
| What does each offer contribute after its true variable costs? | Price, discounts, delivery, service, and other variable costs | A contribution calculation tied to actual delivery effort |
| What happens to cash if we change the mix? | Inventory, billing, payment timing, and transition costs | A change that still holds up in the 13-week forecast |
These questions turn product-mix strategy into a working management tool. The aim isn't to keep every offer or to prune indiscriminately. It's to direct scarce capacity and cash toward the mix that serves customers and strengthens the business.
Mapping Your Current Mix With Four Measurable Dimensions
Before changing what you sell, make sure you can describe the current mix. A portfolio can look straightforward in a sales report while hiding extra service packages, project types, contract structures, or customer segments that create different operating demands.
Four dimensions provide a useful map: width, the number of distinct product lines; length, the total number of products across those lines; depth, the variants within a line; and consistency, how closely the lines share end uses, production methods, or distribution channels. A contractor can apply the same framework to job types and contract options. A professional-services firm can map service lines, engagement formats, and client segments.
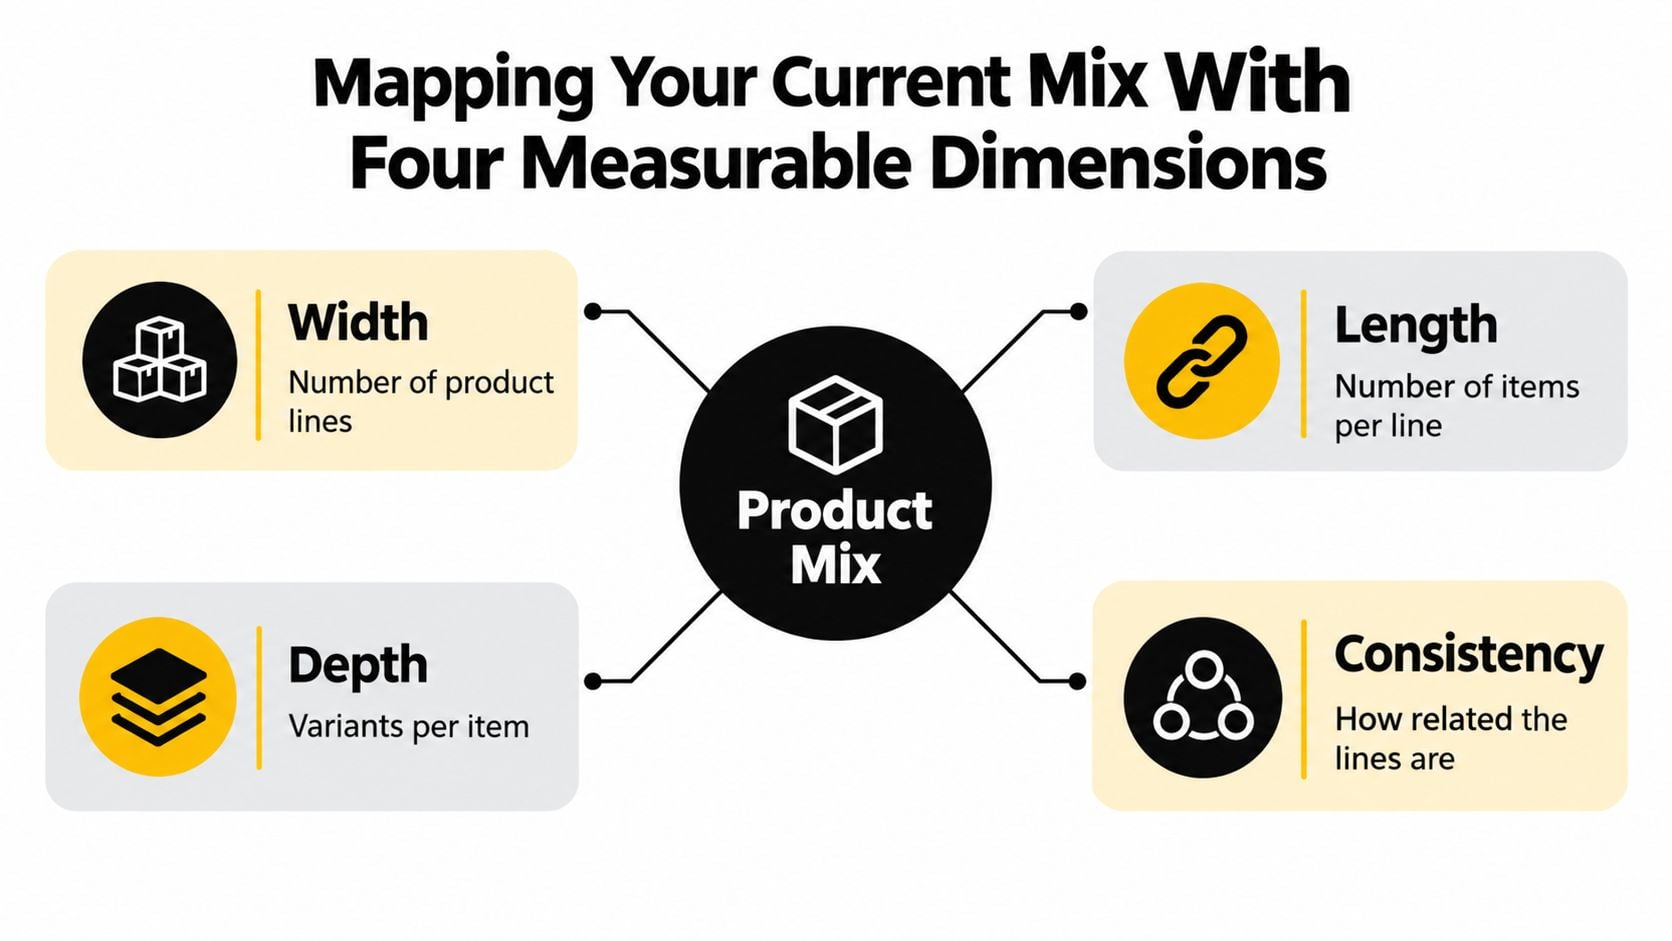
Build a one-page mix worksheet
Set up a worksheet with a row for each product, service, job type, or customer segment. Group related rows into lines, then record the variants available within each line. Add columns for shared labor, purchasing, delivery, equipment, and sales support so the team can see where offerings use the same resources and where they create separate operating demands.
For a quick illustration, a business with four lines and five products in each has a mix width of four and a total length of twenty products. The variants within each product determine depth, while the degree to which those lines share production or distribution resources indicates consistency. This example helps distinguish expanding the number of categories from adding more items or variations inside an existing category. A product-mix framework outlines these dimensions.
Use the worksheet in a working session with the controller or operations lead. First reconcile the list to actual sales records. Then flag duplicate offers, lines with almost no shared infrastructure, and variants that require unique inventory or service steps. Finish by marking which customer needs each line serves. The result should be a one-page portrait, not a polished catalog.
Use depth with care
More choice isn't always more useful. Academic retail research finds that deeper assortments can support sales for relatively undifferentiated variants, but can be associated with lower sales when variants are highly differentiated. The relationship between differentiation and depth follows an inverted-U pattern, which cautions against assuming that every additional option creates value (academic research on assortment depth).
For a mid-market owner, the practical question is whether each option answers a real customer need without adding disproportionate inventory, setup, or service work. Once the worksheet is complete, compare the operational footprint of each line with how often customers buy it. Reviewing the inventory turnover ratio can help identify items that sit in stock, but the ratio should be considered alongside customer role and contribution, not used as a cut list by itself.
The Constrained Contribution Margin Model
Gross margin can point in the wrong direction when a business is short of a specific resource. One offering may have a better margin percentage but take much longer to deliver, use scarce skilled labor, or require more handling. The better comparison is often contribution margin per unit of the binding constraint.
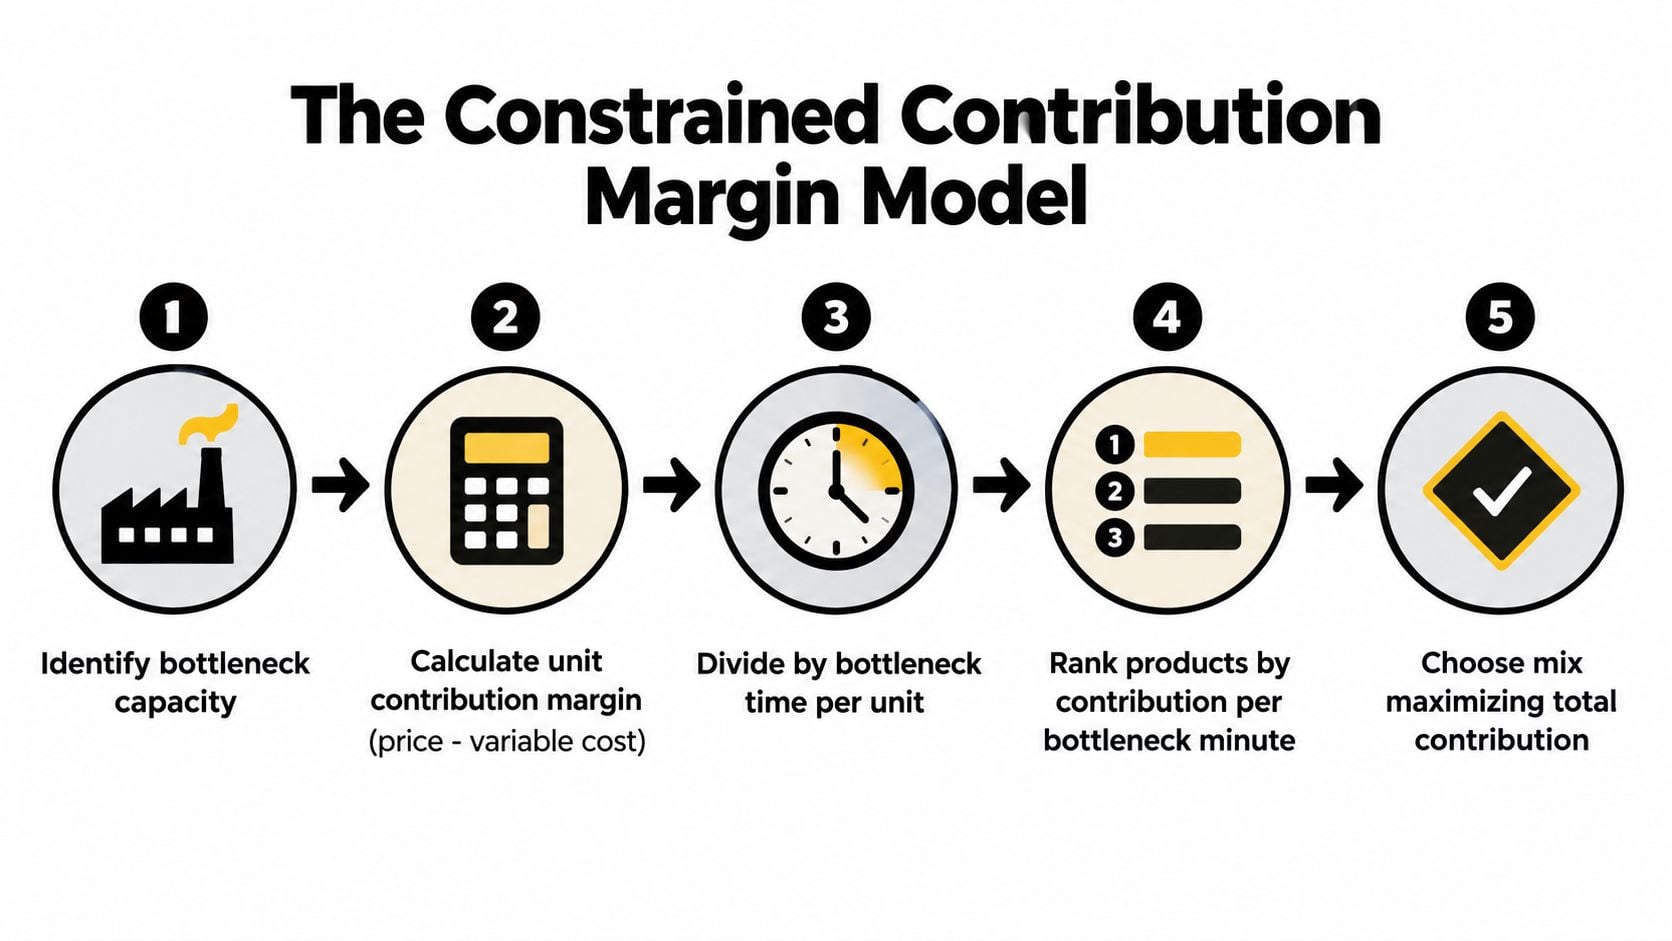
Rank by the resource you can't spare
Work through the model in order:
- Calculate unit contribution margin. Subtract variable costs from the selling price. Include costs that change with the job or sale, such as materials, delivery, commissions, or service labor.
- Name the bottleneck. A construction firm may be constrained by skilled labor. A distributor may be constrained by warehouse throughput, freight availability, or inventory. A professional-services firm may be limited by billable hours or the availability of specialized staff.
- Measure resource use. Work out how much of the scarce resource each offering consumes. For a labor-constrained contractor, that could mean crew hours per job.
- Rank offers by contribution per unit of constraint. Compare contribution per scarce labor hour, machine hour, warehouse slot, or other relevant limit, rather than relying on gross margin percentage alone.
- Allocate capacity and stress-test. Respect committed demand, service requirements, minimum volumes, and cash limits. Test what happens when demand, input costs, overtime, scrap, or setup time changes.
The ranking can reverse. A high-margin job that occupies a specialist crew for a long period may create less contribution per constrained hour than a smaller job that uses the same crew briefly. The model doesn't automatically recommend taking the smaller job; it gives the owner a clearer basis for comparing the opportunity cost.
A production-planning case using linear programming to optimize product and component supply raised weighted average margin by 26% versus fulfilling unconstrained demand, while also improving operating profit, return on assets, and cash-flow generation (production-planning case study). It's an example of what a constrained mix model can support, not a guarantee for another business.
Keep the inputs current
Refresh the analysis using actual job-, client-, or SKU-level costs. Stale standard costs can make an offer appear profitable even when delivery, warranty, or working-capital requirements have changed. Start with a monthly review, then investigate material changes sooner when costs or capacity shift. A segment margin formula can help structure the contribution calculation for product lines, jobs, or clients.
A Decision Matrix for SKU Rationalization
A SKU is a distinct stock-keeping unit, usually a specific product or variant tracked separately for sales and inventory. Rationalizing SKUs means deciding which items to retain, improve, bundle, or phase out. The exercise goes wrong when teams sort by revenue or volume alone and treat every low seller as expendable.
First, rank products by cumulative gross margin and mark where the portfolio reaches 80% of that margin. A McKinsey portfolio-complexity analysis found that the largest 30% of products generated more than 80% of cumulative gross margin. The analysis supports examining the long tail, but it doesn't mean every lower-contribution item should be removed (McKinsey portfolio-complexity analysis).
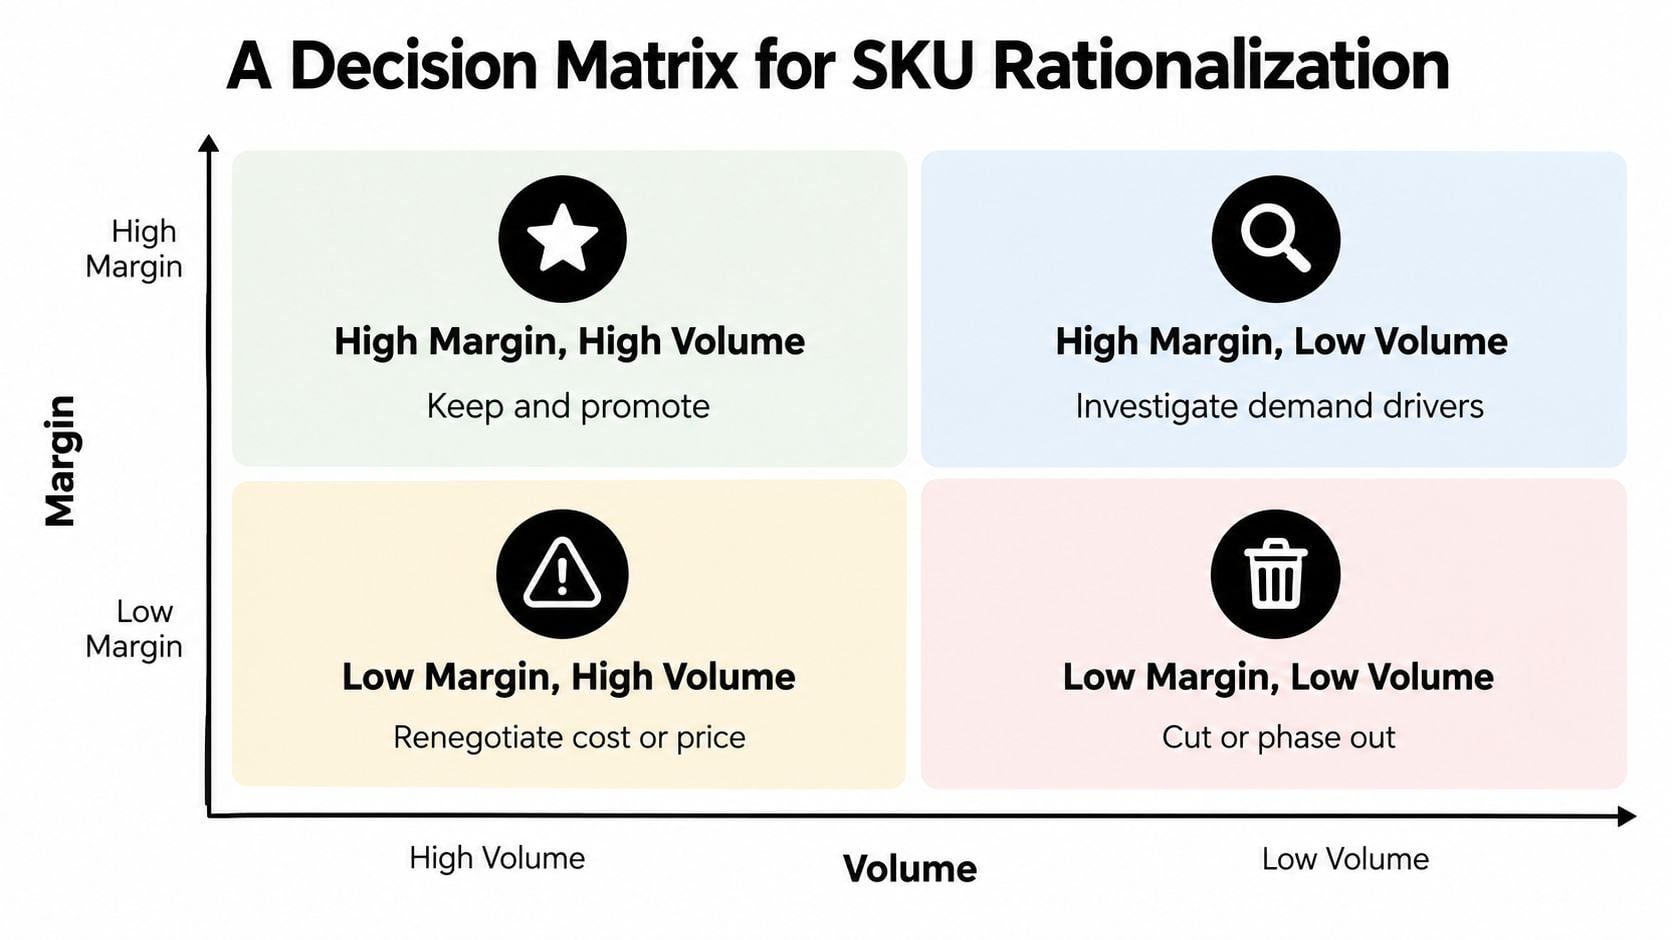
Classify before deciding
Use margin and sales volume as a starting view, then check operational cost, customer-specific value, cross-sell role, and strategic option value. Strategic option value is the potential benefit of retaining an offer because it supports a relationship or a future opportunity that matters beyond its direct sales.
| Pattern | First action | Check before changing |
|---|---|---|
| High margin, high volume | Keep and promote | Confirm capacity can support demand |
| High margin, low volume | Investigate demand drivers | Check whether it serves a valuable niche or fills otherwise idle capacity |
| Low margin, high volume | Improve economics | Review price realization, purchasing cost, and delivery effort |
| Low margin, low volume | Assess bundle or retirement | Check customer commitments, cross-sell role, and transition costs |
The action isn't always obvious. A construction firm might keep a lower-volume job type because it protects a broader customer relationship. A distributor might retain a special-order item if it helps secure a larger account. A professional-services firm might bundle a less attractive service with a core engagement rather than offer it alone.
Defend the decision with a scorecard
For each tail item, record its contribution, capacity use, working-capital demand, setup or fulfillment effort, and customer role. Choose keep when it earns its place, improve when pricing or delivery can fix the economics, bundle when it supports a stronger offer, and retire only when the customer and operating consequences are understood. If the diagnosis needs more structure, Reddog Consulting Group's guide to SKU rationalization offers additional context.
A product with weak standalone economics may still be load-bearing if its removal risks a profitable relationship. Conversely, strategic value shouldn't become an excuse to keep an offer indefinitely. Name the expected customer or capacity benefit, assign someone to verify it, and revisit the decision using actual performance.
Mix, Pricing, and 13-Week Cash Stress Testing
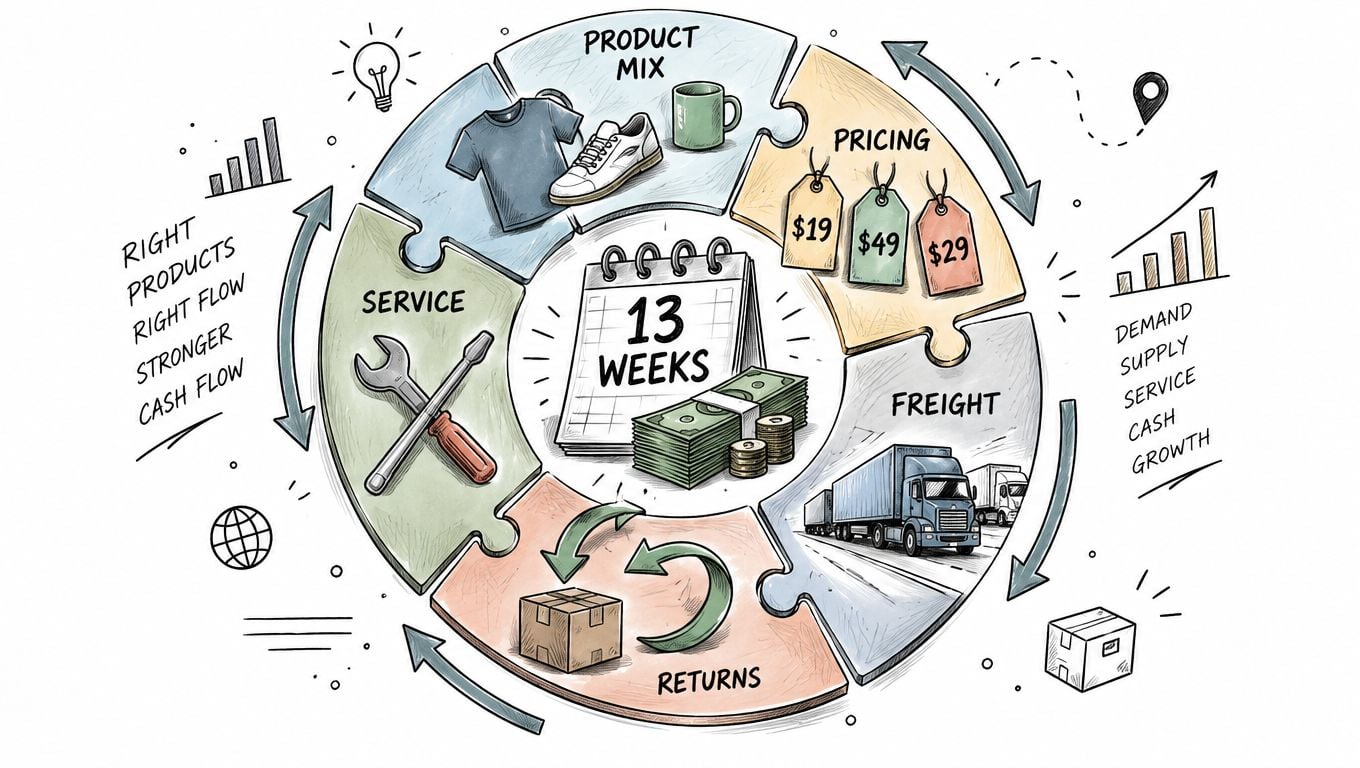
A product can look profitable on a margin report and still weaken cash. Discounts reduce realized price; freight, returns, warranty work, and service labor add cost; payment terms determine when cash arrives. If a company changes its mix without checking these effects together, a projected improvement may never reach the bank account.
A 2025 global pricing study found that volume remained the leading expected profit driver, but its influence fell from 50% in 2021 to 40% in 2025. It also reported that 46% of businesses experienced margin erosion from undifferentiated pricing (2025 global pricing study). For an owner, the lesson is not that volume no longer matters. It's that volume alone can hide discount leakage and differences in cost to serve.
Test the whole change, not just the headline
A distributor considering a new price or SKU reduction should test freight, supplier terms, stock commitments, and customer substitutions. A contractor bidding work with uncertain labor or material costs should test how a cost increase or overtime affects both contribution and cash collection. In either case, compare the current plan with the proposed one in the 13-week forecast.
When demand, scrap, or capacity is volatile, a single-point forecast can create false confidence. Probabilistic optimization tests many possible combinations of demand and operating costs, then checks whether a proposed mix still looks acceptable under downside conditions. One reported product-mix experiment used 50,000 Monte Carlo trials and indicated approximately a 10% potential increase in total contribution margin. The optimized approach outperformed prior managerial decisions in 91.15% of comparisons, with an average gain of about 5% (product-mix simulation study).
Those results are model-specific, not a forecast for your business. A theoretical gain can be erased by changeovers, scrap, minimum order quantities, rush freight, commissions, or customer concentration. Run the proposed move through both downside operating assumptions and the cash forecast before approving it. A 13-week cash flow template can help make the timing visible alongside the margin calculation.
Running a Monthly Product Mix Review
A product-mix strategy needs a recurring decision point. Without one, prices change, costs drift, and low-performing offers remain in the portfolio because nobody owns the follow-up. Fold the review into the monthly close so it uses current financial results rather than becoming a separate planning exercise.
Bring the owner, controller, and operations or sales lead together. Each person should own the inputs they know best: finance updates contribution and cash timing, operations reports capacity and setup demands, and sales flags customer commitments or cross-sell roles. A KPI dashboard can keep the measures visible between meetings.
Use a compact scorecard
Track each offering with fields that link economics to execution:
- Contribution per constrained unit: How much contribution the offer produces per scarce labor hour, machine hour, or other bottleneck.
- Capacity utilization: Whether it uses a scarce resource effectively or crowds out a stronger alternative.
- Cash conversion: How inventory, billing, and payment timing affect near-term cash.
- Customer-retention flag: Whether a key customer depends on the offer.
- Strategic option value: Whether it supports a larger relationship or future opportunity, with a named rationale.
Close with decisions and owners
Keep the agenda focused on four questions: which offers changed materially, what decisions are needed for the tail, where pricing exceptions have reduced realization, and how the proposed mix changes the 13-week cash forecast. For each decision, assign an owner and a date to check the result.
Trigger an improvement review when sales per SKU fall materially, contribution per constrained hour slips, or tail products consume more setup capacity than their returns justify. Those are prompts to investigate, not automatic cut rules. A slow seller may need a price change or bundle; an apparently healthy seller may be consuming capacity the company needs elsewhere.
A 90-minute meeting is a practical time budget for reviewing the scorecard, making decisions, and assigning actions. Send the chosen mix changes into the next cash forecast and carry the major decisions into the quarterly board update. This keeps the financial model, operating plan, and customer commitments aligned.
Your Next 90 Days and the Action Worth Taking This Week
Disciplined mix decisions can give a future buyer or successor a clearer story about margins, working capital, and how management allocates capacity. The opposite pattern can be easy to miss while revenue is growing: a McKinsey case found a company whose SKU count rose by more than 50% over three years saw sales per SKU fall by more than 30% and margins decline by about 10% (McKinsey's product-portfolio analysis).
This week, build a one-page mix scorecard from the decision matrix, identify the constraint behind each major offer, and test the proposed actions against the 13-week cash forecast. Review it with your finance lead before changing customer commitments or inventory plans. Over the next quarter, use the monthly cadence to see whether the decisions improve contribution and cash without weakening valuable relationships.
AmbitionCFO works with construction, distribution, and professional-services businesses on margin analysis, financial forecasting, 13-week cash flow modeling, KPI reporting, and exit planning. If you're weighing a product-mix change and want to see what it means for capacity, cash, and the value of the business, visit AmbitionCFO to discuss a structured review.