

Most owners ask the wrong question. They ask, “What should we charge?” when the actual question is, “What price covers our real cost structure, fits our capacity, and improves profit without buying fake growth?”
That's why pricing and cost analysis can't live in separate spreadsheets, separate meetings, or separate departments. McKinsey's pricing analysis found that for the average S&P 1500 company, a 1% increase in average selling prices produced an 8% increase in operating profit, while a 1% reduction in variable costs had a profit impact nearly 50% smaller. That should reset how you think about margin. Price is not a cosmetic sales decision. It is one of the hardest-hitting financial decisions on the income statement.
Table of Contents
- Why Pricing and Cost Analysis Belong in the Same Conversation
- Gross Margin Versus Contribution Margin
- Building a Contribution-Margin Floor Before You Quote
- Inflation Is Not One Number, and Neither Is Your Pricing Response
- The Best Project Is Not Always the Biggest Project
- Sensitivity Modeling That Actually Changes Decisions
- A 30-60-90 Day Plan for Pricing Governance
Why Pricing and Cost Analysis Belong in the Same Conversation
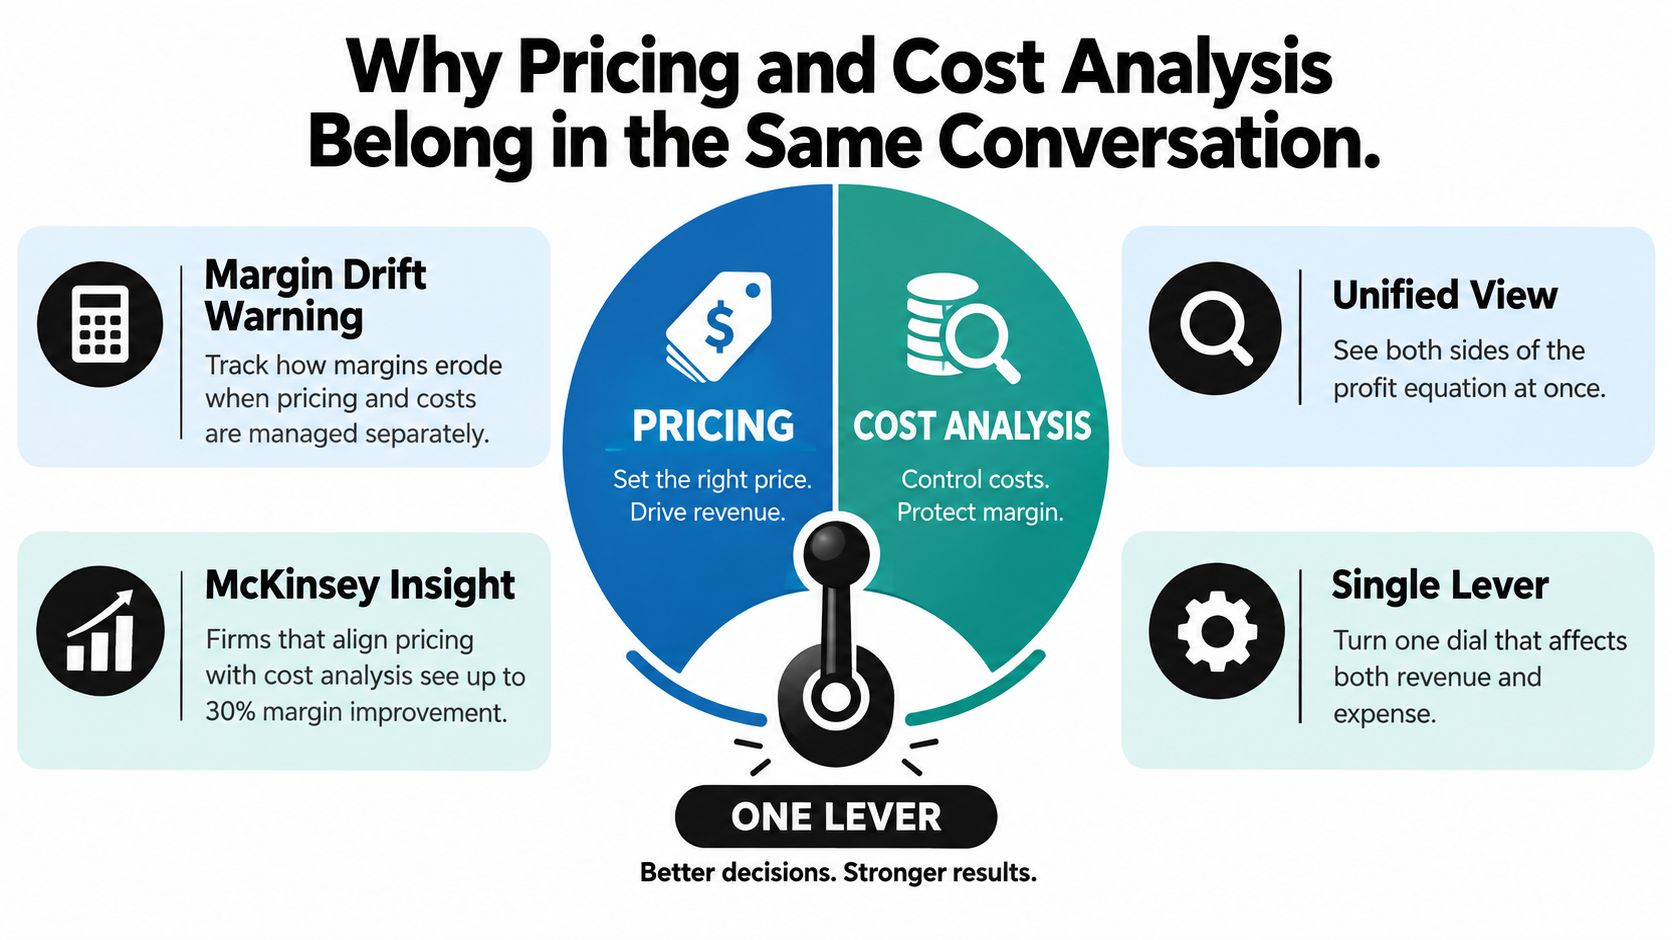
Pricing and cost analysis should control the same profit decision. Separate them, and sales pursues volume while operations absorbs overruns. Accounting then reports the result after the quarter closes.
Consider a company with $10 million in annual revenue and $1 million in operating profit. A 1% price increase adds $100,000 in revenue before volume effects. Applying the McKinsey benchmark implies roughly $80,000 in additional operating profit, assuming other conditions stay constant, as outlined in that same McKinsey pricing research. A 1% reduction in variable costs produces a profit impact nearly 50% smaller. Price deserves the first analytical review, not the last approval.
What owners usually miss
Price changes and cost changes affect the same profit equation from opposite sides. Reviewing them in isolation creates three predictable blind spots:
- Sales-only pricing: Reps discount to close work without checking whether the deal still covers its cost to serve.
- Accounting-only cost review: Finance identifies margin erosion after the job ships or the project ends.
- No customer-level view: Profitable revenue gets blended with low-quality revenue, leaving leadership unsure which accounts deserve protection or repricing.
Ask one integrated question: “What happens to volume, contribution margin, customer behavior, and delivery capacity if we change this price or cost?”
Practical rule: Require customer-level profitability and volume sensitivity before approving a pricing change. Require a pricing review before approving cost cuts, because disciplined pricing may improve profit with less operational damage.
One lever, not two chores
Cost analysis still matters. A price increase can reduce demand, trigger competitor responses, or change how customers assess value. The McKinsey benchmark supports serious price analysis, not blind increases.
Put four measures in the same decision:
- Real cost to deliver
- Realized price after discounts and leakage
- Margin by customer, job, or product line
- Likely volume response
If those figures are missing, the decision is a guess. Keep pricing and cost analysis together, then test the effect on profit before committing.
Gross Margin Versus Contribution Margin
Gross margin can make a weak deal look healthy. It measures revenue minus direct cost. Contribution margin goes further, showing what remains after variable costs to fund fixed overhead and produce EBITDA. Use both, but do not let gross margin approve work by itself.
The U.S. Small Business Administration's break-even guidance defines the break-even point as the level where total revenue equals total cost. The calculation is fixed costs divided by per-unit contribution margin, with contribution margin equal to price minus variable cost. In the SBA example, $240,000 of fixed costs, an $80 selling price, and $50 of variable cost create a $30 contribution margin per unit, or 37.5%. The business must sell 8,000 units to break even.
Why gross margin can mislead
A product, contract, or client may show a respectable gross margin while consuming excessive estimating time, project management, administrative support, software, financing, or owner capacity. Those demands belong in the decision because they affect the cash and capacity available to serve better work.
| Decision | Gross Margin | Contribution Margin | Better Filter |
|---|---|---|---|
| Basic product profitability | Shows whether direct costs are covered | Does not fully answer fixed-cost absorption | Gross Margin |
| Accepting a discounted order | May still look acceptable | Shows what remains after variable cost | Contribution Margin |
| Setting a pricing floor | Incomplete on its own | Identifies minimum viable economics | Contribution Margin |
| Evaluating customer quality | Misses service intensity | Shows whether the relationship helps fund overhead | Contribution Margin |
For a practical explanation of overhead and profit from Audit Genius, compare the listed overhead with the work's contribution margin. A deal that covers direct cost but leaves too little to support the business is not a strong deal.
Fully loaded cost is required
Include overhead and the owner's salary when identifying cost. In the SBA's example, a professional-services firm records $70 of direct compensation and $15 of software and project-specific cost, producing an apparent job cost of $85. Annual non-project overhead of $450,000 spread across 15,000 expected billable hours adds $30 per billable hour. The economic cost is $115, not $85, according to the legacy SBA resource on overhead allocation.
That distinction explains why service firms can grow revenue while remaining short of cash. Price decisions and cost analysis must use the same unit of work, the same volume assumption, and the same capacity constraints.
For a further explanation of the difference between costing and pricing, keep the two calculations separate, then connect them before approving a quote or discount.
A contract must clear two gates: cover direct cost, then contribute enough to justify the overhead and operating strain it creates.
Building a Contribution-Margin Floor Before You Quote
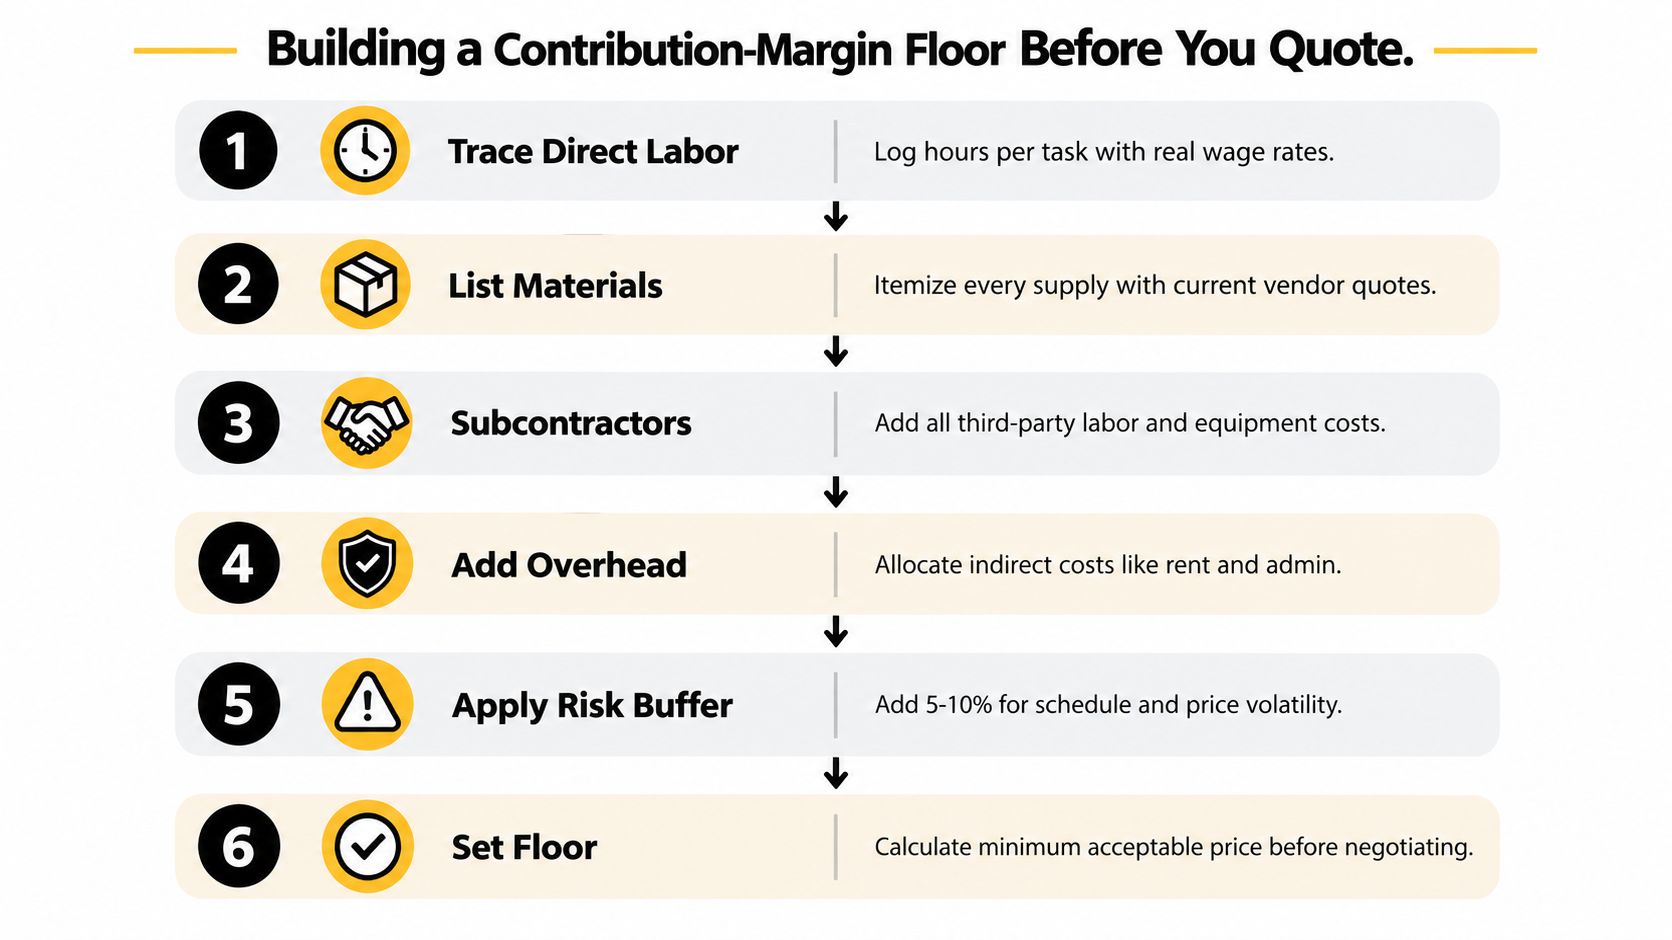
A 1% price increase can improve operating profit almost twice as much as a 1% cost reduction, according to the pricing comparisons established earlier. That makes pricing and cost analysis one decision. Before approving a quote, set a contribution-margin floor that covers the work and protects the business.
For distributors, the Bureau of Labor Statistics margin-price framework provides the right starting point. BLS defines trade-sector output through margin price, calculated as current selling price minus current acquisition price, because trade output is not measured like manufactured output.
The math is direct. Sell an item for $125 after acquiring it for $100, and gross margin dollars equal $25, or 20% of selling price. If acquisition cost reaches $110 while price remains $125, margin falls to $15, or 12%. Revenue stays flat while the economics deteriorate.
The six-step pre-quote routine
Run this routine before a bid, renewal, or discount approval:
Assign traceable direct costs. Include direct labor, materials, subcontractors, freight, commissions, and transaction costs. If the deal causes the cost, include it in the model.
Separate variable from fixed overhead. Identify costs that rise with volume and costs that remain broadly stable. A single overhead bucket hides the effect of additional work.
Calculate contribution margin and break-even volume. The break-even worksheet in the SBA planning resources referenced earlier remains a simple sanity check.
Segment by realized margin. Review customers, jobs, and contracts by actual results, not by the estimate promised at approval.
Test sensitivity before quoting. A small discount may require unrealistic volume gains to preserve profit. For capital-recovery thinking, Doczen's payback period guide helps owners assess time, recovery, and return together.
Review realized price after leakage. Credits, rush work, rework, and scope creep can turn an apparently profitable quote into a weak contract. Record those effects after delivery.
Why cost-plus alone is a trap
The core equation is Price = Fully loaded cost ÷ (1 − target gross-margin percentage), as summarized in Bank de Mark's pricing strategy discussion. Use that equation to establish the floor, not to set the final price. Customer value, competitive position, capacity constraints, and price elasticity still determine whether the quote is commercially sound.
Keep a current schedule for cost of goods sold tied to actual purchasing and labor behavior. It gives the floor a factual cost base and exposes leakage before the next quote.
Inflation Is Not One Number, and Neither Is Your Pricing Response
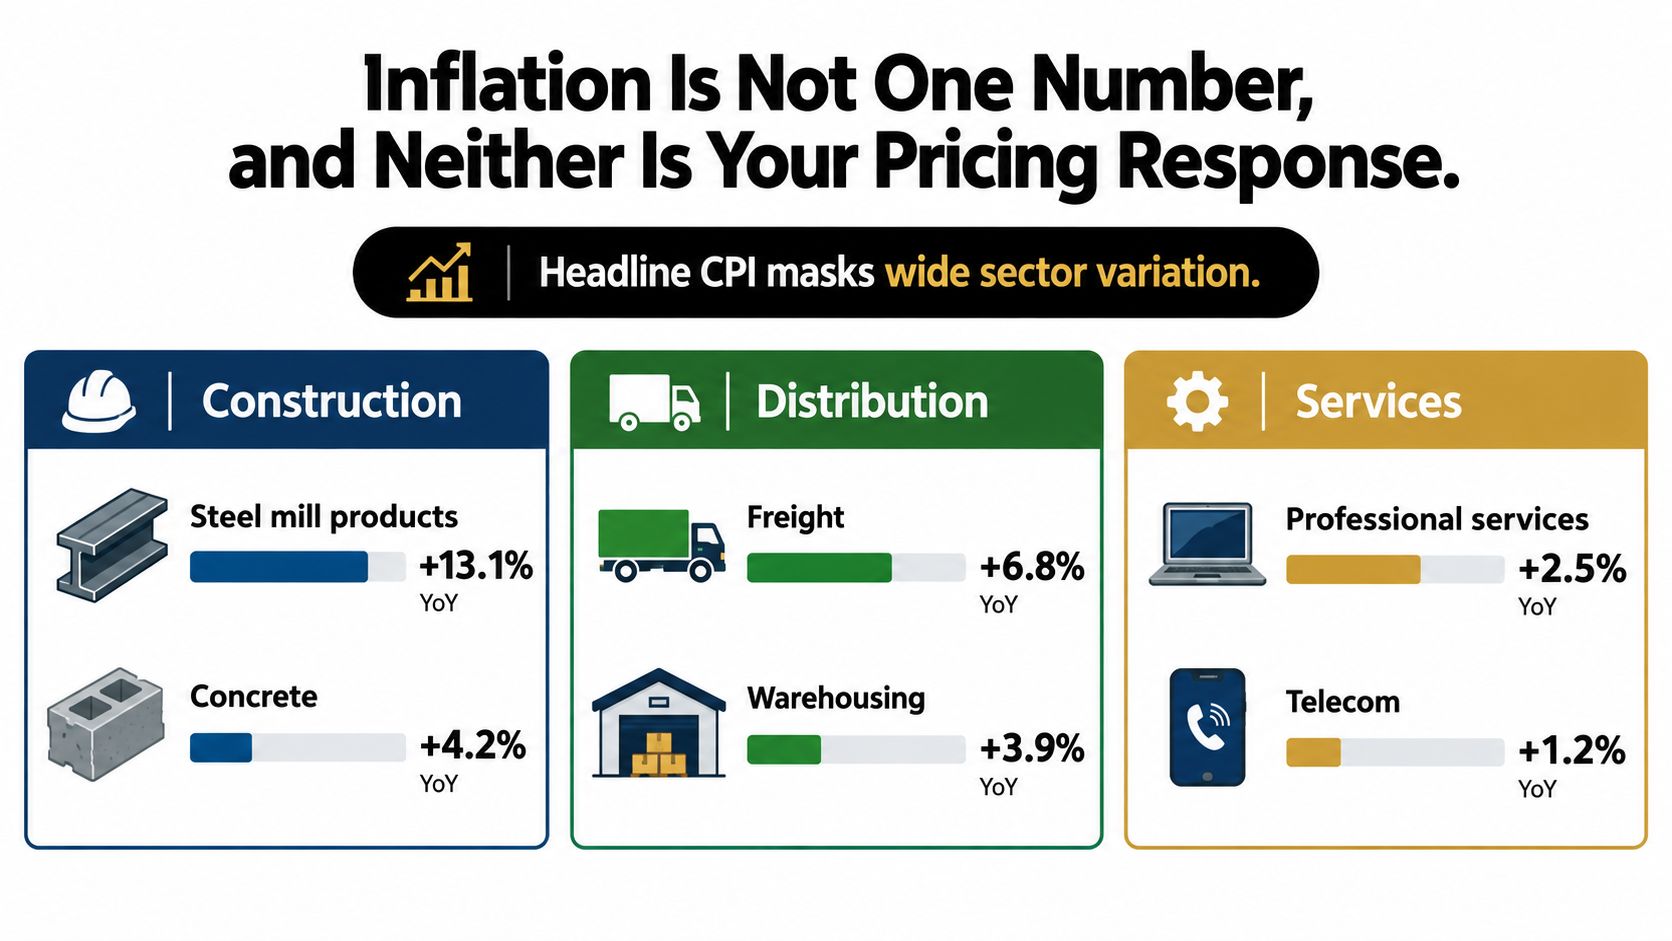
A lot of businesses still apply one broad inflation markup across every quote. That's lazy pricing, and it misses where the risk sits.
In construction and project-based work, input exposure varies by scope. ENR's 2025 cost report reported steel mill products up 13.1% year over year and aluminum mill shapes up 22.8% in August 2025, while lumber and plywood rose 4.8%. Same economy. Very different pricing pressure.
What selective repricing looks like
If one job is metal-heavy and another is wood-heavy, they should not get the same pricing response. Owners need to map each active quote or contract to its dominant exposure:
- Metal-intensive scopes: watch steel, aluminum, copper exposure, supplier lead times, and substitution limits.
- Labor-heavy scopes: review labor assumptions, rework risk, and schedule compression.
- Mixed scopes: split the estimate instead of using a single blended escalation assumption.
That's more work than applying a flat markup. It's also more accurate.
The same ENR analysis noted that 43% of surveyed contractors said at least one project had been canceled, postponed, or scaled back because of higher costs in 2025 projections and reporting conditions, which tells you customers are reacting too, not just suppliers. Blanket increases can push good clients into delay mode if you can't explain the cost logic.
Here's a useful visual on how input volatility affects planning:
The right response is rarely one percentage
A smarter process looks like this:
- Identify exposure by contract. Don't discuss inflation in the abstract. Tag estimates by dominant material and labor risk.
- Use quote-validity windows. If vendor pricing is unstable, shorten the period your quote remains binding.
- Add escalation clauses where the contract allows it. Especially on long-duration work with volatile inputs.
- Redesign before you discount. Material substitutions or scope changes often preserve margin better than a broad concession.
If your team needs a sharper cost framework before repricing, this breakdown of factors affecting cost helps organize the underlying drivers.
Inflation doesn't hit your business evenly. Stop pricing as if it does.
The Best Project Is Not Always the Biggest Project
The biggest job on the board often gets the most attention. That doesn't make it the best job.
When capacity gets tight, you need to price for crew availability, schedule risk, and cash conversion, not just direct cost. AtkinsRéalis construction data for later 2025 showed average construction labor costs up 5.6% year over year, with trade-partner work up 6.2% and materials up 9.1%. That means a project can look profitable on paper and still become unattractive once overtime, subcontractor premiums, mobilization, retainage, and working-capital drag show up.

Three filters that matter more than headline revenue
Owners should pressure-test every major project through these filters.
- Capacity-adjusted margin per labor hour: If your best crews are constrained, a lower-revenue job with better margin per labor hour may beat a large contract that ties up your team.
- Cash burn through the job: Long mobilization, slow billing, or heavy retainage can punish the business even if the final margin looks acceptable.
- Sensitivity to slippage: A job that becomes ugly when the schedule stretches is not the same as a resilient job with cleaner billing and lower coordination risk.
Many founder-led firms get trapped here, chasing backlog instead of economic quality.
Ask a better pre-bid question
Don't ask only, “What margin does this project make?”
Ask, “What price and payment terms make this project worth accepting with our current crews, current cash demands, and current risk profile?”
That question changes behavior. It forces sales, operations, and finance into the same room. It also keeps you from filling the schedule with work that starves the company.
If you're still reviewing projects without that structure, tighten your job costing process before the next bid cycle.
Sensitivity Modeling That Actually Changes Decisions
Most companies say they do sensitivity analysis. Very few build a model that changes a real decision.
A useful model doesn't need to be fancy. It needs to test the variables that swing margin. For project-based and service businesses, those variables are usually labor productivity, material price, and volume. If your model can't show what happens when one of those moves, it's a reporting tool, not a decision tool.
Stage-gate the estimate
The PMI reference on estimating accuracy and forecasting is a strong reality check. Published estimating benchmarks show accuracy of roughly 30% to 50% at the conceptual stage, about 20% during design, around 10% at tendering, and approximately 5% during preconstruction. The same research reported mean cost overruns of 34.7% across 2,221 infrastructure projects. That's why contingency should be tied to estimate maturity and quantified risk, not habit.
For owners who want a cleaner primer on testing variable impact, parameter sensitivity methods explained gives a practical framework that pairs well with finance models.
Build contingency by stage. A rough concept estimate and a near-final preconstruction estimate do not deserve the same confidence level.
Include every real cost line
Your model should include the full construction pricing checklist reflected in the U.S. Census Bureau's construction spending methodology: labor and materials, architectural and engineering work, overhead, interest and taxes paid during construction, and contractor profit.
That checklist matters because incomplete estimates create fake margin.
In the Census example, a project with $600,000 of labor and materials, $60,000 of architectural and engineering work, $45,000 of project overhead, $15,000 of interest and taxes, and $80,000 of desired contractor profit requires $800,000 of contract value. If expected labor and materials rise by 8%, that category becomes $648,000, and the same structure requires $848,000 of revenue.
If you want a better distinction between model types, this guide on the difference between sensitivity analysis and scenario analysis is worth reviewing with your leadership team.
The output that matters
I don't want a colorful dashboard first. I want a monthly estimate-at-completion bridge showing:
- Original contract value
- Approved changes
- Committed cost
- Incurred cost
- Remaining cost
- Contingency consumed
- Projected gross-margin variance
That report changes decisions because it shows where the estimate broke, when it broke, and what you still have time to fix.
A 30-60-90 Day Plan for Pricing Governance
Good pricing discipline doesn't come from a heroic spreadsheet. It comes from operating rhythm.
Days 1 through 30
Start by cleaning the inputs. Standardize cost codes. Build a customer-level or job-level P&L. Calculate fully loaded cost per labor hour or per unit. Write a simple pricing policy that defines three bands: floor price, target price, and ceiling price.
Also decide who can approve discounts, and under what conditions. If that isn't written down, your pricing policy isn't a policy.
Days 31 through 60
Now install the review cadence.
- Monthly estimate-at-completion review: compare original estimate, actual performance, and cost-to-complete on active jobs.
- Quarterly price-volume review: test where small price changes force unrealistic volume assumptions.
- 13-week cash forecast: tie billing milestones, purchasing commitments, and labor loading to expected cash movement.
This is the point where one outside option can help. AmbitionCFO works with founder-led companies on 13-week cash flow modeling, margin analysis by job or client, KPI dashboards, and forecasting, which fits this phase because owners usually need someone to connect cost models with pricing decisions, not just report the numbers.
Days 61 through 90
Finish with governance. Build a dashboard that tracks gross margin, contribution margin, realized price versus quoted price, and volume versus break-even. Then create a reprice-or-redesign trigger. If sensitivity work shows a small discount would require implausible volume to preserve gross profit, the deal gets reworked or declined.
The goal isn't more reporting. The goal is faster correction before bad pricing turns into a bad quarter.
The worksheet fields are simple. Product or job name. Direct cost. Variable overhead. Fixed-cost allocation. Target margin. Realized price. Expected volume. Break-even volume. Cash terms. Capacity impact. If your team fills that out before signing, you'll make better decisions immediately.
If your margins feel inconsistent, your issue usually isn't effort. It's that pricing, cost, and cash decisions are still disconnected. AmbitionCFO helps founder-led businesses tie job costing, pricing discipline, margin analysis, and cash forecasting into one operating model so owners can price work with confidence and protect profit before it leaks away.