
84% of organizations forecast monthly or quarterly, but only about two-thirds forecast cash flow. For a growing business, that gap can leave you staring at a profitable income statement while wondering whether payroll, suppliers, and debt payments will clear.
That's the founder's real FP&A reporting question: how much cash can the business use, and which decisions need to change before the bank balance becomes a problem?
You may recognize the situation. Revenue looks healthy. Gross margin appears acceptable. The accounting system shows profit. Yet customers are slow to pay, a large materials order is due, and payroll lands before the next collection. The reports are accurate, but they aren't answering the question that matters this week.
Strong FP&A reporting connects historical results to future choices. It shows what happened, why it happened, what cash will do next, and who needs to act. That's the standard founders should demand.
Table of Contents
- The Founder's Dilemma
- Understanding FP&A Reporting Essentials
- Designing Effective Reports and Dashboards
- Common Pitfalls and Best Practices
- Case Study – Navigating Cash Flow Challenges in Construction
- Implementing FP&A Reporting in Your Business
- Key Takeaways and Next Steps
The Founder's Dilemma
A construction founder opens the monthly income statement and sees a profitable business. The projects are moving. Revenue is up. The company has earned money on paper.
Then the founder checks the bank account and starts calculating whether payroll can clear.
The problem isn't necessarily an accounting error. Profit and cash follow different timing rules. The company may have recorded revenue before collecting the related invoice. It may have purchased materials before billing a customer. It may owe subcontractors while waiting for retainage or an approved pay application.

Founders are the ones who get burned here. They trust the income statement because it looks professional, then discover that reported profitability doesn't equal available liquidity. A profitable company can still delay hiring, postpone equipment purchases, negotiate with vendors, or draw on financing because cash arrives later than costs become due.
The report most founders are missing
A monthly profit-and-loss statement answers one question: did the business generate accounting profit during the period? It doesn't answer whether customers will pay on time, whether committed project costs are funded, or whether the company can absorb a weak collection week.
That's why a cash forecast belongs beside the income statement, not in a separate file that nobody opens until there's a crisis. The leadership team needs a direct bridge from revenue and gross margin to collections, payroll, supplier obligations, taxes, debt service, and capital spending.
For founders building a company from the ground up, practical funding and operating perspectives are also available through the funded startup feed. Use outside resources to sharpen decisions, but keep your internal cash model grounded in your own contracts, collection dates, and obligations.
Practical rule: If your report can't tell you which payment or commitment threatens cash this month, it isn't a management report yet.
The fix isn't a more attractive dashboard. It's a reporting process that makes timing visible. Start with actual cash, add expected inflows, subtract known outflows, and attach an owner to every material assumption. That simple discipline changes the conversation from “Are we profitable?” to “What can we safely do next?”
Understanding FP&A Reporting Essentials
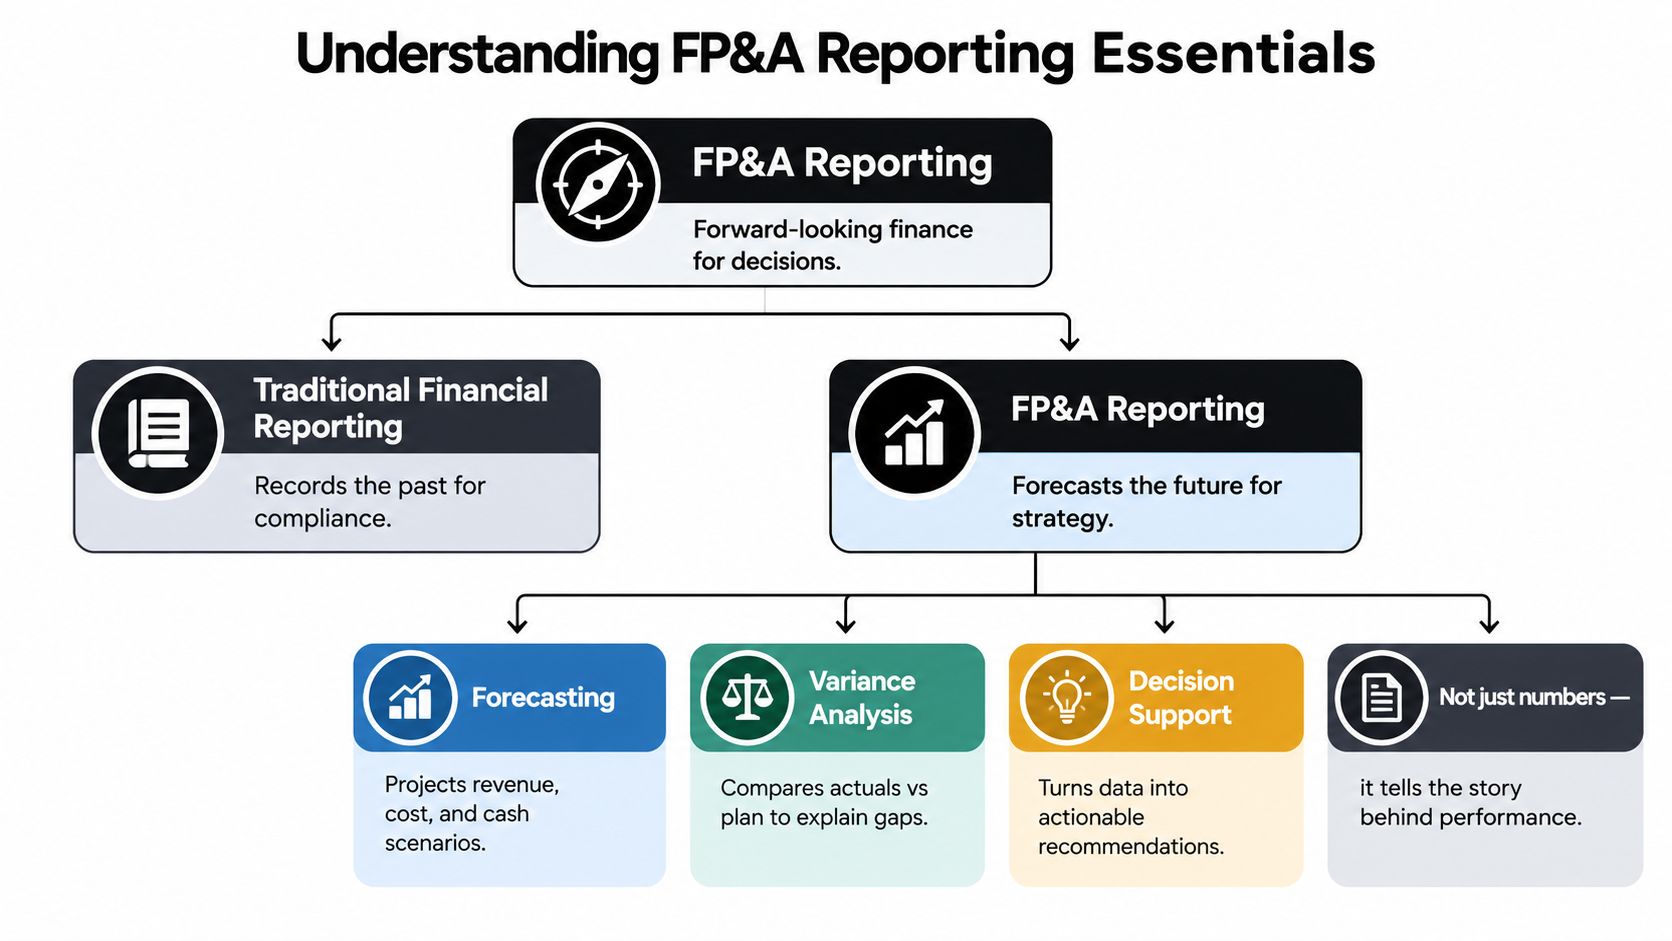
FP&A reporting means using financial and operating data to forecast outcomes, explain variances, and support decisions. Traditional financial reporting records what already happened. FP&A reporting uses those results as a starting point for what management should do next.
The difference matters. A financial statement may show revenue, expenses, assets, liabilities, and cash movements. FP&A adds context, including the budget, the latest forecast, operational drivers, and the management action attached to each important gap. This makes it a decision system rather than a historical record.
Deloitte's global planning, budgeting, and forecasting research found that 84% of surveyed organizations forecast monthly or quarterly, while only about two-thirds forecast cash flow. The same research found that almost all organizations forecast profit-and-loss items, which makes the cash-flow gap especially important for growing and project-based companies. Deloitte's planning, budgeting, and forecasting research supports a straightforward conclusion: frequent reporting without an explicit cash view still leaves leadership exposed.
Three jobs of an FP&A report
Forecasting projects revenue, cost, cash, staffing, and investment under stated assumptions. A forecast is not a promise. It's a working view that changes when volume, pricing, timing, or capacity changes.
Variance analysis compares actual results with the budget or prior forecast. Good analysis identifies the driver, not just the amount. “Gross margin is below plan” is incomplete. “Material costs increased on two jobs and the overrun is likely to continue” gives management something to address.
Decision support turns the analysis into a recommendation. The report should help leaders decide whether to hire, purchase equipment, accept a contract, change pricing, accelerate collections, or preserve cash.
A useful FP&A process also distinguishes accounting profit from cash availability. The FDIC explains that an actual cash-flow statement records movements that occurred, while a cash-flow projection estimates future inflows, outflows, and ending cash. The FDIC cash-flow guidance provides the practical foundation: begin with opening cash, add expected collections, subtract obligations, and calculate the projected ending balance.
For a deeper explanation of the reporting distinction, review what financial reporting means for management. Then apply the test to your own reports: every page should either explain performance, forecast a consequence, or support a decision.
Designing Effective Reports and Dashboards
A report becomes useful when a specific person can use it to make a specific decision. Start there. Don't begin by choosing colors, charts, or software.

Build the reporting spine
Use this sequence:
Name the decision. If the owner needs to decide whether to add a crew, the report needs backlog, capacity, labor cost, project margin, and cash impact. A general KPI page won't answer the question.
Assign data ownership. Name one person responsible for revenue data, one for payroll or headcount, one for job costs, and one for the forecast assumptions. Shared responsibility often becomes no responsibility.
Set the cadence. Review cash and urgent exceptions weekly. Review the full management package monthly. Reforecast when a major assumption changes, not only when the calendar says it's time.
Separate actuals from estimates. Label each figure clearly. A collected payment, an approved invoice, and an expected collection aren't interchangeable.
Show the driver beside the result. Pair gross margin with labor hours, material cost, project progress, or client mix. Pair accounts receivable with expected collection dates. Pair headcount with payroll and capacity.
Put action beside variance. Every material variance needs an owner, a cause, a duration, and a next step.
The SEC's management guidance offers a strong model for internal reporting. Cash-flow analysis should explain primary drivers and material factors, assess both the amount and certainty of cash flows, and address the company's ability to meet current and reasonably likely future requirements. The SEC's MD&A guidance supports a useful monthly format: actual result, budget variance, primary driver, expected duration, and management action.
Keep the dashboard decision-sized
| Component | Purpose | Frequency |
|---|---|---|
| Profit and loss | Explain revenue, gross margin, and overhead performance | Monthly |
| Rolling cash forecast | Show expected inflows, outflows, and ending cash | Weekly |
| Accounts-receivable aging | Identify collection risk and overdue balances | Weekly |
| Budget versus actuals | Expose gaps against the operating plan | Monthly |
| Operational drivers | Connect activity, capacity, pricing, or job performance to finance | Weekly or monthly |
| Scenario model | Test hiring, equipment, pricing, contract, or expansion decisions | As decisions arise |
Use charts to show movement and tables to show accountability. A line chart can expose a deteriorating cash balance. A short table can show the customer, amount, expected collection date, and collection owner. Don't bury a decision in a dashboard full of decorative metrics.
The KPI dashboard design guide can help you evaluate layout and metric selection. Before adding any KPI, ask who will act on it and what action it should trigger.
See how a finance leader can translate this structure into a management conversation:
Common Pitfalls and Best Practices
Most reporting failures don't start with bad intentions. They start with a process that grew one spreadsheet, one workaround, and one exception at a time.
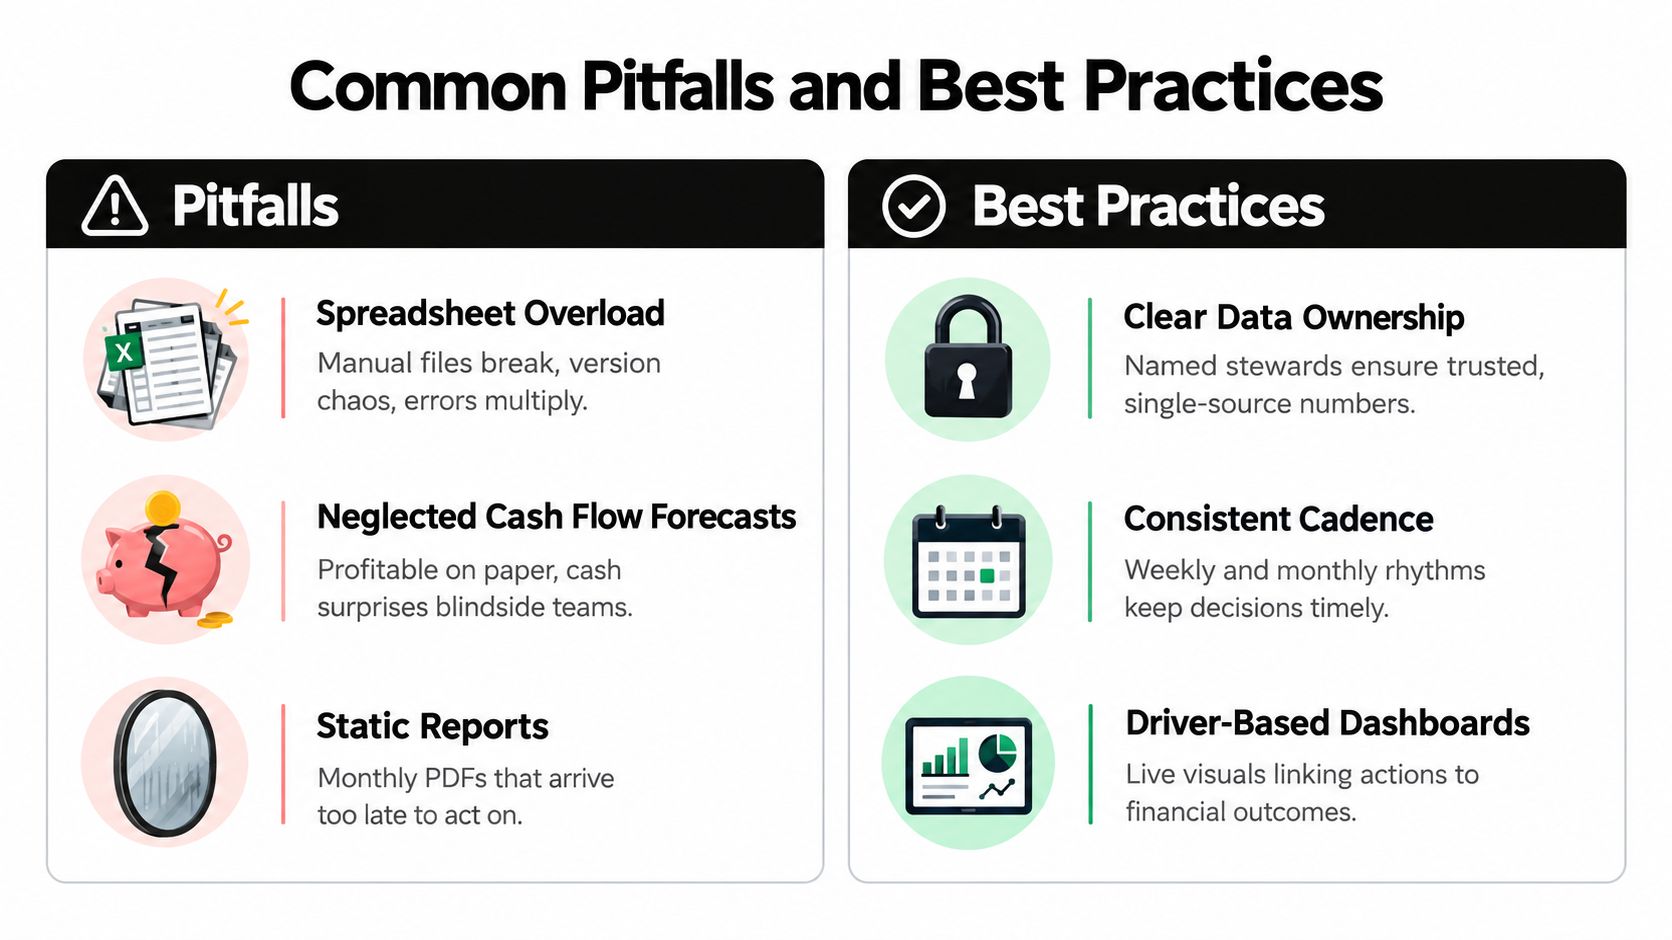
The finance team exports data from the general ledger. An operations manager updates a project file. The owner keeps a separate cash worksheet. Nobody knows which version controls. By the time the numbers reach leadership, the report may be internally consistent and still disconnected from reality.
Compare the failure mode with the fix
| Common mistake | What it causes | Better practice |
|---|---|---|
| Spreadsheet overload | Version conflicts, manual errors, and delayed close | Use a controlled source of financial data with documented inputs |
| No cash forecast | Profit appears healthy while payment timing creates pressure | Maintain a rolling cash view with dated inflows and outflows |
| Static monthly reports | Leaders receive information after the decision window | Set weekly exception reviews and monthly performance reviews |
| Unowned assumptions | Nobody can explain why the forecast changed | Assign an owner and approval path to each major assumption |
| KPI overload | Attention spreads across metrics with no decision value | Keep measures tied to operational drivers and management actions |
Manual work remains a serious constraint. A survey of CFOs from businesses with up to 500 employees found that 41% of FP&A processes were manual, consuming approximately 10 hours per week of skilled finance time. The same survey found that 70% of CFOs relied on Excel for financial budgeting and forecasting. The survey findings on manual FP&A work show why process design matters even for smaller finance teams.
Spreadsheets aren't automatically wrong. They become dangerous when they hold the only version of the forecast, combine raw data with assumptions, and lack change control. Keep spreadsheets for analysis where they add value, but don't let an ungoverned file determine hiring, borrowing, or contract decisions.
Control the inputs before you automate the output. A polished report built on stale job costs or unowned collection dates only makes bad information easier to trust.
For a practical review of report structure, ownership, and cadence, use these financial reporting best practices. The standard is simple: leadership should know what changed, why it changed, what happens next, and who owns the response.
Case Study – Navigating Cash Flow Challenges in Construction
A commercial contractor completes a project phase and records the related revenue. The income statement looks profitable. The project manager reports that production is on track.
The cash problem appears elsewhere. The contractor has paid labor and materials, owes subcontractors, and is waiting for the customer's pay application to move through approval. The next payroll arrives before the collection. The business has earned profit, but the bank balance can't fund the timing gap.
Construction makes this exposure particularly visible. Subcontractors reportedly wait an average of 54 days after submitting a pay application to receive payment, while the average construction net-before-tax margin is 6.7%. Construction cash-flow benchmarks illustrate why a narrow margin and delayed collections can create immediate liquidity pressure.
What the monthly report missed
The contractor's income statement showed the economic result of work performed. It didn't show the dates attached to collections, retainage, committed costs, or payroll. The report answered, “Did the job make money?” It failed to answer, “Can the company fund the next several weeks?”
A decision-grade construction report should connect five views:
- Job margin to date: Compare actual labor, materials, and subcontractor costs with the job budget.
- Margin to complete: Estimate the remaining cost required to finish the contracted work.
- Billing milestones: Show what has been billed, approved, disputed, and still available to bill.
- Receivables timing: Assign an expected collection date to each material customer balance.
- Cash commitments: Include payroll, vendor obligations, retainage effects, debt payments, and equipment spending.
The corrective action isn't to wait for the month-end close. Build the cash forecast from the opening bank balance, expected customer collections, payroll, taxes, vendor bills, capital expenditures, and owner distributions. Update expected dates when project managers or customers provide new information.
The contractor might discover that a project variance is not just a margin issue. A delayed approval may be the reason cash falls below the operating threshold. That finding changes the action. The owner may escalate the pay application, revise the purchasing schedule, defer discretionary spending, or arrange financing before the shortfall becomes urgent.
For a construction-specific operating framework, review construction cash-flow management guidance. The key lesson is direct: a faster close and a better-looking dashboard won't protect a contractor if the report ignores payment timing.
Implementing FP&A Reporting in Your Business
You don't need a large finance department to establish useful FP&A reporting. You need a controlled process, a defined rhythm, and someone accountable for turning information into decisions.
Start with the data you already have. Connect the general ledger to bank activity, accounts receivable, accounts payable, payroll, sales or pipeline data, and operational systems such as job costing or project management. Don't wait for perfect integration. Document the gaps and identify which assumptions require manual review.
Build the process in practical stages
First, load historical actuals. The SBA recommends that established businesses prepare three to five years of historical income statements, balance sheets, and cash-flow statements, then build a five-year prospective outlook. Its guidance also calls for the first forecast year to use quarterly or monthly projections, including projected statements and capital-expenditure budgets. The SBA business planning guidance gives founders a sensible structure for comparing current performance with the assumptions behind the plan.
Next, create the operating forecast. Build revenue from units, customers, jobs, contracts, or capacity instead of applying a vague growth assumption. Build costs from headcount, labor rates, materials, vendors, facilities, and financing obligations. Link the assumptions to a profit-and-loss statement, balance sheet, and cash forecast.
Then, establish review ownership. Finance can maintain the model, but operations must own operational assumptions. Sales should own pipeline and expected bookings. Project leaders should own job progress and cost-to-complete. The owner should approve major scenarios and capital decisions.
Finally, automate repetitive preparation. Use accounting integrations, scheduled exports, standardized templates, and controlled dashboards to reduce re-keying. Automation should free skilled finance time for variance analysis, scenario planning, and business partnering, not remove human review.
A rolling forecast should change when the business changes. A new contract, equipment purchase, major hire, delayed collection, or project overrun deserves a documented update. The financial forecasting models guide provides useful context for choosing the right model structure.
For a practical budgeting reference outside your accounting workflow, the Small Business Budgeting Guide offers another planning resource. Keep the final model tied to decisions, owners, and dated cash movements.
Key Takeaways and Next Steps
FP&A reporting should answer more than whether the business made money. It should show what changed, why it changed, when cash moves, and what management must do next.
The most important principles are straightforward:
- Forecast cash separately from profit. An income statement can show success while payment timing creates a funding problem.
- Use drivers, not vague assumptions. Revenue, labor, materials, collections, capacity, and customer mix should connect to the forecast.
- Give every number an owner. Someone must be responsible for the source data, assumption, explanation, and action.
- Review on a useful cadence. Weekly cash and exception reviews support immediate decisions. Monthly reporting supports performance management.
- Write the implication beside the variance. A number without a cause and management response is incomplete.
- Test major decisions before committing. Hiring, equipment, expansion, new contracts, and succession plans belong in an integrated forecast.
Start tomorrow with a short diagnostic. Pull the current bank balance, open receivables, unpaid bills, payroll commitments, debt payments, expected collections, and next major capital requests. Compare that cash view with the latest profit-and-loss statement. If the two tell different stories, don't argue over which one is “right.” Investigate the timing difference and assign someone to resolve it.
Then create one management page with actual results, forecast, variance, cash impact, owner, and next action. That page will expose more decision risk than another collection of disconnected KPIs.
AmbitionCFO provides fractional CFO support for founder-led businesses, including financial reporting, budgeting and forecasting, KPI dashboards, margin analysis, and 13-week cash-flow modeling. Visit AmbitionCFO to discuss a reporting process that connects profitability with cash and gives your leadership team a clear next decision.