

You're growing, the jobs are full, the pipeline looks healthy, and yet the bank balance keeps catching you off guard. That's the moment when a business owner realizes revenue isn't control, and control isn't a feeling, it's a system. If you run a construction, distribution, or professional services firm in the $10M to $100M range, the question usually isn't how to sell more, it's how to get a real grip on cash, margin, and forecast accuracy before the next surprise hits.
Table of Contents
- Moving from Gut Feel to Financial Control
- Diagnose Your Financial Blind Spots
- Prioritize High-Impact Financial Levers
- Implement Your 13-Week Cash Flow Model
- Drive Profitability with Granular Analysis and KPIs
- Build a Financial Cadence to Measure and Win
Moving from Gut Feel to Financial Control
The owner who feels busiest is often the one with the least visibility. Work is flowing, people are stretched, and the monthly financials arrive too late to change anything meaningful. That's why business performance improvement has to start with a financial operating system, not a bigger to-do list.
Practical rule: if a change won't affect cash flow, margin, or forecast accuracy in the next quarter, it's probably not your first move.
Many leaders get trapped trying to improve everything at once. Independent advisory guidance recommends prioritizing initiatives with returns in a three-to-nine-month window and avoiding long-horizon projects early on, because the first job is to free up cash and leadership attention, not to create a grand redesign that never lands Capstone Partners. That advice fits owner-led businesses perfectly, because your real bottleneck is usually not ambition, it's bandwidth.
For a better dashboard and clearer decision-making, I'd also point you to this guide to optimizing BI decisions, especially if your team already has data tools but still lacks usable answers. On the reporting side, this financial reporting best practices guide is a useful companion if your monthly package still feels too backward-looking.
What control actually looks like
Control is not a thicker report package. It's knowing, by the time you make payroll or approve a job, whether the decision helps or hurts cash and margin.
That usually means you stop asking, “How did we do last month?” and start asking, “What will happen if we keep taking this kind of work, paying vendors this way, and waiting this long to collect cash?” The shift sounds small, but it changes how you manage the entire company.
The right first question
The question under the stress is simple: How do I get control of my numbers? You get there by narrowing the field. Small businesses are commonly advised to focus on just four to six KPIs so decision-makers can act quickly without getting buried in data NetSuite, Xero.
That discipline is why the old habit of glancing at revenue and profit isn't enough anymore. You need visibility into the moving parts that create those results, especially cash flow, gross margin, and operating efficiency.
Diagnose Your Financial Blind Spots
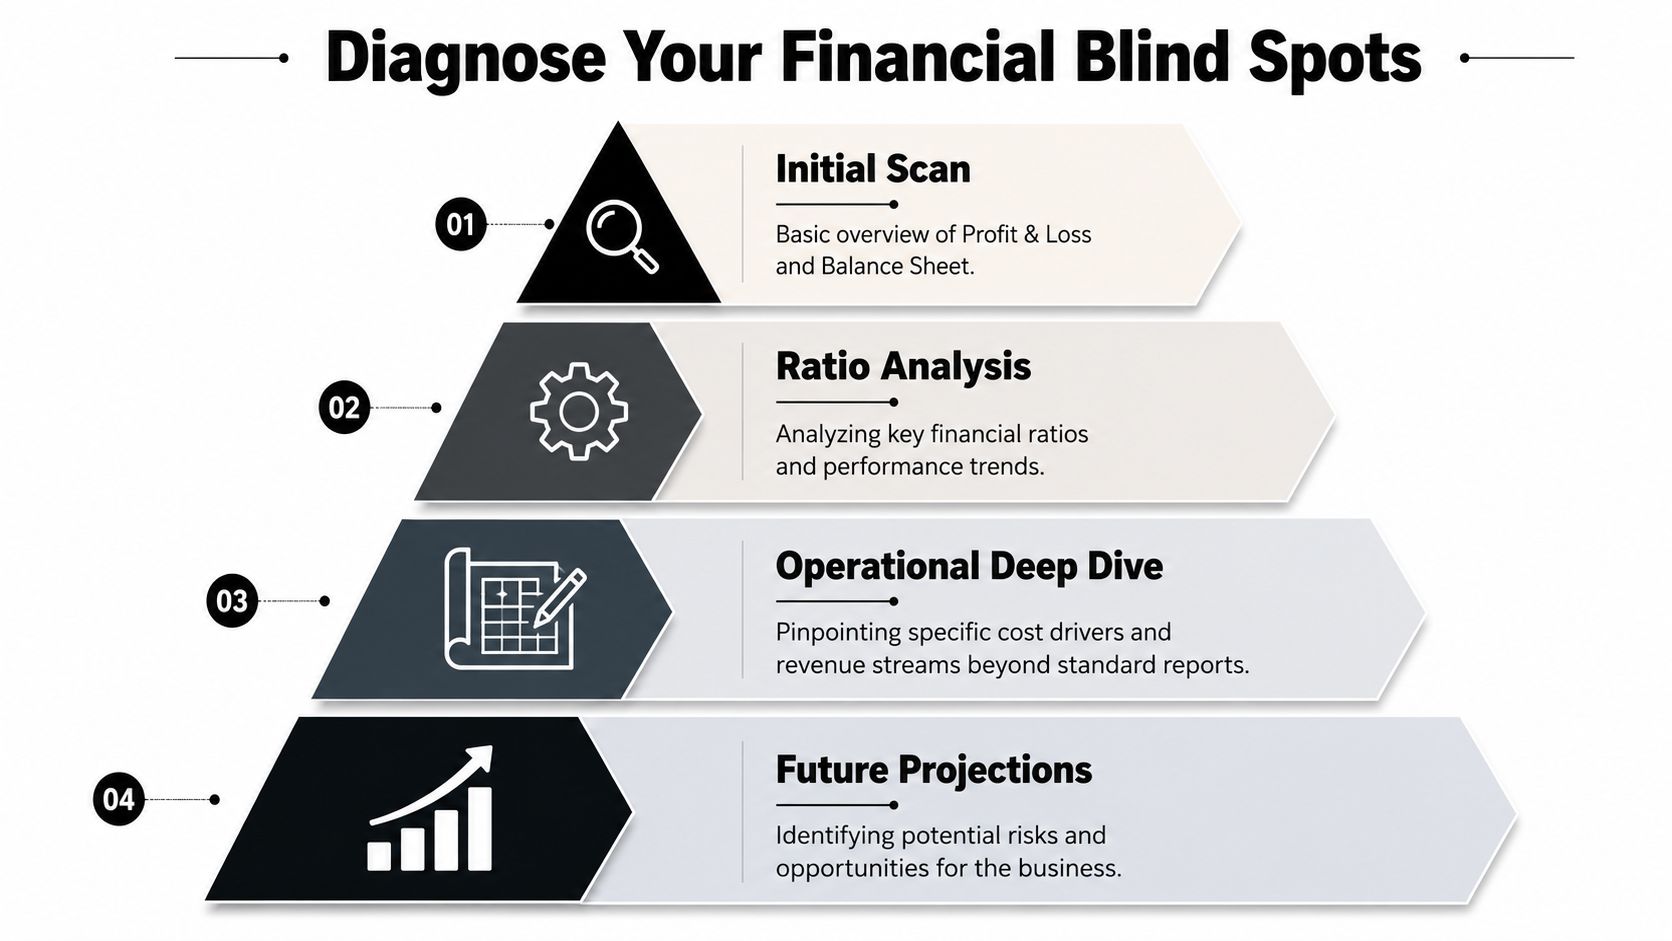
Most owners think they need better forecasting first. They don't. They need a cleaner diagnosis of what's already broken. A surface-level P&L can hide slow-paying customers, underpriced work, bloated overhead, and services that look busy but never throw off real cash.
Start with the reports, then go deeper
Your profit and loss statement tells you what happened at the summary level. That's useful, but not sufficient. The next layer is trend analysis on a few core accounts, because one month rarely means much, but a pattern over several periods tells you where the leak is.
Birmingham City University's 10-step guide makes the point well by combining customer feedback, reporting systems, and benchmarking against industry standards Birmingham City University. That mix matters because numbers alone can't tell you whether a weak margin comes from pricing, scope creep, or a service model that isn't built for scale.
Your books should answer three questions fast, what is changing, where is it changing, and who is causing the change.
What to examine first
For a construction company, I'd start with job costs, change orders, labor burden, and receivables aging. For distribution, look at product mix, inventory turnover, and customer concentration. For professional services, check utilization, realization, and client-level profitability.
The goal isn't to create a giant diagnostic binder. It's to identify the few line items that explain most of the pain. If overhead is creeping, if one customer cluster pays slowly, or if certain engagements consistently miss margin, you want that visible before it becomes normal.
Use a simple sequence
Begin with the balance sheet and cash position, then move to the P&L trend, then dig into the operating drivers behind those trends. After that, compare your numbers to your own history and to industry norms. That is where diagnosis happens, because you can finally separate one-off noise from structural weakness.
A good internal resource here is this financial metrics guide, which helps you avoid measuring too much and acting on too little. Once you've got the blind spots named, you can stop guessing about where the money is going.
Prioritize High-Impact Financial Levers
A long list of problems is not a plan. It's a distraction. Once you know where the leaks are, you need to choose the few moves that will change the outcome, and that usually means cash flow, gross margin, and forecast accuracy.

Pick the lever, not the project list
If cash is tight, don't start with a cosmetic reporting refresh. Start with the behavior that turns cash into a bottleneck. If margin is weak, don't launch five improvement workstreams. Fix pricing, scope discipline, or cost allocation first.
Decision rule: choose the initiative that improves a visible financial metric soon enough to fund the next move.
That's why short-term wins matter. If an initiative doesn't pay back in a reasonable window, it can consume management time without improving the business. The logic is simple, the earliest wins create breathing room, and breathing room buys you better decision-making later.
Match the lever to the business model
In construction, job costing accuracy is usually the highest-value lever because profit is won or lost inside each project. In distribution, inventory turnover and pricing discipline often matter more because slow-moving stock ties up cash and masks weak product economics. In professional services, client profitability is the lever because a busy team can still lose money if the wrong work keeps getting sold.
That's why a single “improvement plan” rarely works across all three industries. A reasonable matrix looks like this:
| Priority lens | Construction | Distribution | Professional Services |
|---|---|---|---|
| Fast cash impact | Tighten receivables and job billing | Reduce excess inventory and improve collections | Bill sooner and clean up work-in-progress |
| Margin impact | Improve estimate-to-actual accuracy | Fix product mix and discounting | Review client-level profitability |
| Forecast impact | Align project pipeline with labor capacity | Tie buying plans to demand | Tie staffing plans to booked work |
If you want a practical margin resource, this gross profit margin improvement guide is the right next stop.
Rank by return and ease
Don't overcomplicate the ranking. Ask two blunt questions. Will this move cash, margin, or forecast accuracy? Can we implement it without distracting the whole company?
If the answer to both is yes, it goes near the top. If the answer is no, it waits. That kind of discipline is what keeps owners from spending months on low-value fixes while significant financial leaks keep widening.
Implement Your 13-Week Cash Flow Model
Annual budgets are too blunt for the way owner-led businesses operate. Cash doesn't move in neat fiscal-year blocks, it moves on invoice timing, payroll cycles, vendor terms, and project milestones. That's why a 13-week cash flow model is essential if you want control instead of surprises.
What the model does
A 13-week cash flow model is a rolling forecast of your expected cash in and cash out over the next quarter. It gives you a forward view of whether you can cover payroll, vendors, tax payments, and debt service before the problem shows up in the bank account.
CPA Australia recommends documenting the activities required, assigning time frames, and building an implementation plan with a new budget plus profit-and-loss and cash-flow forecasts monitored monthly CPA Australia. That lines up with what I see in practice, because once cash is forecast weekly, your choices get much sharper.
Build it from the real drivers
Start with these inputs:
- Accounts receivable aging to estimate when money is coming in.
- Accounts payable to know when cash goes out.
- Payroll schedule because labor is usually one of the least forgiving outflows.
- Projected sales and billing timing so you don't confuse booked work with collected cash.
- Debt payments and taxes so those obligations don't catch you flat-footed.
Then roll the forecast across 13 weeks, and update it every week with actuals. Don't make it pretty. Make it useful.
If you can't explain the weekly cash swing in one sentence, the model isn't finished yet.
How to use it in the real world
In construction, the model shows whether progress billing and retainage are creating a cash pinch long before the next draw. In distribution, it reveals whether inventory buys are outrunning collections. In professional services, it flags the gap between completed work and billed work.
A simple spreadsheet is enough at first. What matters is that you can see the next few weeks clearly enough to decide whether to pull receivables forward, slow spending, or delay capital outlays. For a deeper walkthrough, this 13-week cash flow resource is a practical reference.
If you also want a plain-language article on cash behavior before making an operational move, this Managing cash flow before selling your route piece is worth a look because the discipline is the same, know your inflows before you commit the outflows.
A quick way to think about it
Your weekly cash view should answer only one question, are we getting better or worse? If the answer is worse, you act now, not after month-end closes. That's the point of the model, it turns cash from a surprise into a managed variable.
Drive Profitability with Granular Analysis and KPIs
At $10 million to $100 million in revenue, profitability rarely shows up in the top-line average. It shows up job by job, customer by customer, product line by product line, and service line by service line. If you do not measure it at that level, your strong work is subsidizing weak work, and the business looks healthier than it is.
Measure margin where the money is made
Job-level margin analysis belongs in construction because every project has its own labor efficiency, material cost, and change-order pattern. In distribution, product-line margin does the same job, because some items drive volume while others drive profit. In professional services, client profitability shows you which relationships deserve more attention and which ones need tighter scope control.
A busy team can still be a losing team. If the client mix is wrong or the work is priced badly, the business underperforms even while everyone looks occupied. A clear dashboard exposes that fast.
Keep the KPI set small
Keep the KPI list tight. For most owners, the right starting point is four to six KPIs. A practical set includes gross profit margin, cash runway, accounts receivable days, and revenue growth rate. If you have employees, track productivity too. If you sell products, add inventory turnover. Xero and NetSuite both point to the same discipline, keep the dashboard focused on the measures that drive decisions.
A small KPI set should be easy to read and hard to ignore. You want a steady pulse on the business, not a spreadsheet that needs a translator.
| Industry | Key KPI 1 | Key KPI 2 | Key KPI 3 |
|---|---|---|---|
| Construction | Job margin | Cash runway | Accounts receivable days |
| Distribution | Gross profit margin | Inventory turnover | Revenue growth rate |
| Professional Services | Client profitability | Productivity | Gross profit margin |
For a practical way to compare plan to reality, use this budget vs actual variance analysis guide. Variance review is what turns KPI tracking into action instead of reporting.
Build the dashboard for action
Your dashboard should show what changed, what caused it, and what decision the owner or leadership team needs to make. If margin slipped, was it pricing, labor, or customer mix? If cash runway tightened, did collections slow or did spending rise?
The point is speed. You do not build a dashboard to impress people. You build it so you can decide faster, protect cash, and stop weak jobs, weak customers, or weak product lines from dragging down the rest of the business. That is when finance stops acting like a scorekeeper and starts doing its job as an operating tool.
Build a Financial Cadence to Measure and Win
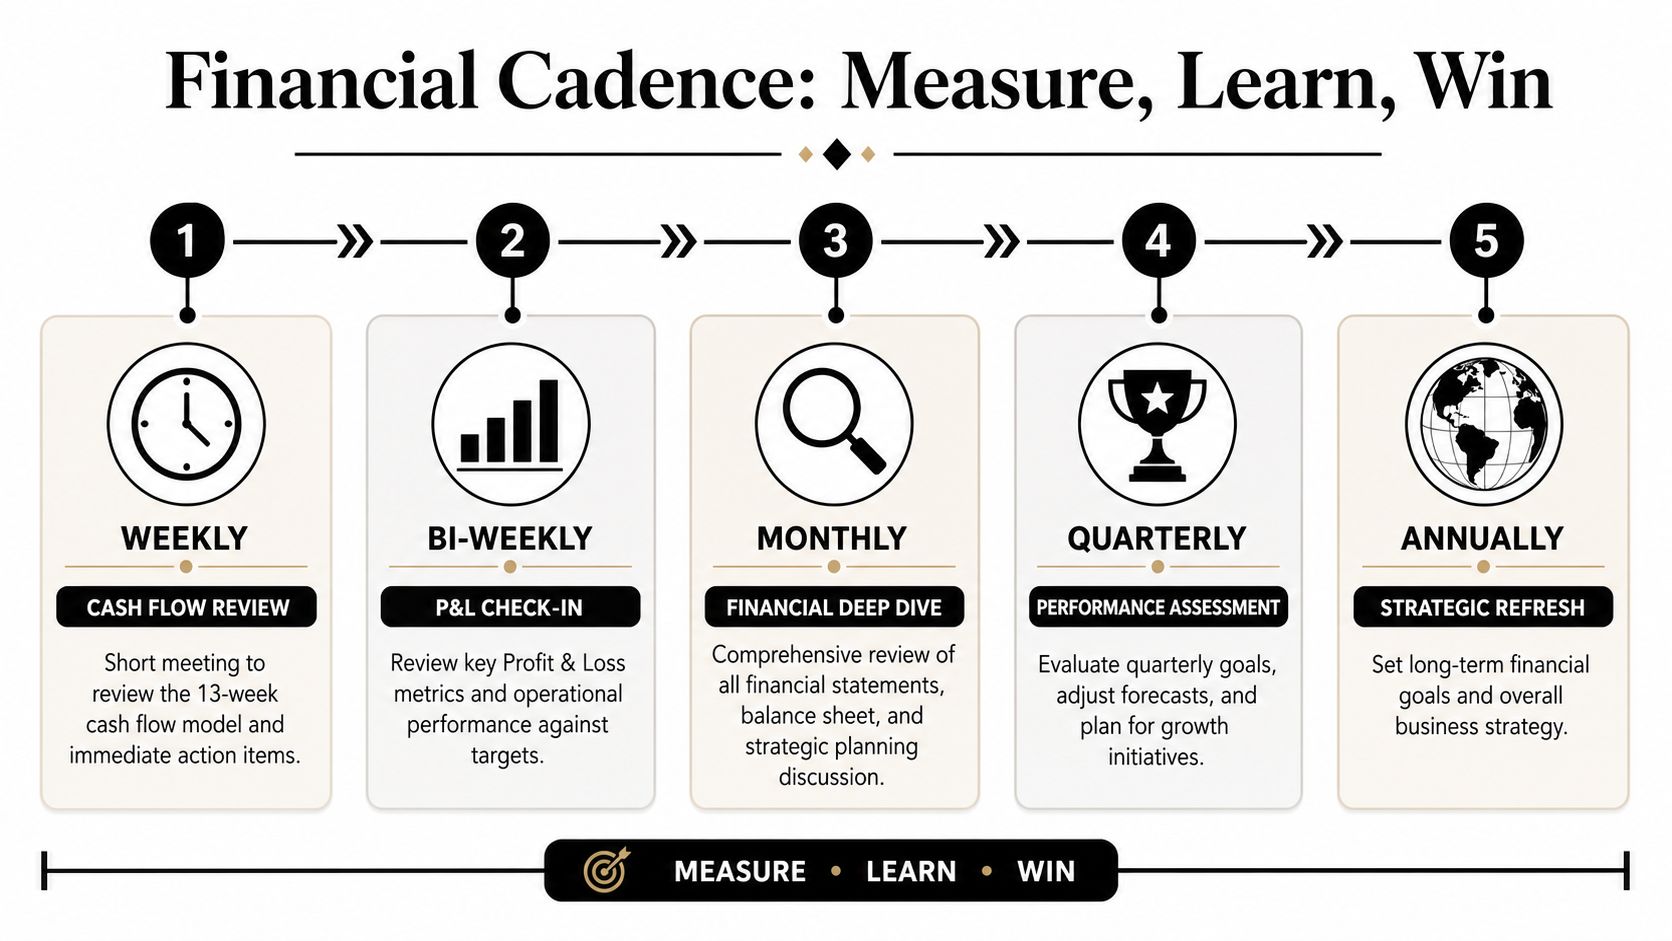
Tools don't improve a business by themselves. The rhythm around them does. If you want the gains to stick, you need a review cadence that keeps cash, margin, and forecast discipline in front of the leadership team on a regular basis.
Weekly, monthly, quarterly
Weekly should be a cash meeting. Review the 13-week cash flow model, collection risks, vendor payments, and any decisions that change next week's position.
Monthly should be a leadership finance review. Look at the KPI dashboard, the P&L, balance sheet movements, and any operating issues that changed the forecast. McKinsey notes that only two in five companies use both upward and downward evaluation in individual performance reviews, which shows how often feedback loops stay incomplete McKinsey. That's a warning sign for any owner who wants an agile system.
Practical rule: if a number changes and nobody owns the response, the meeting was just theater.
Quarterly is where you reset priorities. Recheck the targets, test whether the chosen initiatives are paying off, and decide whether the next lever should be cash, margin, or forecast accuracy. Annually is for strategy, but strategy only matters if the operating cadence underneath it is real.
Make the reviews specific
Use weekly meetings to decide. Use monthly meetings to learn. Use quarterly meetings to reallocate attention. That sequence builds accountability without turning finance into bureaucracy.
The right cadence also makes room for a fractional CFO when you need one. AmbitionCFO works with founder-led businesses in the $10M to $100M range and focuses on cash flow management, profitability improvement, financial forecasting, and margin analysis by job or client. If you're trying to build this kind of operating rhythm without hiring a full-time CFO, that model can be a practical fit.
Make the system hard to ignore
Put the weekly cash view on the calendar. Put the monthly KPI review in front of the leadership team. Put the quarterly reset in the same room as your growth plan. That's how business performance improvement turns into habit instead of a one-time project.
If you're ready to tighten the numbers, sharpen cash visibility, and build a financial operating system that fits your business, schedule a consultation with AmbitionCFO and get a practical plan for the next 90 days.