

Value drivers are specific, measurable, and controllable business levers that improve cash flow, reduce risk, and increase a company's exit valuation. The classic framework identifies seven drivers, including revenue growth, operating profit margin, tax rate, capital expenditure, working capital, cost of capital, and competitive advantage period.
You may be running a $10M to $100M construction, distribution, or professional services company and still feel unsure about what increases its worth. Revenue is growing, the team is busy, and customers keep calling, yet the valuation conversation stays frustratingly flat. That happens when owners focus on activity instead of the few operating decisions that materially change profit, cash generation, predictability, and buyer confidence.
A value driver isn't a vague goal such as “grow faster” or “improve culture.” It's a lever you can define, measure, influence, and connect to a financial result. Pricing discipline, job-level margins, inventory control, client retention, utilization, and management depth can all qualify when they have a clear cause-and-effect relationship with value.
Table of Contents
- Defining Value Drivers for Founder-Led Businesses
- The Evolution and Anatomy of a Value Driver Tree
- Financial, Operational, and Strategic Driver Categories
- Industry-Specific Value Drivers in Action
- Essential KPIs and Driver-Based Planning
- Practical Steps to Improve Your Key Drivers
- Next Steps for Your Exit and Valuation Strategy
Defining Value Drivers for Founder-Led Businesses
For a founder preparing a $10M to $100M exit, the useful question is not, “How do I grow revenue?” Ask instead: which operating levers will produce more durable cash flow, reduce buyer risk, and support a stronger valuation?
Revenue growth can consume cash, demand aggressive hiring, or conceal weaker margins. A construction, distribution, or professional services company can become larger while becoming less attractive if new work brings customer concentration, execution problems, working capital pressure, or unprofitable complexity.
A practical definition
A value driver must meet three tests:
- Specific: You can name the activity, such as price realization, billable utilization, inventory turns, or gross margin by project.
- Measurable: You can track it consistently in financial reports or operating dashboards.
- Controllable: Management can take direct action to improve it.
The third test matters most. Commodity prices, interest rates, and broad demand affect results, but management cannot set them directly. The controllable response may include contract language, pricing structure, purchasing discipline, staffing, or customer selection. Those responses become the practical drivers you can manage.
L.E.K. Consulting defines a useful value driver as a measurable, controllable lever with a material effect on business value, rather than a broad list of strategic themes. That standard fits founder-led companies because every initiative should connect to an operating result and a clear return on investment. L.E.K. Consulting's analysis of identifying and managing key value drivers offers a practical test for deciding whether a metric belongs in your value-creation plan.
Practical rule: If your team cannot explain how a metric changes profit, cash flow, risk, or buyer confidence, it is probably not a primary value driver.
Start with the exit outcome
Choose the financial outcome first. That may be EBITDA, free cash flow, return on invested capital, or enterprise value. Then work backward to the operating actions that influence it.
For a construction company, the chain may run from enterprise value to EBITDA, then to project gross margin, change-order discipline, labor productivity, and billing speed. For a distribution business, it may run through gross margin, inventory turns, purchasing discipline, and customer concentration. For a professional services firm, recurring revenue, client retention, utilization, pricing, and delivery capacity may drive the result.
Write down the financial outcome you want to improve. List the operating inputs connected to it, then keep only the inputs management can influence. That list forms the starting point for a value driver system.
The Evolution and Anatomy of a Value Driver Tree
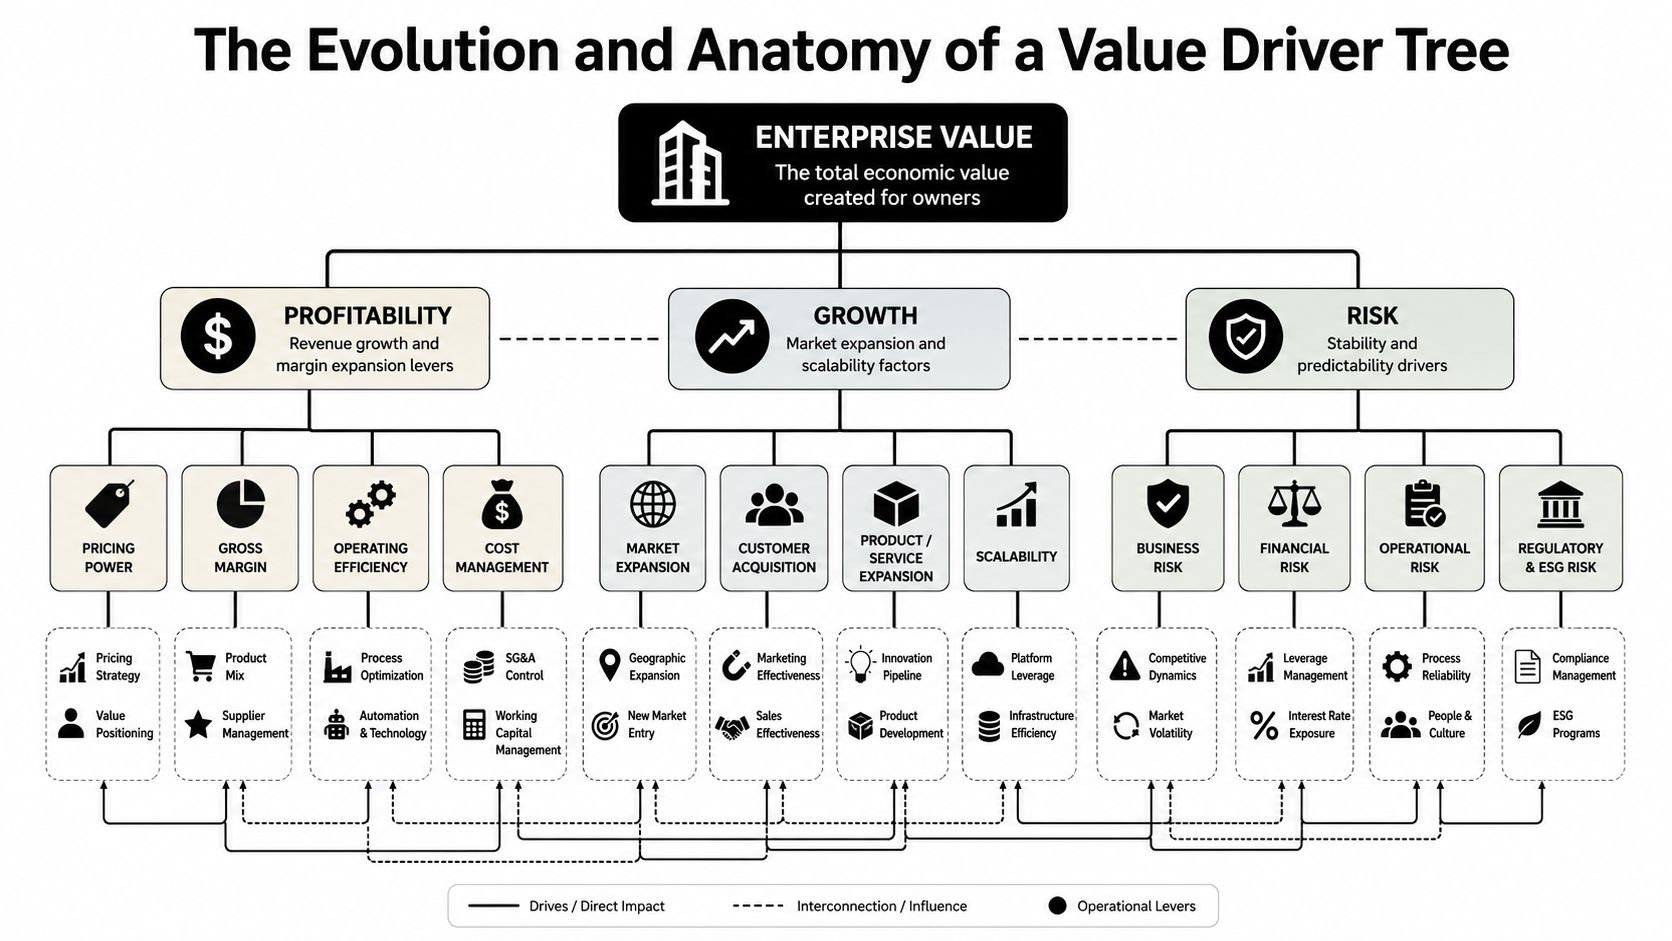
A founder-led contractor can report strong revenue while valuation stalls because margins vary by project, cash remains tied up in receivables, or the business depends on one owner. A value-driver tree exposes those connections. It turns valuation from a finance discussion into a management system for the controllable levers that matter in construction, distribution, and professional services.
Modern value-driver thinking began with a clearer view of how operating performance affects value. In 1938, John Burr Williams published The Theory of Investment Value and argued that a firm's value equals the present value of its future dividends. Williams' dividend-discount model gave analysts a rigorous reason to treat growth, profitability, and risk as the levers that move valuation. A historical overview of value drivers and corporate finance connects this foundation to modern discounted cash flow analysis.
In 1961, Modigliani and Miller sharpened the analysis by showing that, under perfect market assumptions, earning power and risk determine value rather than capital structure. In 1986, Alfred Rappaport's Creating Shareholder Value identified seven widely used value drivers: revenue growth rate, operating profit margin, income tax rate, incremental capital expenditure, working capital investment, cost of capital, and competitive advantage period. For a founder, the practical message is direct: improve the operating inputs that raise cash generation, reduce risk, or extend the period of defensible performance.
How the tree works
A value driver tree is a causal model. It connects a top-level outcome, such as enterprise value, EBITDA, ROIC, or free cash flow, to the operational inputs that influence it. This discussion of value-driver trees and causal performance models provides the structural basis for mapping those relationships.
Build the tree from top to bottom:
- Choose the outcome: Select enterprise value, EBITDA, or free cash flow.
- Separate the major branches: Organize the model around profitability, growth, and risk.
- Add financial drivers: Include revenue quality, margin profile, cash conversion, and customer concentration.
- Connect operational inputs: Map staffing, throughput, delivery performance, purchasing, systems, and capacity.
- Assign ownership: Give each controllable input an accountable leader and review cadence.
For a distributor, “free cash flow” may branch into operating profit and working capital. Working capital then branches into inventory management, supplier terms, order accuracy, and receivables collection. A construction company might trace EBITDA through project margin, change-order discipline, labor productivity, and billing speed. A professional services firm can connect value to recurring revenue, retention, utilization, pricing, and delivery capacity.
The tree earns its place in management meetings when every metric has a financial connection and an accountable owner. That discipline is more useful than a dashboard crowded with measures no one can act on.
Financial, Operational, and Strategic Driver Categories
A founder needs all three categories, but each answers a different management question. Financial drivers show whether the business produces attractive economics. Operational drivers explain how the team produces those economics. Strategic drivers determine whether competitors or buyers can easily replicate them.
| Category | Focus Area | Key Examples |
|---|---|---|
| Financial | Quality of earnings and cash generation | Revenue quality, margin profile, cash conversion, customer concentration, unit economics |
| Operational | Capacity, consistency, and execution | Scalability, throughput per FTE, on-time delivery, supply chain resilience, systems integration |
| Strategic | Durability and defensibility | Switching costs, intellectual property, category position, distribution advantages, regulatory barriers, brand trust |
Financial drivers
Financial drivers deserve priority because they translate directly into reported performance. Revenue quality matters more than top-line volume when customers renew, pay on time, and generate healthy contribution margins. Unit economics reveal whether each project, order, account, or engagement creates sufficient return after direct costs.
Cash conversion deserves special attention. A profitable company can still feel starved if receivables remain outstanding, inventory accumulates, or contract terms force the business to fund customers. Customer concentration also belongs in this category because dependence on a small number of accounts can make future cash flow less predictable.
Owners who need a deeper review of the expenses affecting profitability can use this guide to understand the factors affecting cost. The useful question isn't whether a cost is high. Ask whether it scales with revenue, supports a defensible capability, or reflects an avoidable process failure.
Operational drivers
Operational drivers turn financial intentions into repeatable execution. Throughput per FTE can show whether additional hiring expands capacity or merely offsets inefficiency. On-time delivery can affect customer retention, rework, penalties, and reputation. Systems integration can reduce manual handoffs and improve the quality of management information.
A construction firm may have strong demand but weak operational value if supervisors lack project visibility. A distributor may have excellent sales but poor value creation if warehouse errors, stockouts, and excess inventory absorb the cash generated by orders.
Strategic drivers
Strategic drivers create durability. Switching costs, specialized intellectual property, trusted distribution relationships, regulatory barriers, and brand trust can make revenue more defensible. Buyers care about these factors because they influence how long the company can preserve attractive economics.
Don't label every strength a strategic driver. It should protect future cash flow or reduce business risk in a way management can explain and support with evidence.
Industry-Specific Value Drivers in Action
The same value-driver framework produces different priorities across industries. A construction owner shouldn't copy a distributor's dashboard, and a professional services founder shouldn't manage capacity like a warehouse operator.

Construction
Consider a contractor with strong bookings but inconsistent project profitability. The primary driver isn't more sales. It's margin by job, supported by disciplined estimating, labor tracking, change-order management, and timely job-cost reporting.
Management should compare estimated and actual labor, materials, subcontractor costs, and overhead allocation throughout the project, not only after closeout. Working capital investment matters too. Slow billing, retainage, disputed changes, and weak collections can create a cash squeeze even when the income statement looks healthy.
A focused construction dashboard can include backlog quality, gross margin by job, cost-to-complete accuracy, billing cycle time, change-order capture, and receivables aging. Owners can use construction KPI guidance to structure that review around operational measures rather than broad activity counts.
Distribution
A distributor's growth can destroy value when inventory grows faster than demand or when service problems push customers toward competitors. The critical drivers are inventory discipline, purchasing accuracy, order fulfillment, supplier reliability, and customer-level profitability.
Management should separate inventory that supports dependable service from inventory that reflects poor forecasting or slow-moving stock. Supply chain resilience is a value driver when it protects delivery performance and customer retention. The right analysis connects product availability and warehouse execution to gross margin, working capital, and cash conversion.
A useful operating meeting might begin with exceptions: aged inventory, stockouts, supplier delays, pricing overrides, and orders that failed to meet promised delivery dates. Those exceptions point to controllable actions.
Professional services
A professional services firm creates value through productive capacity and durable client relationships. Utilization, realization, pricing, delivery quality, client concentration, and recurring revenue all deserve attention.
Suppose a firm is busy but margins are disappointing. The owner should examine whether highly paid staff spend time on low-value work, whether scope expands without billing, and whether pricing reflects specialized expertise. Client concentration can also create exit risk if one account represents a disproportionate share of revenue or referrals.
Recurring engagements, documented delivery processes, and a leadership team that can serve clients without constant founder intervention make cash flow more predictable. Those capabilities also demonstrate that the firm is an operating business, not a collection of the founder's personal relationships.
Use the following video as a practical prompt for discussing how operational choices translate into business value:
Essential KPIs and Driver-Based Planning
A KPI is a key performance indicator, a metric selected because it helps management make a decision. The goal isn't to track everything. The goal is to track the small set of measures that reveal whether your most important value drivers are improving.
Start with the financial outcome, then work down to the operating inputs. For example, free cash flow may depend on operating profit and working capital. Operating profit may depend on revenue quality, pricing, labor productivity, and direct cost control. Each lower-level measure should explain movement in the measure above it.
Build a planning hierarchy
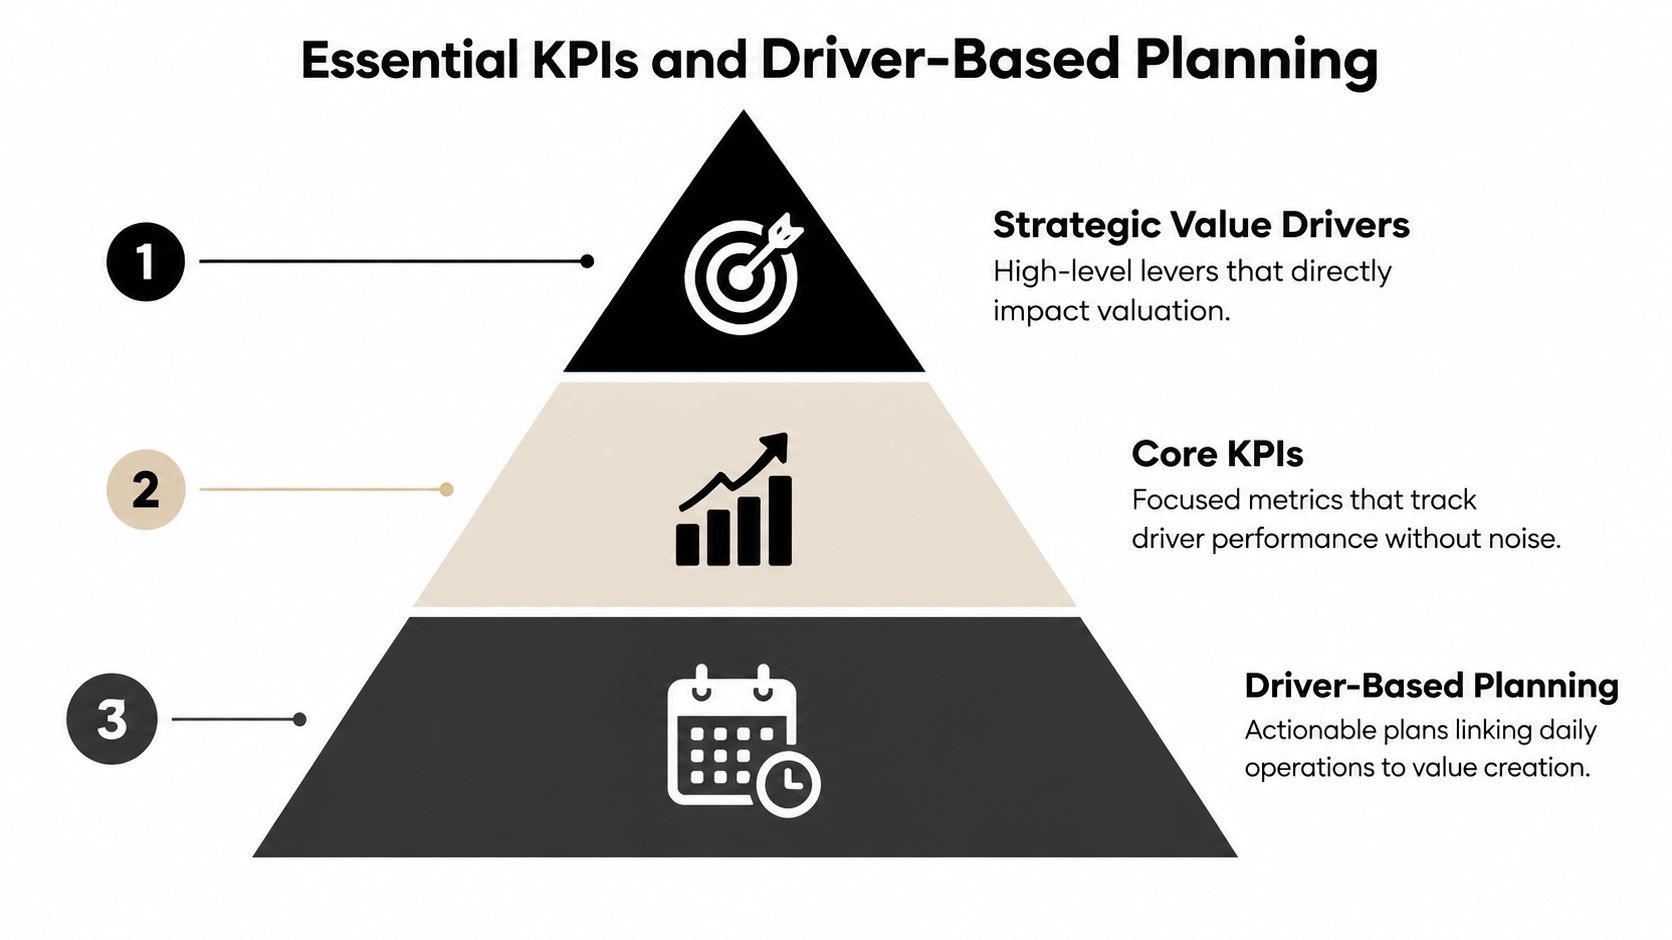
Driver-based planning connects operational assumptions to financial forecasts. KPMG describes a best-practice structure using cascading value-driver trees that combine internal inputs, such as FTE counts and average salaries, with external inputs, such as labor market conditions and inflation. KPMG's driver-based planning guidance shows why forecasts become more useful when leaders model the inputs that produce the results.
Build the hierarchy in this order:
- Strategic drivers: Identify the few levers that influence valuation, such as recurring revenue, margin durability, or customer diversification.
- Core KPIs: Select measures that show whether those levers are working, such as retention, utilization, gross margin, or delivery performance.
- Operating assumptions: Forecast headcount, salaries, capacity, pricing, purchasing, and demand conditions.
- Financial output: Translate those assumptions into revenue, profit, working capital, and cash flow.
The cash conversion cycle deserves a dedicated place on the dashboard. KPMG identifies it alongside growth rate and retention rate as a key value-creation KPI. The measure shows how quickly a company turns inventory and receivables into cash, making it a direct liquidity lever. KPMG's explanation of value-creation metrics can help your team frame the measure correctly.
Keep the dashboard decision-ready
A dashboard should answer what changed, why it changed, who owns the response, and what action comes next. For a broader explanation of KPI selection and interpretation, review the MyOfficeOps guide on key performance indicators. Then use a focused KPI dashboard design framework to keep reporting aligned with management decisions rather than presentation preferences.
Practical Steps to Improve Your Key Drivers
Owners waste time when they try to manage interest rates, commodity prices, or macro demand as if those variables were internal processes. You can monitor those conditions and plan around them, but your improvement program should target the responses you control. Pricing, contract terms, purchasing, staffing, collections, scheduling, and customer mix are actionable levers.
Use this sequence to turn the value-driver tree into an operating plan.
Identify the financial outcome. Choose EBITDA, free cash flow, or another top-level result. Don't begin with a long KPI list. Begin with the financial result that matters to your growth or exit plan.
Find the controllable causes. Trace the result backward. If margin is weak, examine price realization, labor productivity, scope control, purchasing, and customer or project mix. If cash is tight, examine billing speed, collections, inventory, deposits, and supplier terms.
Establish a baseline. Use consistent definitions and a reliable reporting period. Segment the analysis by job, client, branch, product family, salesperson, or service line when the aggregate number hides the problem.
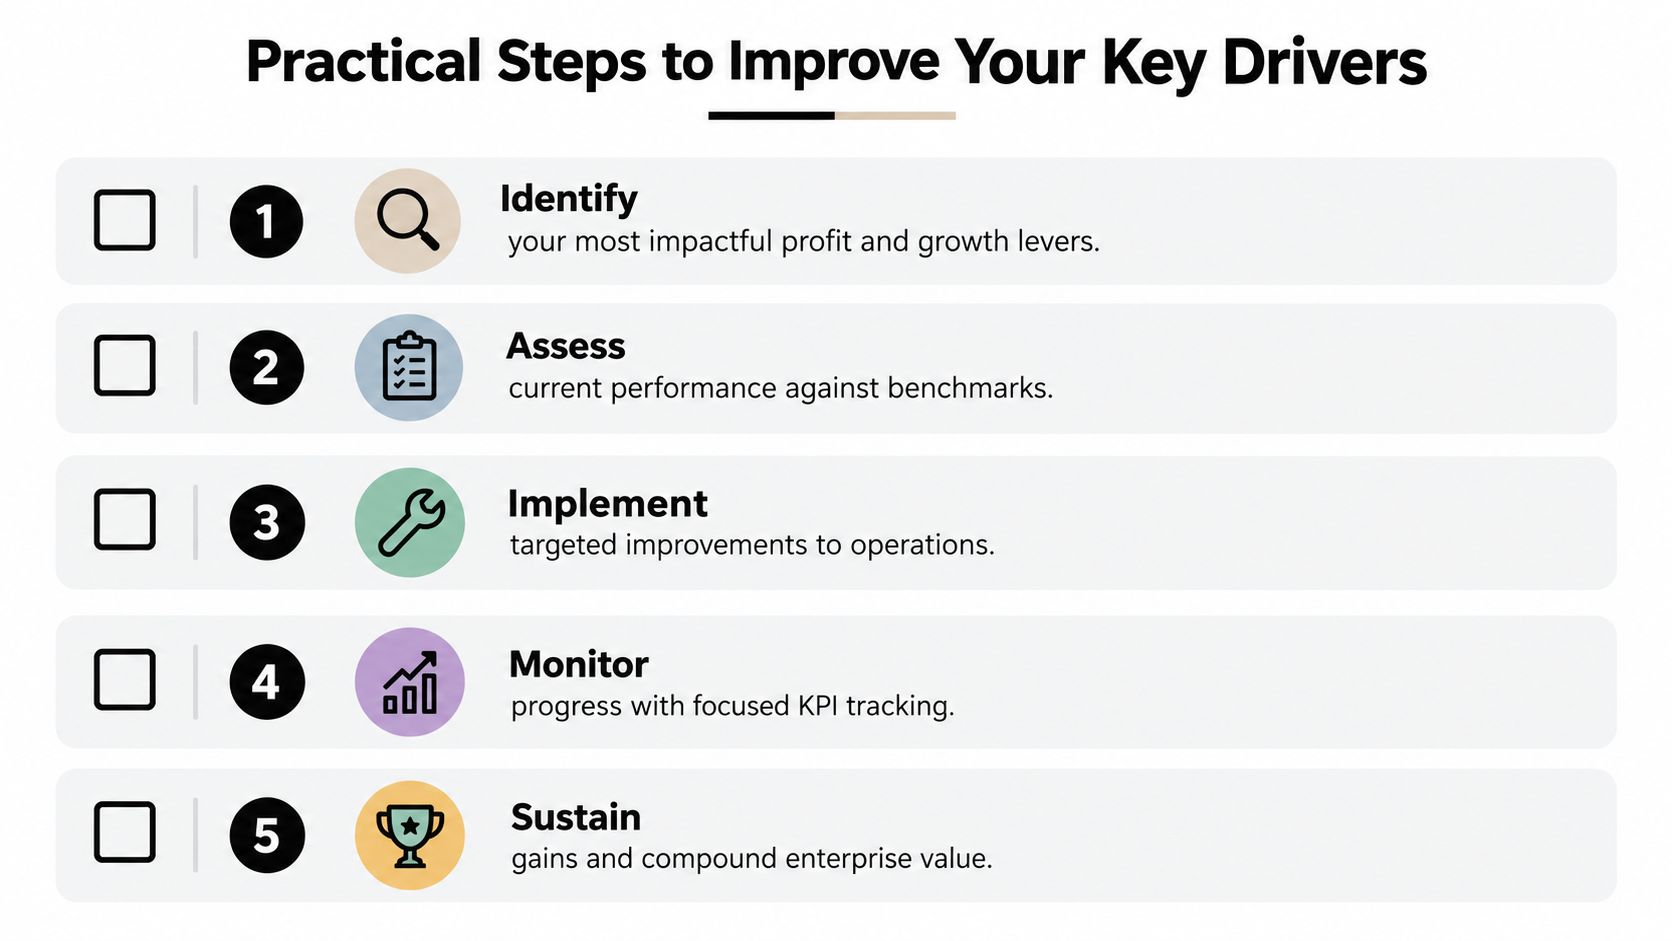
Model cash weekly. A 13-week cash flow model forces management to examine expected collections, payroll, vendor payments, taxes, debt service, capital spending, and other near-term commitments. The model is useful because it turns cash risk into a sequence of decisions, not a surprise at month-end.
Reprice and redesign weak economics. Review contracts and proposals that consistently miss margin. Add escalation language where appropriate, tighten scope definitions, require deposits or milestone billing when justified, and stop accepting work that consumes scarce capacity without an acceptable return.
Assign one owner to each driver. A finance report can identify a problem, but an operating leader must change the process. Set a review cadence and document the action taken when a KPI moves outside its acceptable range.
Protect the improvement. Update the budget, compensation logic, sales rules, purchasing controls, and operating procedures so the gain doesn't depend on one founder's memory.
This approach is consistent with a broader business performance improvement framework. The important point is sequencing. Don't launch a dozen initiatives. Select the few drivers with the clearest connection to profit, cash, and risk, then manage them relentlessly.
Next Steps for Your Exit and Valuation Strategy
Value creation becomes practical when you stop treating valuation as a distant transaction event. Your future buyer will evaluate the quality of earnings, cash conversion, customer relationships, operating systems, management depth, and the risks that could disrupt future performance. Those factors are built through ordinary decisions made long before a sale process begins.
Start with an audit:
- Review your dashboard: Remove metrics that don't drive decisions.
- Select three controllable levers: Choose the drivers with the strongest connection to cash flow, profit, or risk reduction.
- Map ownership: Assign an executive and a recurring review process to each driver.
- Document the evidence: Keep forecasts, margin analyses, process improvements, and KPI trends organized.
- Stress-test the plan: Examine what happens if demand softens, a major customer leaves, costs rise, or a key employee exits.
A company's value is not a number produced by a valuation exercise. It reflects the durability and predictability of future cash flows, the strength of the operating model, and the confidence a buyer has in the leadership team. This overview of the value of a private company is useful when you're connecting daily financial management to long-term ownership goals.
For owners planning a transition within the next three to ten years, a fractional CFO can help build the forecasting, reporting, cash-flow discipline, KPI structure, and Certified Exit Planning process needed to make those drivers visible and manageable. You don't need to wait until a buyer appears to discover that the business depends too heavily on you, one customer, or one favorable market condition.
AmbitionCFO provides fractional CFO support for founder-led businesses, including 13-week cash flow modeling, margin analysis by job or client, forecasting, KPI dashboards, and Certified Exit Planning. Visit AmbitionCFO to discuss your top three controllable value drivers and build a practical plan for increasing business value.