

The bank balance looks fine, the project manager wants a fast answer, and the P&L you're holding is already stale. That's the moment where a lot of founder-led firms make an expensive mistake, they treat finance as reporting instead of decision support, and they say yes to a contract, a hire, or a piece of equipment without a current model behind it.
Data analytics for finance fixes that gap. In modern practice, finance has moved from periodic manual review toward continuous, software-driven analysis of large datasets, with the core modes of descriptive, diagnostic, predictive, and prescriptive analytics shaping how owners read numbers and act on them (Reply on data analytics in finance).
Table of Contents
- The Tuesday Morning Decision Most Founders Get Wrong
- What Data Analytics for Finance Means
- The Five Use Cases That Move Real Money
- Data Sources, Metrics, and the Minimum Architecture
- How It Looks in Construction, Distribution, and Professional Services
- A 30, 90, and 365-Day Implementation Roadmap
- Common Pitfalls That Kill Analytics Programs
- Embedding Fractional CFO Support and Your Next Step
The Tuesday Morning Decision Most Founders Get Wrong
A construction owner I've worked around had the same problem so many operators do. The bank feed said cash was okay, the month-end P&L was still waiting on cleanup, and a project manager was pushing for a quick yes on a six-figure excavator because “we'll need it next month anyway.”
That is a timing problem in the finance process.
Practical rule: if the number is older than the decision, it is decoration, not management.
The weak point is usually not intelligence. It is timing. Founder-led companies often have plenty of operational data scattered across the accounting system, payroll, banking, CRM, and job-costing files, but the owner still has to make a call before the finance team finishes assembling the story. Backward-looking reporting keeps breaking down in practice, even when the books are technically accurate, because the decision has already moved on by the time the report lands.
Data analytics for finance closes that gap by answering four questions in order. What happened. Why it happened. What is likely next. What should we do about it. If your current dashboard cannot help you choose between buying equipment, delaying a hire, or renegotiating a contract, it is not analytics yet, it is a prettier version of a report.
The shift is mental. Finance stops being the place where numbers go to be filed, and becomes the place where decisions get pressure-tested before money leaves the account. For a $10M to $100M operator, that is the difference between reacting to a surprise and steering around it.
What Data Analytics for Finance Means
A founder signs off on a hire, a machine purchase, or a long customer contract long before the month-end package is finished. Finance analytics matters because it gives that person a current view of what is happening now, not a tidy explanation after the decision is already locked in.
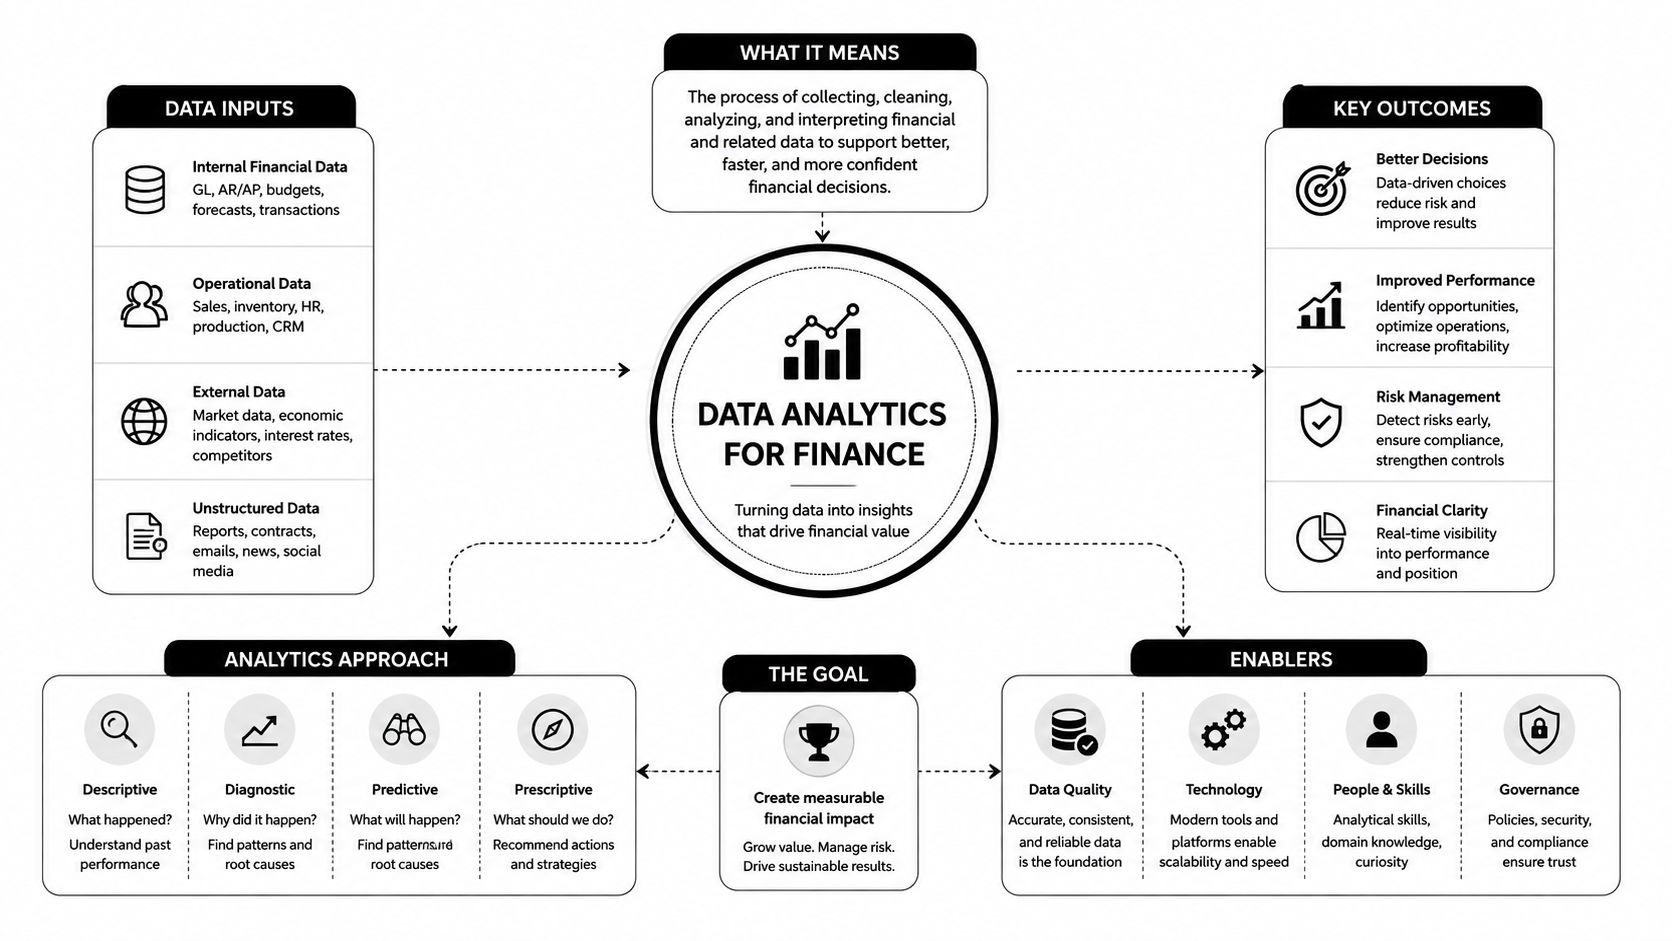
In practice, descriptive analytics shows what happened, diagnostic analytics shows why it happened, predictive analytics shows what is likely next, and prescriptive analytics shows what action fits the situation. That structure helps an owner sort every report by the decision it supports, instead of by the tool that generated it.
| Mode | Owner Question | Typical Report | Example Output |
|---|---|---|---|
| Descriptive | What happened? | P&L, cash summary, KPI dashboard | Last month's gross margin |
| Diagnostic | Why did it happen? | Variance analysis, job report, customer mix review | Which project drove the margin miss |
| Predictive | What happens next? | Forecast, cash model, trend view | Next quarter's cash position |
| Prescriptive | What should we do? | Scenario comparison, decision memo | Delay a hire, accept a contract, or renegotiate terms |
A useful external reference on payment analytics is Suby's analytics best practices, especially if you want to connect transaction patterns to customer behavior instead of staring at isolated reports. The value is practical, the analysis should point to the next move, not just summarize the last one.
For founders, this framework works best alongside the broader set of metrics covered in the financial metrics every business owner should track. I would rather see a short list that gets reviewed every week than a long dashboard nobody opens. The point is not more charts. The point is knowing which chart belongs in which decision, and how it changes the call.
The Five Use Cases That Move Real Money
A founder does not need a shelf full of dashboards. They need a short list of decisions that show up in cash, margin, and staffing pressure, then a cadence that forces those numbers into the Monday meeting.
Cash, profit, and the weekly reality
A 13-week cash flow model is the fastest way to stop guessing about payroll, vendor payments, and loan covenants. It only changes behavior when it is refreshed from current bank data and reviewed on a weekly leadership rhythm. Left in a folder, it becomes decoration.
A job or client profitability analysis shows which work creates value and which work drains it. The version that changes decisions allocates payroll, materials, freight, subcontractors, and overhead in a consistent way. Fuzzy costing makes bad jobs look acceptable, which is how owners keep selling work that feels busy and still misses margin.
For founder-led firms, customer mix matters just as much as job mix. A customer profitability analysis can show whether a large account is worth the discounting, service load, and custom work it demands.
Forecasting, dashboards, and scenarios
A rolling forecast keeps the plan current as conditions shift. Instead of locking a budget once a year and hoping it survives contact with reality, the team updates the outlook as new sales, margin, or labor signals come in. That keeps hiring, pricing, and spending tied to what is happening.
A KPI dashboard should be short enough that the CEO opens it on Monday morning. If it has too many tiles, it turns into wallpaper. Nobody remembers which metric deserves a management meeting, and the team stops trusting the screen.
A scenario analysis turns a capital decision into a clearer choice. The useful version runs a base case, a downside case, and an aggressive case before the owner signs for equipment, adds headcount, or accepts a long contract. That matters because the core trade-off is usually speed against flexibility, not just yes or no.
The best way to use the framework is to start with the pain point that is already costing money. If cash is tight, start with the weekly model. If margin is leaking, start with job or customer profitability. If the business is growing faster than the planning process, start with forecasting and scenarios.
The most valuable analytics output is the one that changes a yes or no before the money moves.
Data Sources, Metrics, and the Minimum Architecture
Most analytics failures start with fragmentation, not sophistication. The owner has QuickBooks or Sage on one side, payroll on another, bank portals in a second browser tab, CRM notes in someone's inbox, and job-costing detail in spreadsheets only one person understands. The issue is not a lack of data. It is that nobody trusts the same version of it.
The World Bank and IFC handbook on digital financial services emphasizes that effective analytics starts with transactional and operational records, then moves through simple statistical analysis, correlations, and process changes rather than jumping straight to fancy models (World Bank and IFC handbook). That order fits founder-led firms too, because finance teams need reliable inputs before they can argue about interpretation.
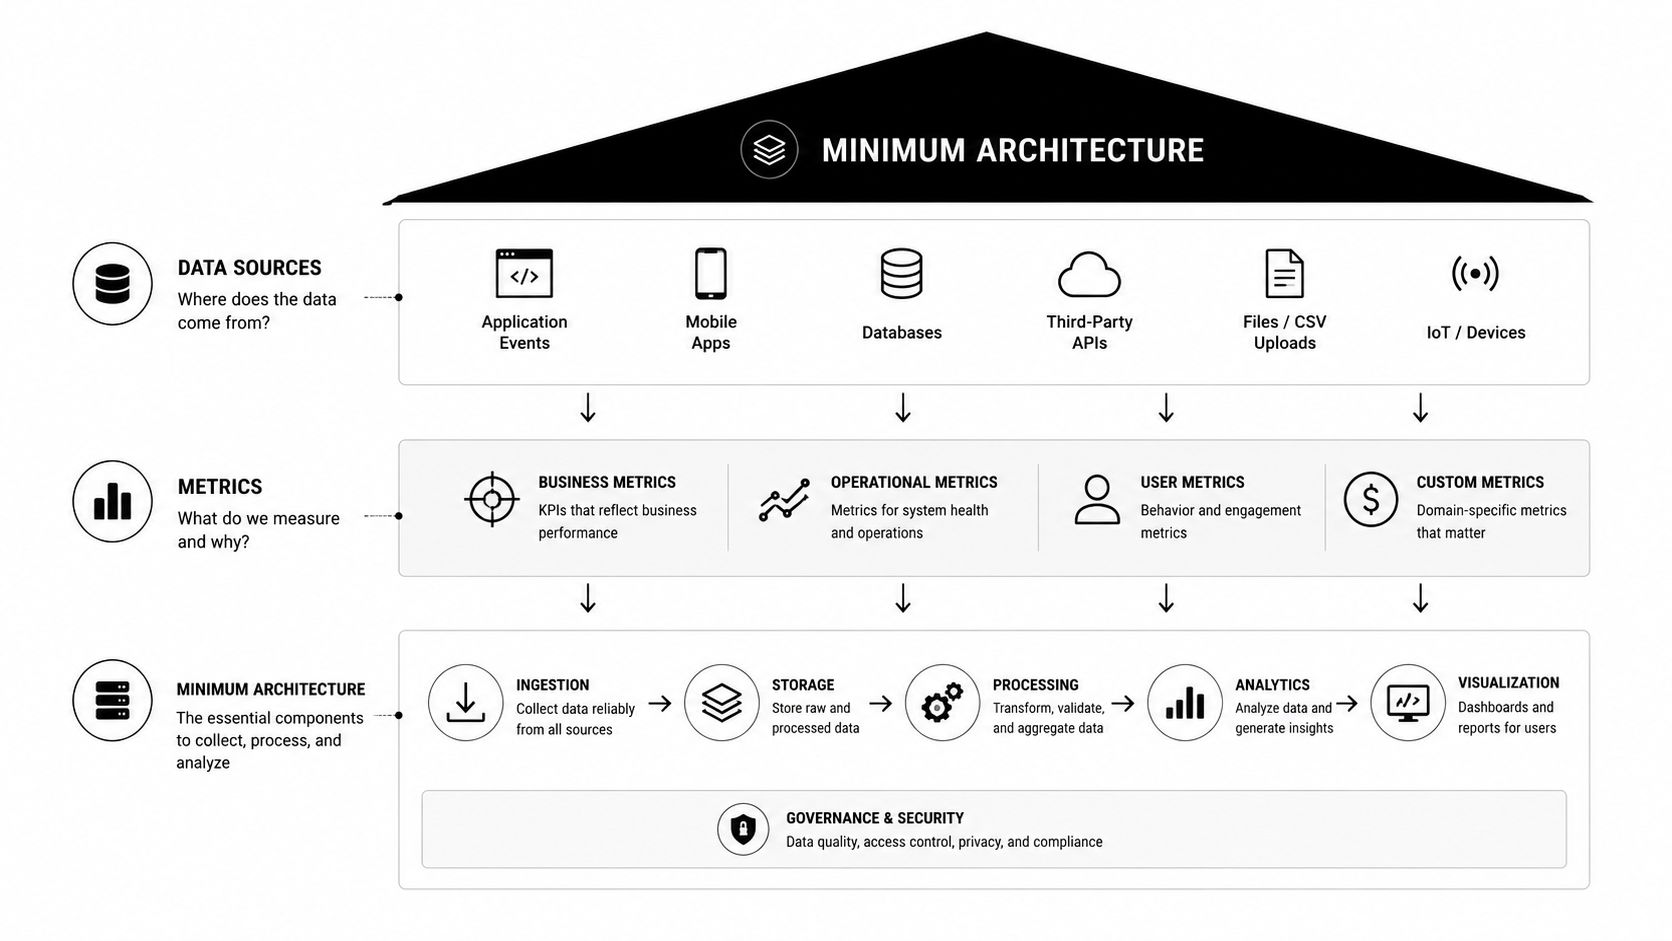
A minimum architecture is surprisingly modest. You need a clean chart of accounts, a path to extract data from each source system, a single reporting layer, and a metric dictionary that defines terms like gross margin, utilization, or backlog the same way every time. The European Banking Authority frames big-data and advanced analytics around four pillars, including data management and technological infrastructure, which is a useful reminder that governance comes before glamor (EBA report on big data and advanced analytics).
If the finance team cannot define the numbers cleanly, the dashboard becomes theater. Owners end up debating whose spreadsheet is right instead of deciding whether to hire, buy, or hold.
A practical starting point is the reporting discipline around the numbers themselves. Clear definitions, named owners, and a consistent close process matter more than adding another layer of software. A good reference point for that operating discipline is this guide to financial reporting best practices.
Alternative data can help, but only when it maps to the operating cycle. Payment traces, POS data, peer-to-peer transfers, loan repayments, and bill payments can reveal liquidity behavior more directly than static statements, yet they still need validation against actual outcomes. More data is not automatically better. A cleaner data model usually beats a fancier model with messy inputs.
If you want a practical benchmark, one implementation guide says extraction freshness should be checked against the source system's last-modified date, and any gap of more than 24 hours means the data is stale (Improvado financial data analysis guide). That is the kind of rule a controller can enforce.
How It Looks in Construction, Distribution, and Professional Services
Construction, distribution, and professional services all use the same finance logic, but they feel different on the ground. The operating questions change, which means the dashboard should change too.
Construction
A contractor lives or dies by job margin, retainage, and work-in-progress exposure. When analytics is working, the owner can spot which job types consistently run negative and which crews keep creating change-order friction, then decide whether to price differently, reject certain work, or tighten estimating discipline. For a deeper look at the metrics that matter, see construction KPIs.
Distribution
A distributor needs to know which SKU and customer combinations are worth serving. Inventory turn matters, freight leakage matters, and so does the cost of promising too much service to low-margin accounts. The best analytics setup doesn't just tell the owner that revenue is up, it shows whether the revenue is buying profit or just tying up cash in the warehouse.
Professional services
A services firm has a different problem. Utilization, realization, and recurring revenue concentration are the signals that matter most. If a few clients drive most of the profit, the owner needs to know that before renewal season, not after a margin dip shows up in the annual review.
For customer-level detail, customer profitability analysis is usually where the conversation gets real. That's where owners stop asking, “Are we busy?” and start asking, “Are we busy with the right work?”
These industries don't need the same dashboard, but they do need the same discipline. The numbers have to tie to a live operating decision, or the reporting ends up ignored.
A 30, 90, and 365-Day Implementation Roadmap
The fastest way to improve analytics is to stop treating it like a transformation project. Build it in layers, tied to decisions the team already makes.
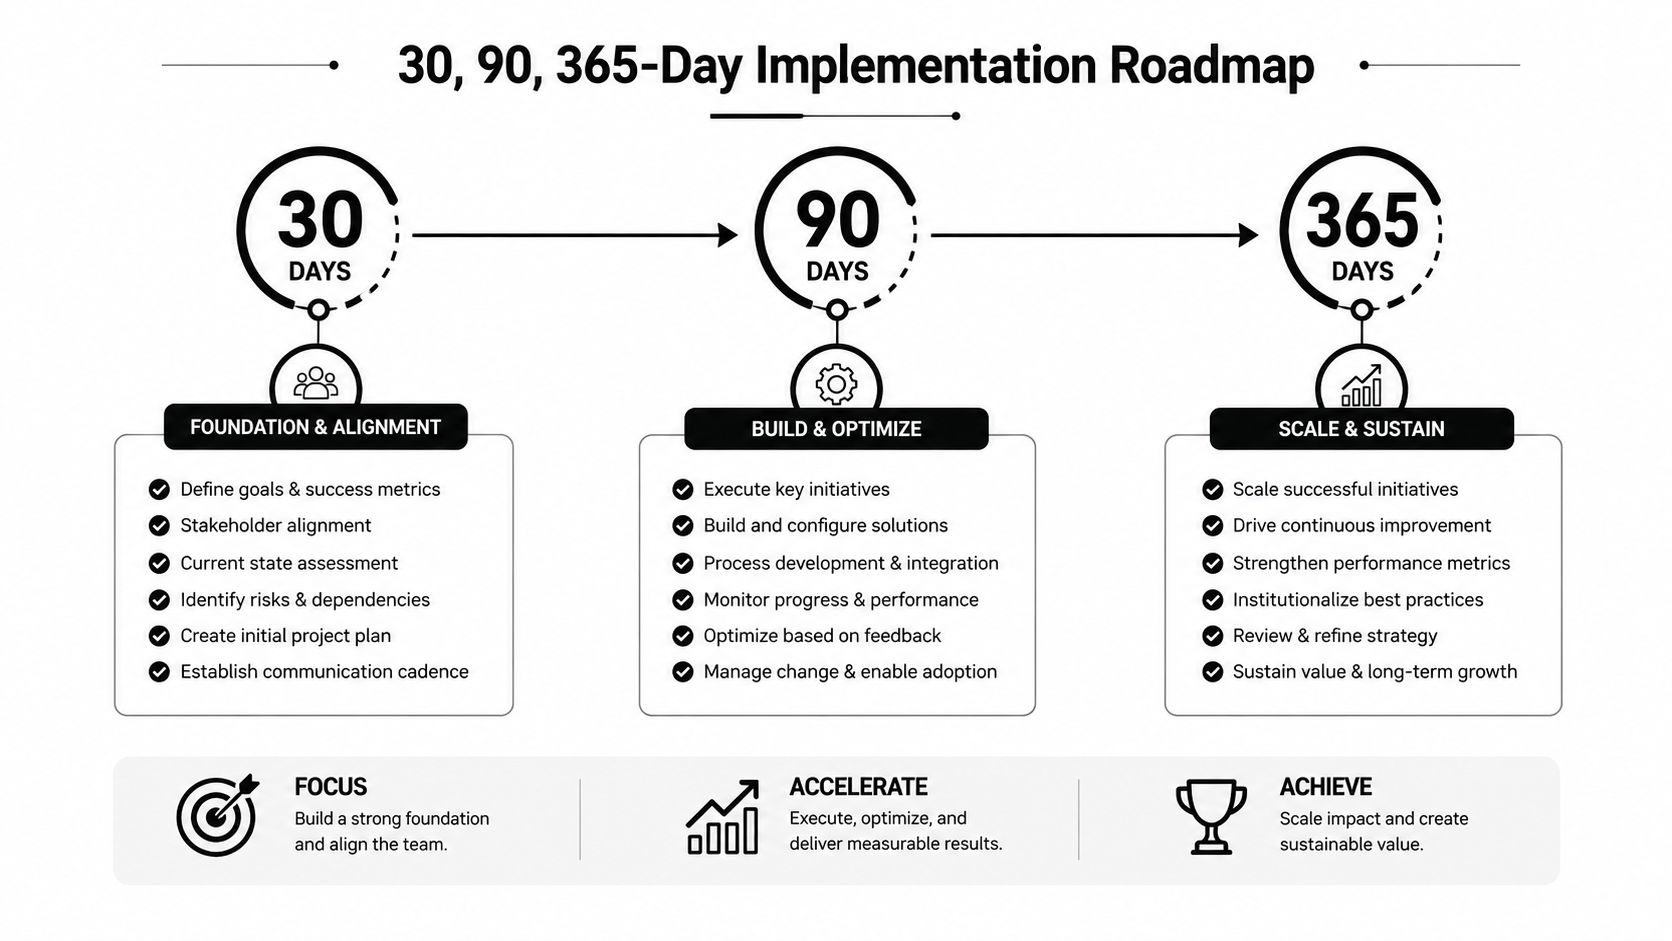
In the first 30 days, clean the chart of accounts, pull a weekly cash snapshot into one place, and add one operational KPI to the leadership meeting. That KPI might be days sales outstanding, job margin variance, or backlog coverage, but it should be one metric the owner will ask about.
By 90 days, the focus should shift to working tools. Build the 13-week cash flow model, launch a KPI dashboard with five to seven metrics, and run a scenario analysis before the next capital decision. The job here isn't perfection, it's usable cadence.
Over 365 days, the goal is governance. Define data ownership, document the metric dictionary, automate the key extracts, and lock in a monthly finance review. This is also where a fractional CFO becomes the connective tissue between reporting and decisions, because someone has to own the cadence when the business gets busy.
A simple sequence helps:
- First, stabilize cash visibility. Weekly beats monthly when decisions are happening in real time.
- Then, narrow the metric set. Too many numbers dilute focus.
- Finally, automate the repeats. Manual exports are fine for a short sprint, not for permanent management.
Owners don't need a grand rebuild. They need a process the team can keep using when the quarter gets messy.
Common Pitfalls That Kill Analytics Programs
Most analytics programs fail because the team treats reporting like a deliverable instead of a decision system. A dashboard can look polished and still sit unused if it is not tied to a real owner, a real meeting, and a real choice.
The first failure is building screens nobody opens. A dashboard needs a named owner and a recurring slot on the leadership calendar, or it becomes background noise. If it does not show up in a weekly or monthly cadence, it will not change how the business runs.
The second failure is metric drift. If no one has written down what gross margin, utilization, or backlog means, the report turns into a debate instead of a working tool. A one-page metric dictionary keeps the team aligned and keeps finance from re-litigating the same definitions every month.
The third failure is stale data. Feeds that are more than 24 hours old deserve a clear warning, because leaders will make faster decisions on the wrong picture if the numbers look current but are not. That is one reason Improvado financial data analysis guide matters in practice, even if the underlying issue is usually process, not software.
The fourth failure is running scenarios that never lead to a call. A scenario only has value when the team writes down a we will or we will not decision after reviewing it. Without that discipline, the spreadsheet becomes a performance instead of a management tool.
The fifth failure is ignoring the model when judgment disagrees. The answer is not to treat the model like a substitute for leadership. The answer is to record the override reason in the same system so the company can see where judgment added value and where it overruled the math.
For a practical governance lens, 10 strategic governance tips is a useful companion read for teams trying to keep reporting honest without turning the process into bureaucracy.
Embedding Fractional CFO Support and Your Next Step
A finance stack only changes behavior when a senior person owns the decision cadence. A controller can close the books. A bookkeeper can keep the records clean. Neither role is built to sit with the owner and say, based on this margin trend, we should delay the hire, or based on this cash path, we should renegotiate vendor terms now.
Fractional CFO support fits founder-led firms that have outgrown basic accounting but do not need a full-time CFO yet. The right engagement sits in the leadership team, runs the weekly cash meeting, owns the KPI cadence, and pressure-tests capital, hiring, and contract decisions before they turn into expensive mistakes.
The value shows up fast when you connect it to the earlier use cases. The weekly cash model needs a decision owner. The job profitability analysis needs someone who can turn margin leakage into pricing changes. The forecast and scenario work need a chairperson who keeps the team from drifting back into gut feel. If you are evaluating whether that gap exists in your business, fractional CFO for startups is a useful place to start thinking about the operating model, even if your company is already well past startup stage.
For owners weighing a larger data investment, it also helps to see how a senior finance leader frames the case. A strong enterprise data platform ROI pitch lands when it ties directly to decision quality, governance, and the operating cadence. It misses when it promises abstract modernization.
This week, pull together your current cash report, your most important KPI, and the last major decision you made without a model. Then map each one to the question it answered, what happened, why, what is next, or what should we do. The biggest opportunity is usually obvious once you see which decision is still being made by instinct alone.
If you want help turning finance data into a weekly decision system, AmbitionCFO works directly with founder-led operators to build cash flow visibility, margin insight, forecasting discipline, and board-ready reporting. Visit AmbitionCFO to see how a fractional CFO can help you move from backward-looking reports to better Tuesday morning decisions.