

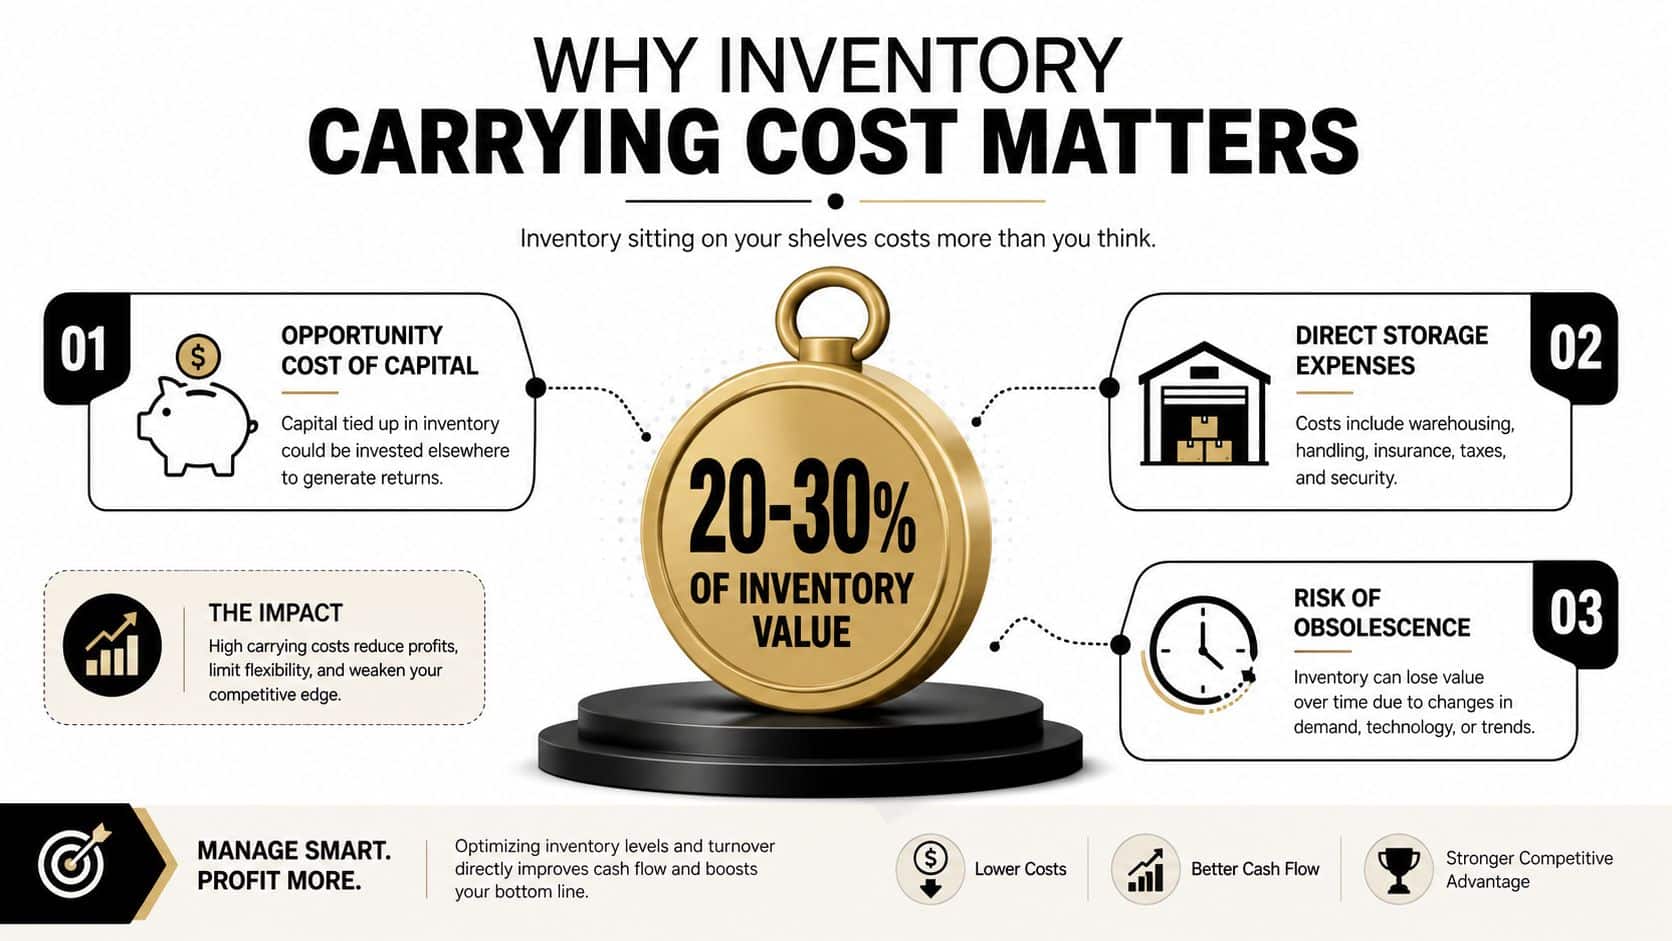
The inventory carrying cost formula is Annual Holding Costs ÷ Average Inventory Value, and for most operators it runs 20% to 30% per year. That means a $500,000 stock balance burns about $100,000 to $150,000 a year just to sit there.
If you're trying to answer one question, it's this, how much cash is inventory stealing from the business right now, and is that cash buying you enough service level to justify the cost? That's the job of the formula, not a classroom exercise, because the answer affects pricing, purchasing, and whether you can afford the next hire or machine.
Table of Contents
- Why the Inventory Carrying Cost Formula Matters for Your Business
- Breaking Down the Formula and Its Four Cost Buckets
- Step-by-Step Worked Example for a Construction Business
- How the Formula Looks in Distribution and Professional Services
- When a Higher Carrying Cost Is the Smart Move
- Using Carrying Cost to Drive Cash Flow, Pricing, and Capital Decisions
- Tactics to Reduce Carrying Cost and How AmbitionCFO Can Help
Why the Inventory Carrying Cost Formula Matters for Your Business
A $500,000 inventory balance at a 20% to 30% carrying-cost rate drains roughly $100,000 to $150,000 a year. That is cash leaving the business while stock sits on shelves, in bins, or in a warehouse. The point is simple, inventory is a use of capital, and founders need to treat it like one.
The question you are really answering is simple, how much does each dollar of stock cost you over the year, and what should you do about it this quarter? If you know that number, you can decide whether to order less, negotiate better terms, shift storage, or deliberately hold more stock because the service payoff is worth it. Without it, you are guessing with working capital, and that usually means too much cash trapped in the wrong items.
The better way to use this formula is as a cash-flow control tool. Carrying cost should be measured against average inventory value, not ending inventory, because average stock shows the capital tied up across the year, not just on one reporting date. That makes the metric useful for comparing product lines, warehouses, and time periods without getting fooled by one lucky month-end snapshot. Owners should track the handful of numbers that drive action, and AmbitionCFO's financial metrics guide makes the same point clearly.
A single blended rate is useful, but it is not enough if you want a real decision. Break carrying cost down by SKU, by project, and by warehouse, then compare it with the margin you lose when you run out of stock. That is how you decide whether a slow-moving item deserves less shelf space, whether a project should carry more material up front, or whether a warehouse needs a tighter reorder policy. If you need a cleaner inventory control system before you do that analysis, use the inventory management software guide.
Practical rule: if inventory is large enough to stress payroll, borrowing, or expansion plans, you need this number before quarter-end, not after year-end close.
The rest of the article shows how the rate is built, why the denominator matters, and when holding more inventory is the smarter move. If you run a founder-led business, this formula tells you whether stock is supporting growth or draining cash.
Breaking Down the Formula and Its Four Cost Buckets
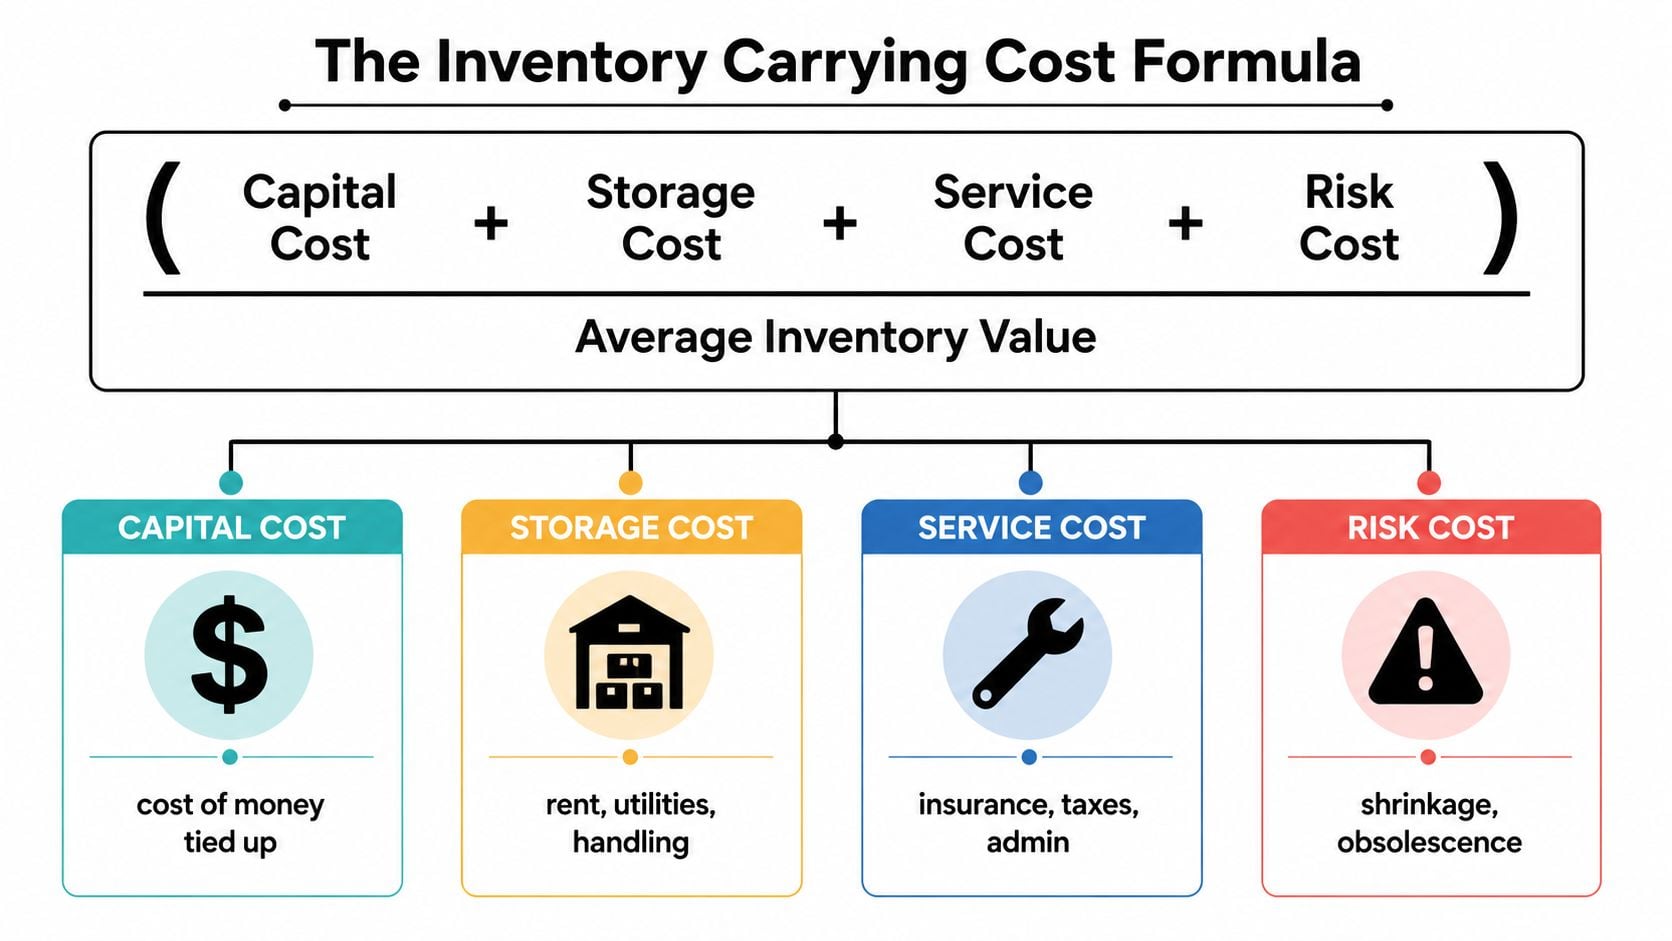
The inventory carrying cost formula gives you a clean decision tool. Add every annual cost of holding stock, then divide by average inventory value. That ratio strips the noise out of inventory spending and lets you compare SKUs, warehouses, and projects on the same basis. The four buckets that usually sit in the numerator are capital, storage, service, and risk.
Capital cost is the cost of money tied up in stock instead of being used elsewhere in the business. If that cash is sitting on a shelf, it is not funding payroll, equipment, marketing, or debt reduction. Owners feel this bucket fast because it shows up in cash flow and borrowing pressure.
The right way to size it is straightforward. Look at the inventory balance on the books and ask what that money could earn or save if it were deployed somewhere else. If inventory is financed with a line of credit, the financing expense is visible. If it is funded with cash, the opportunity cost still exists, even if no lender has sent a bill.
Storage cost covers the physical cost of keeping stock on hand. Rent, utilities, handling labor, equipment, racking, and space all belong here. In a business with more than one location, this bucket can change quickly because one warehouse may be efficient while another burns expensive square footage.
QuickBooks or your ERP may not label these costs cleanly, so pull them from facility expenses, warehouse payroll, and third-party storage invoices. If your warehouse team spends more time moving slow product than shipping fast product, the storage bucket is probably bigger than you think. For help choosing software that gives you better visibility into those inputs, the inventory management software guide from Wistec is a useful place to compare features.
Service cost covers insurance, taxes, administration, and the labor required to track stock. In many businesses, accounting and operations overlap here, because the cost includes the premium or tax bill plus the time spent counting, reconciling, and managing inventory records. When the team keeps fixing bad counts, this bucket grows.
Map it by pulling stock insurance, any property-related inventory taxes, and the admin labor tied to inventory control. If your inventory feeds specific jobs or projects, connect this bucket to the broader project P&L with AmbitionCFO's job order costing guide. That keeps the inventory number tied to the job economics, not a generic overhead pool.
Risk cost is the loss from shrinkage, obsolescence, damage, and markdowns. Owners undercount this bucket because the loss often shows up later, after the item stops moving. If you carry seasonal, project-specific, or fast-changing product, this bucket deserves real attention.
If a SKU turns slow and then dead, the carrying cost is not just storage. It is the margin you never got back.
Do not guess at one blended percentage and stop there. Pull each bucket once, build the numerator clearly, and you will know which lever matters most in your business. The infographic below lays out the formula visually: An infographic showing the inventory carrying cost formula composed of capital, storage, service, and risk costs.
Step-by-Step Worked Example for a Construction Business
A construction company should not use a single month-end snapshot and call it a carrying-cost analysis. Job timing swings inventory up and down, so the better move is to use a quarterly average and judge the rate by SKU, by project, and by warehouse. That gives you the number that matters, the cash tied to the materials sitting in your own system.
A spreadsheet-ready build
Start with average inventory value, not year-end stock. In this example, materials build up during active job phases and fall during slower periods, so the quarterly average gives the cleaner read. Then list every annual holding cost line item, tie each one to a real account, and total the result. If you need a clean way to connect materials to the right job, pair this with AmbitionCFO's construction job costing guide.
| Cost Bucket | Annual Amount | Cell Formula Example |
|---|---|---|
| Capital cost | $225,000 | =Average Inventory Value*Rate |
| Storage cost | $42,000 | =Warehouse Rent+Utilities+Handling |
| Service cost | $31,000 | =Insurance+Inventory Taxes+Admin Labor |
| Risk cost | $18,500 | =Shrinkage+Obsolescence+Damage |
| Total holding costs | $316,500 | =SUM(B2:B5) |
If average inventory is $1,100,000, then the carrying-cost rate is $316,500 ÷ $1,100,000 = 28.8%. That sits inside the benchmark range discussed by NetSuite, but the number only matters if it tells you where cash is getting trapped and whether that cash is earning its keep in the business. The decision is whether to trim stock, reassign materials by project, or keep the buffer because it protects schedule and margin. NetSuite's benchmark discussion
Use these formulas in Excel or Google Sheets:
- Average inventory value.
=(Beginning Inventory + Ending Inventory)/2 - Total annual holding costs.
=SUM(all holding cost lines) - Carrying cost percentage.
=Total Annual Holding Costs/Average Inventory Value - Cost per job check.
=Allocated Carrying Cost/Number of Active Jobs
The job-cost check matters because construction owners buy materials to finish profitable work, not to let cash sit on a shelf. Run the carrying cost against each project if you want a decision you can act on this quarter. A slow-moving bundle of fixtures, lumber, or specialty parts is a cash decision, not just an inventory line.
If the inventory supports a job that protects margin or schedule, keep it. If it does not, that cash belongs back in the business. For a cleaner read on the financing side of materials and equipment, see equipment depreciation and financing tips.
How the Formula Looks in Distribution and Professional Services
Distribution and professional services do not carry inventory costs in the same way. In distribution, the formula is driven by product held for resale, so storage and capital usually do the most damage. In professional services, the inventory base is smaller, but admin, insurance, shrink, and control effort can still look heavy because they are spread across a thinner base.
Distribution versus professional services
A distributor should expect the inventory carrying cost formula to lean hard on storage and capital. More SKUs mean more bins, more touches, more space, and more cash trapped in working stock. That does not automatically mean the business is inefficient. It means the owner has to judge the rate against turns, margin, and warehouse use, not against a generic benchmark.
A professional services firm with spare parts, supplies, or field materials usually sees a different pattern. The inventory base is smaller, so even modest control costs can look large as a percentage of inventory value. The result can be a rate that looks inflated, not because the business is broken, but because the denominator is thin.
| Business type | Dominant buckets | What it means |
|---|---|---|
| Distribution | Storage, capital | Inventory decisions should target turns and space use |
| Professional services | Service, risk | Inventory decisions should target control, loss prevention, and admin efficiency |
The range between 15% and 30% appears in business references as a typical annual band, but that does not mean every company should chase the midpoint. The useful question is whether the mix of costs reflects the way the business operates. A distribution company with a crowded warehouse and slow turns should expect one result. A service firm carrying parts for field work should expect another.
If the rate looks high in distribution, start with the warehouse. Space, handling, and capital tied to broad SKU counts usually set the tone. If the rate looks high in professional services, start with control processes, loss prevention, and the amount of staff time spent keeping small stock clean and traceable. That is where the cash is leaking.
The same thinking applies to owned equipment. Just as inventory ties up cash, owned assets consume capital long before they generate revenue. See the equipment depreciation and financing tips from Noreast Capital Corporation for a parallel framework. The point is the same in both cases, capital has a carrying cost whether the asset is sitting in a warehouse or bolted to the floor.
When a Higher Carrying Cost Is the Smart Move
Lower carrying cost is not always the right goal. If a stockout costs more than the inventory you're holding, a higher carrying cost is the correct trade. Owners get this wrong when they chase a prettier percentage instead of the profit at risk.
The comparison is carrying cost versus lost margin, expedite fees, and project delays. If a strategic SKU costs $90,000 to carry but a stockout would wipe out $140,000 in margin and rush shipping, the inventory is earning its keep. Cut it too far and you move pain from the balance sheet to the income statement.
Decide by SKU or by project, not by instinct
At the SKU level, ask three questions. How often does the item drive a sale or a job? What happens if it is unavailable for a week? What does a missed sale, delay, or backorder cost in cash?
At the project level, use the same test. Does the material protect schedule certainty, avoid overtime, or prevent an expensive substitution? If the answer is yes, the carrying cost can justify itself because the alternative is more expensive.
Decision rule: hold more inventory when the economic cost of being out of stock is higher than the annual cost of holding it.
The old 20% to 30% benchmark can mislead owners. The Assembly's inventory carrying cost discussion makes the broader point that the rate should be compared against stockout economics, not treated like a universal target. That is the right standard for growth-stage operators in construction and distribution, where lead times and service expectations can change quickly.
For a practical framework on setting reorder points that balance carrying cost against stockout risk, the reorder point UK guide 2026 from Packaging Panda is a helpful reference. Use it to set a floor for replenishment decisions, then pressure-test that floor against the margin you lose if the shelf goes empty.
Rank the inventory that matters. Do not optimize every SKU equally. Protect the items that defend margin, customer retention, or project completion, and let the low-value clutter get leaner.
Using Carrying Cost to Drive Cash Flow, Pricing, and Capital Decisions
If you're running a business in the $10M to $100M range, carrying cost should feed three decisions right away, cash, price, and capital. A 13-week cash flow forecast is the best place to start because every extra dollar trapped in inventory is a dollar not available for payroll, debt service, or the next draw. AmbitionCFO's liquidity management guide is relevant because inventory is one of the fastest ways cash gets trapped without anybody noticing.
Use the number as a floor, not a report
Carrying cost also sets a floor on pricing and job margin. If a product line or project requires you to hold inventory for a long time, the margin has to absorb that cost. Otherwise, the work can look fine on the income statement and still drain cash.
It should also gate capital and hiring decisions. If a new contract, machine, or location requires materially more inventory, ask whether the expected gross profit justifies the capital locked in stock. If it doesn't, the expansion may be profitable on paper and bad for liquidity.
If an investment ties up more inventory than the gross profit it's expected to generate, the cash math doesn't work even when the P&L looks acceptable.
Three practical levers belong in your next leadership meeting.
- Tighten purchasing logic so buys track actual demand instead of habit.
- Reprice slow movers so carrying cost is embedded in the floor, not ignored.
- Delay low-return expansion when the inventory requirement would strain liquidity.
The point isn't to obsess over inventory for its own sake. It's to make sure stock decisions are visible in the same dashboard as cash and margin. That's how owners stop approving growth that erodes flexibility.
Tactics to Reduce Carrying Cost and How AmbitionCFO Can Help
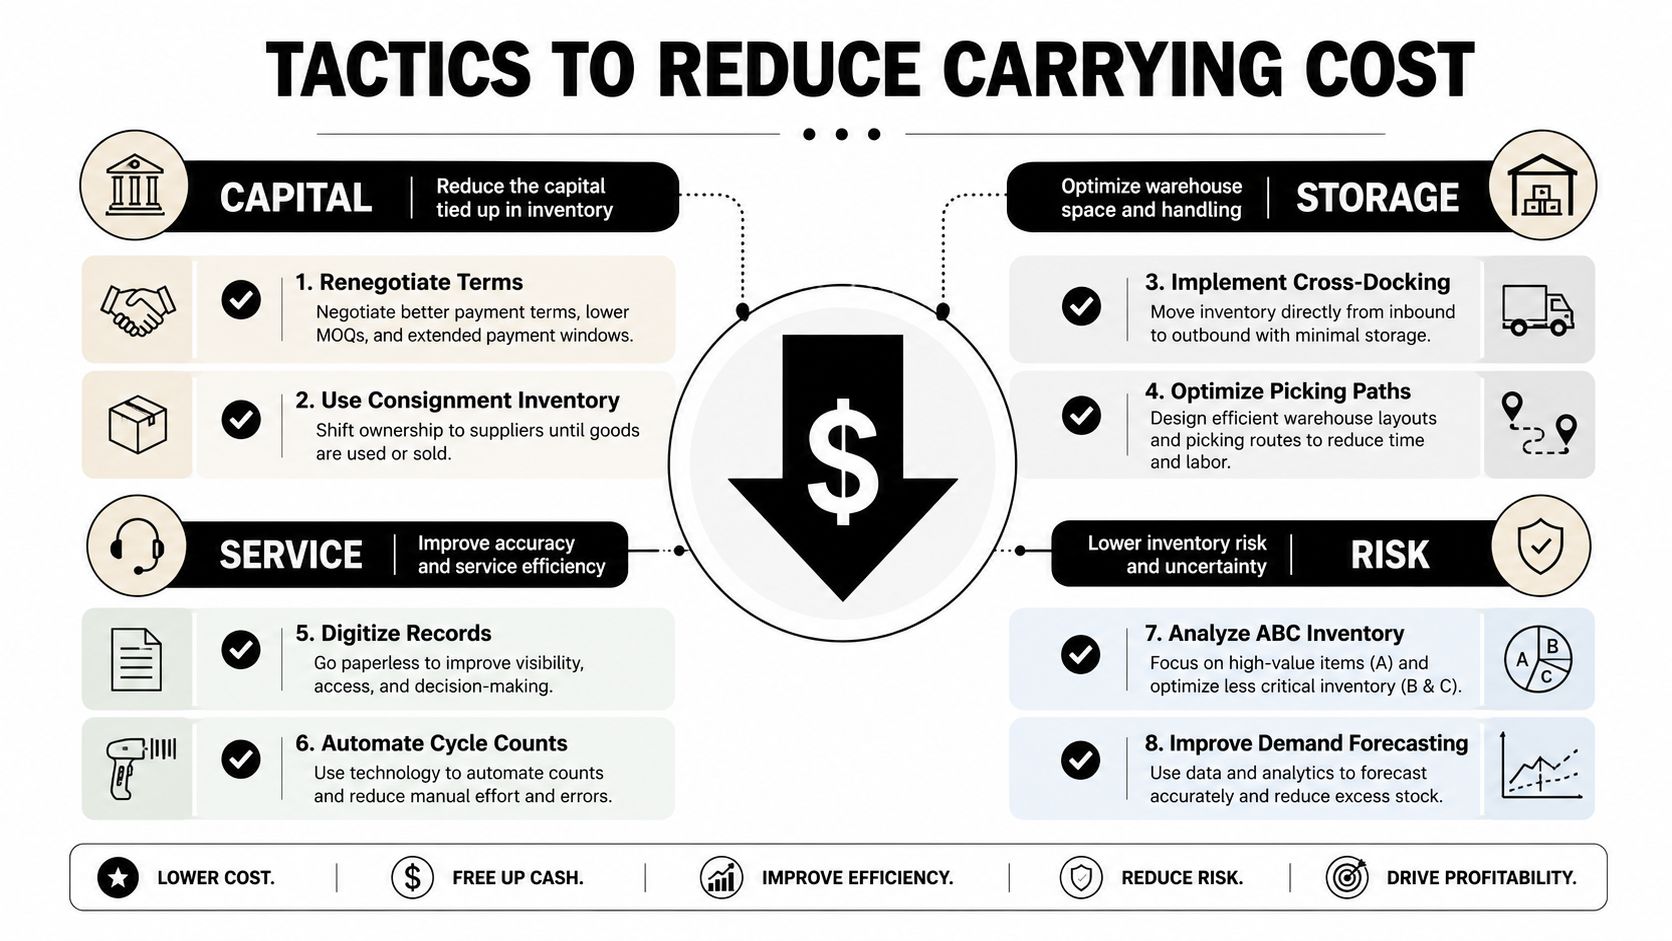
Start with the cost bucket that hurts most, then cut there first. If capital cost is the problem, renegotiate supplier terms or use consignment inventory. If storage is bloated, cross-dock faster and tighten picking paths. If service cost is excessive, digitize records and automate cycle counts. If risk is the drag, run ABC analysis and improve demand forecasting.
A strong reorder process matters too. If your reorder points are sloppy, inventory will drift up until cash feels tight, then drift down until stockouts hit. For a practical framework on that process, the reorder point UK guide 2026 from Packaging Panda is a helpful reference because it puts replenishment timing in operational terms.
Here's the checklist I'd use first:
- Renegotiate terms to reduce capital tied up in supplier stock.
- Use consignment inventory where the vendor can carry part of the burden.
- Implement cross-docking to reduce storage time and warehouse touches.
- Optimize picking paths so labor doesn't get swallowed by movement.
- Digitize records to reduce service-cost errors and admin drag.
- Automate cycle counts to catch shrinkage before it becomes a write-off.
- Analyze ABC inventory so the most important SKUs get tighter control.
- Improve demand forecasting so purchasing follows actual consumption.
If you want this turned into a recurring operating rhythm, AmbitionCFO builds 13-week cash flow models, margin analysis by job or client, and KPI dashboards that put inventory in the same conversation as liquidity and profitability. We don't do bookkeeping, tax prep, audit work, business valuation, or fundraising support, and that's deliberate. The work is strategic, and it's meant for owners who need sharper decisions, not more spreadsheets.
If inventory feels like it's eating your cash, stop guessing and run the numbers against your cash flow and margin model. AmbitionCFO can help you plug in the inventory carrying cost formula, identify the bucket that's hurting most, and turn it into a practical plan for this quarter.