

You're in a meeting with a project manager, a lender, or your partner, and the model is open on your screen. The core question isn't whether the spreadsheet works, it's which lever you should trust before you commit cash, hire help, or sign a contract. That's where the difference between sensitivity analysis and scenario analysis matters, because one tells you which input moves the answer most, while the other tells you whether the whole plan still holds when several assumptions change together.
| Criterion | Sensitivity Analysis | Scenario Analysis |
|---|---|---|
| Core question | Which variable moves the result the most? | What happens if several conditions change at once? |
| Inputs changed | One input at a time | Multiple inputs together |
| Typical output | One- or two-variable data table, tornado chart | Base, bull, and bear cases |
| Best use | Isolating the biggest driver | Stress-testing a coherent future |
| Common trap | False confidence when inputs are correlated | Overbuilding stories that never get used |
| Best fit for owner decisions | Pricing, utilization, equipment, covenant sensitivity | Hiring, expansion, exit planning, multi-factor risk |
Table of Contents
- What Each Method Actually Does in a Financial Model
- Side by Side Comparison of Both Methods
- Running a Sensitivity Analysis Step by Step
- Building a Scenario Analysis That Survives a Board Meeting
- How the Two Methods Work Together and Where Inputs Correlate
- Decision Rules for Choosing the Right Method
- When Sensitivity Analysis Is the Better First Move
- Embedding Both Methods in Cash Flow and Exit Planning
What Each Method Actually Does in a Financial Model
A founder usually reaches for one of these tools after a very specific moment. The GC wants to add another superintendent, the distributor is weighing a second warehouse, or the professional services firm is deciding whether to raise rates for a long-term client. The model looks fine until someone asks, “What breaks first?” That is the point where the method matters more than the label.
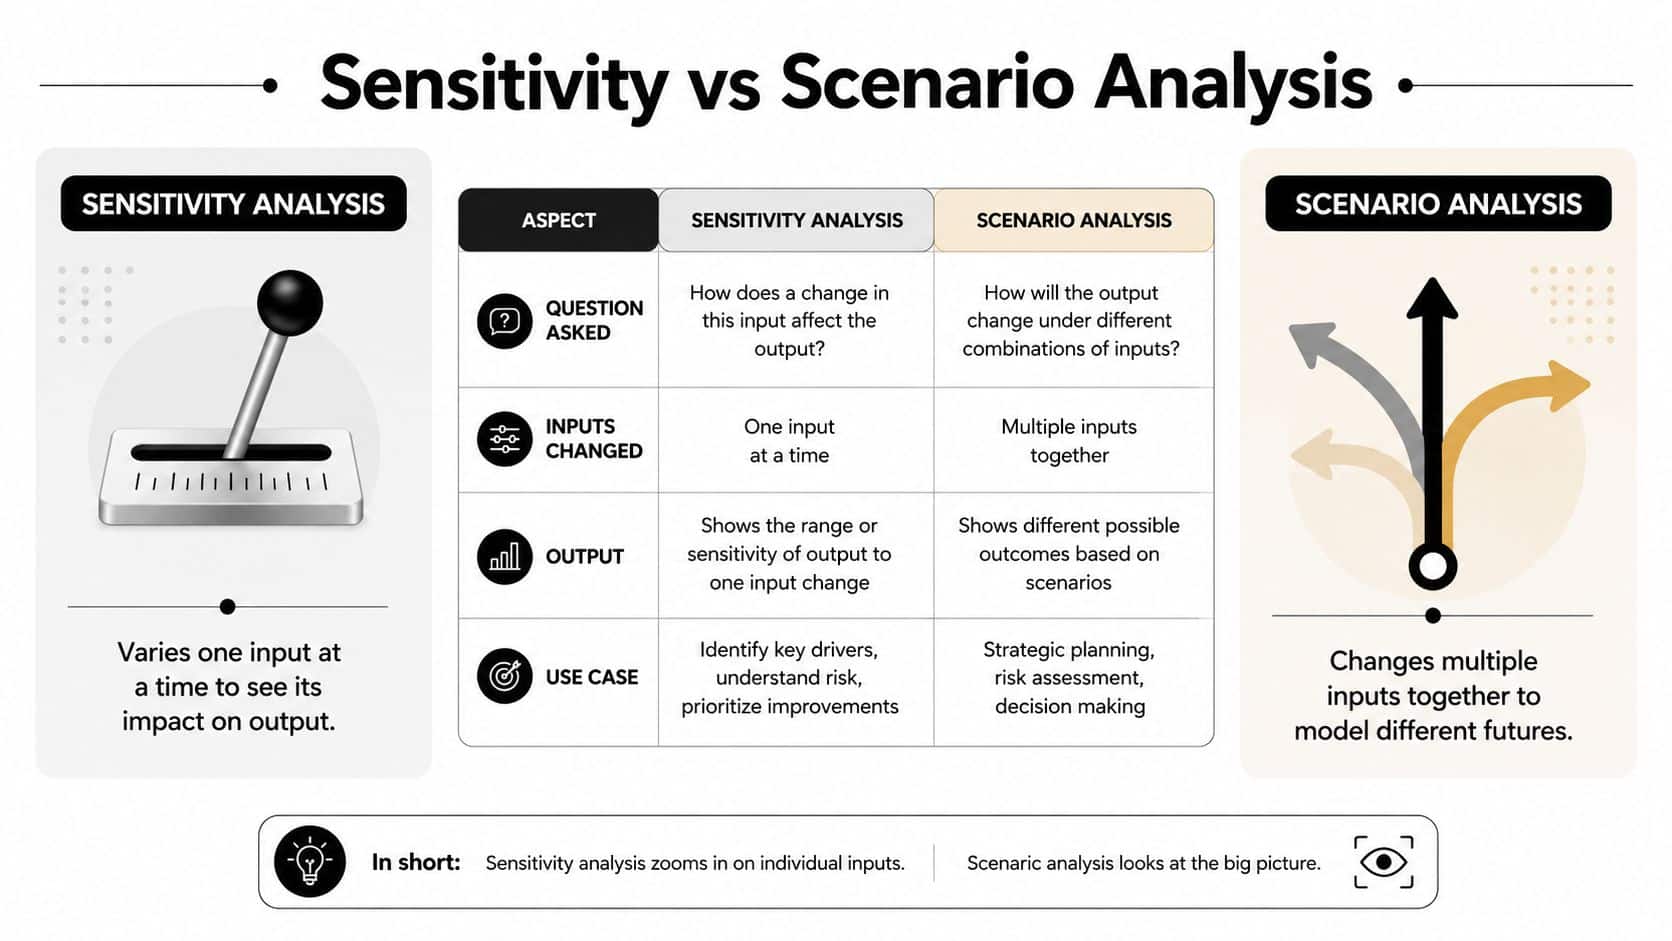
Sensitivity analysis answers that question by changing one input at a time. Analysts use it to isolate a single driver, such as unit price, utilization, interest rate, or volume, and watch how the outcome moves. In practice, that often shows up as a one-variable or two-variable Excel data table and a tornado chart, which makes it easy to rank the biggest levers without muddying the result. That is why this method is useful when the core question is, “Which variable moves the result the most?” CFI's comparison of scenario and sensitivity analysis sets out that basic distinction clearly, and it matches how I see owners use it in live models.
Scenario analysis works differently. It changes multiple inputs together so the model reflects a coherent future, like base, bull, and bear cases. Instead of asking which assumption matters most, it asks, “What happens if several conditions change at once?” That makes it the better tool when the decision depends on the full business picture, not a single moving part. If you need the forecast structure behind those cases, the financial forecast workflow shows the setup I use before I start layering scenarios. For a deeper dive into structuring these inputs, see this financial models and ROI guide.
Practical rule: If one input can change the answer, sensitivity analysis is enough. If several inputs usually move together, scenario analysis is the safer read.
The difference in a financial model is what each method reveals to the decision-maker. Sensitivity analysis ranks factors, so it helps you see which assumption deserves attention first. Scenario analysis tests resilience, so it shows whether the plan still holds when multiple assumptions move at the same time. That matters in construction, distribution, and services models because false confidence usually comes from treating linked inputs as if they were independent.
Side by Side Comparison of Both Methods
The cleanest way to separate these tools is to stop thinking in definitions and start thinking in outputs. Owners don't buy analysis for the label, they buy it for the decision it supports. If the output doesn't tell you something specific about risk, timing, or capital use, it's probably too abstract to matter.
| Criterion | Sensitivity Analysis | Scenario Analysis |
|---|---|---|
| Question answered | Which assumption has the biggest impact? | What happens if a set of assumptions move together? |
| Model behavior | One variable changes, the rest stay fixed | Several variables change in a consistent package |
| Output format | Data table, tornado chart, ranked drivers | Base, bull, and bear outcomes, often with narrative support |
| Reader | CFO, controller, owner, lender | Owner, board, leadership team, investors |
| Best for | Isolating leverage points | Stress-testing strategy |
| Weakness | Can overstate a driver when variables are linked | Can get bloated if every possible future is modeled |
| Decision support | Pricing, hiring, equipment, covenant checks | Expansion, financing, exit planning, contingency planning |
In practice, I use sensitivity analysis when I need speed and precision. I use scenario analysis when I need the board to believe the model because the story and the numbers line up. Those are not interchangeable goals. Forecasting accuracy matters, but the goal is not perfection, it's making a better decision with the uncertainty already in front of you.
A sensitivity table is a flashlight. A scenario set is a map.
AnalystPrep's overview of sensitivity, scenario, and simulation analysis reflects the same long-standing modeling logic, one variable versus many. That historical split is why spreadsheet models still use both methods instead of forcing one tool to do everything.
The practical takeaway is straightforward. If the owner wants to know which lever matters most, use sensitivity analysis. If the owner wants to know whether the business still works under a plausible combination of changes, use scenario analysis.
Running a Sensitivity Analysis Step by Step
A $25M construction company looking at a new excavator doesn't need a philosophical debate. It needs to know whether the machine earns its keep under realistic changes in price, utilization, and financing rate. That's a sensitivity analysis job.
Pick the inputs that actually drive the decision
Start with the few assumptions that matter most. For an equipment purchase, that usually means job price, utilization, and financing rate. For a contractor, it might be billable hours, labor cost, and change order capture. The point is to choose variables that can move the answer, not every line in the model.
Then build a range around each driver. Keep the ranges realistic and business-specific. If the excavator only works when utilization is perfect, the model is already telling you the purchase is fragile.
Build the table and read the chart
In Excel, a one-variable data table lets you test one driver across a range of values. A two-variable data table is useful when you want to see how two assumptions interact, such as utilization and financing rate. Once the table is built, the output grid shows how the target metric changes, usually NPV, EBITDA, cash flow, or payback.
A tornado chart then ranks the inputs from biggest impact to smallest. That's the part owners usually care about most. If utilization swings the answer much more than financing cost, you know where to spend management energy.
Useful check: If the chart says one variable dominates, ask whether that variable is truly independent. If it isn't, the chart may be cleaner than the business reality.
The cleanest way to use the result is not to admire it, but to decide. If the excavator only works when utilization stays high, the purchase needs a backup plan, a rental alternative, or a better job pipeline. If the financing rate barely changes the outcome, the financing conversation is secondary.
A practical build sequence helps. Model the base case first, copy the input cells into a small table, run the data table, then summarize the top three drivers in plain English. A controller can do the Excel work, but the owner should be able to read the conclusion in one minute.
For the mechanics of setting up the underlying cash forecast, the cash flow forecast guide is a good companion resource.
Building a Scenario Analysis That Survives a Board Meeting
Scenario analysis earns its keep when the decision depends on more than one moving part. A second warehouse for a $40M distribution company is a good example, because the question is not just “Will sales grow?” It's whether revenue, margin, freight, labor, and cash all move together in a way the business can survive.
Start with the story, then the numbers
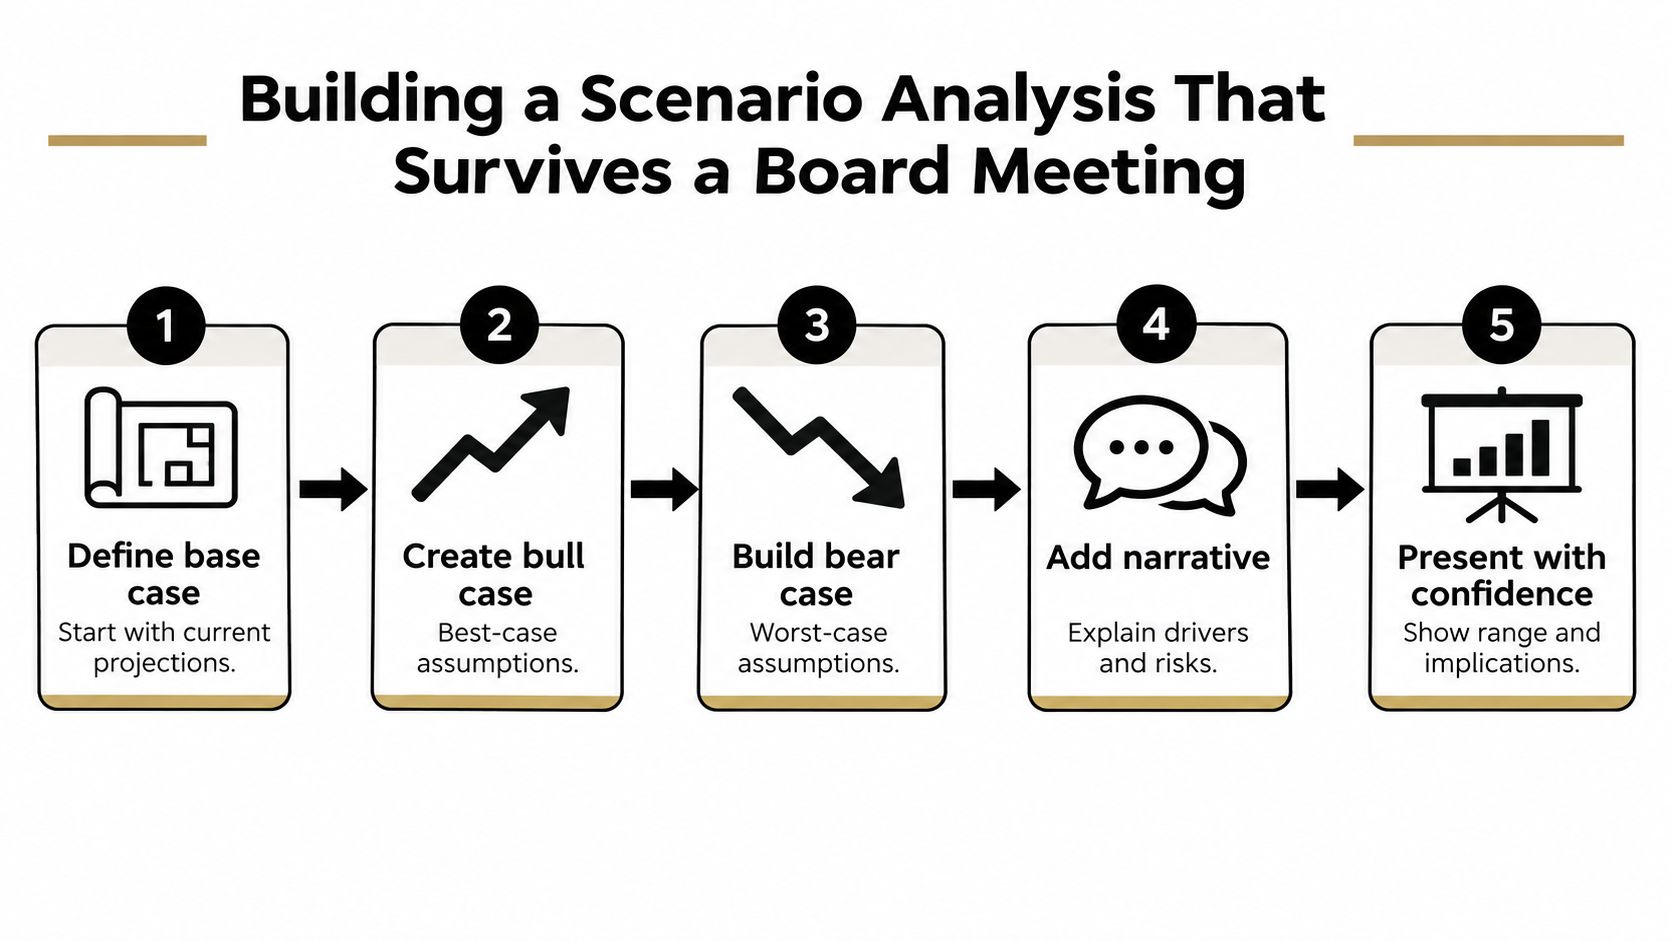
Write each scenario as a short narrative first. The base case is the most defensible operating path. The bull case assumes stronger demand, cleaner execution, and better absorption of overhead. The bear case assumes slower sales, margin pressure, and higher operating friction.
That narrative matters because scenario analysis is really a story about the future. If the leadership team can't understand the story, they won't trust the numbers. ModSim's discussion of scenario analysis as a coherent-state method captures that logic well, multiple inputs moving together in an internally consistent future.
Translate the story into linked assumptions
For the warehouse example, move the inputs together. Revenue growth shouldn't change in isolation if freight cost, headcount, and margin are also shifting. That's what makes the model believable. A scenario set is not just a prettier sensitivity table, it's a consistent operating thesis.
If you need a document-heavy process to support the build, tools with conditional fields can help organize the assumptions into different paths. That's where something like Superdocu conditional logic can be useful in the surrounding workflow, especially when multiple stakeholders need to review different versions of the same plan.
Read the right outputs
The output that matters most is usually cash position and debt covenant headroom. If the bear case strains both, the board needs to see the mitigation plan before approving the project. If the bull case looks great but the base case is thin, the expansion may be too aggressive.
I'd keep the scenario set tight. Three cases usually say enough. When owners add too many variants, the model becomes harder to defend and easier to ignore.
For a broader planning frame, the financial plan overview pairs well with this kind of board-level modeling.
How the Two Methods Work Together and Where Inputs Correlate
The biggest modeling mistake is treating sensitivity analysis as if it were a full reality check. It isn't. It isolates one driver on purpose, which is useful, but that same feature can distort the result when inputs naturally move together.
A construction company is the clearest example. If revenue drops, utilization usually drops too, and margin often follows. A sensitivity table that holds utilization constant while changing price can make price look more powerful than it really is, because the model has removed the rest of the story. That's the gap scenario analysis fills by design, since multiple inputs move in a coherent package.
The two methods work best together. Use sensitivity analysis first to rank the drivers. Then use scenario analysis to test the combined effect of the most important ones. That sequence keeps the model lean while still respecting the way the business behaves.
A simple rule helps with correlation. If two or more assumptions tend to move together in the world, don't rely on one-variable testing alone. Bundle them into a scenario. If you still need one-variable precision, run sensitivity analysis on the key driver after you've anchored the broader case.
Budget versus actual variance analysis fits into this same discipline because it forces you to ask which assumption drifted, and whether the drift was isolated or part of a wider pattern. That's the discipline owners need when they're trying to avoid model drift disguised as certainty.
Correlated inputs are where clean spreadsheets become misleading.
The goal is not to choose a camp. It's to use sensitivity for insight, scenario for realism, and both together when the decision is expensive enough to deserve a harder look.
Decision Rules for Choosing the Right Method
The easiest decision rule is also the most useful. Ask yourself one question. Am I trying to find the lever that matters most, or am I trying to see whether the plan survives a coherent bad future?
If you're trying to rank importance, start with sensitivity analysis. If you're trying to test resilience, start with scenario analysis. That rule holds up across a project manager hire, a long-term contract repricing, a truck loan, or an exit model for a sale in year four.
Match the tool to the question
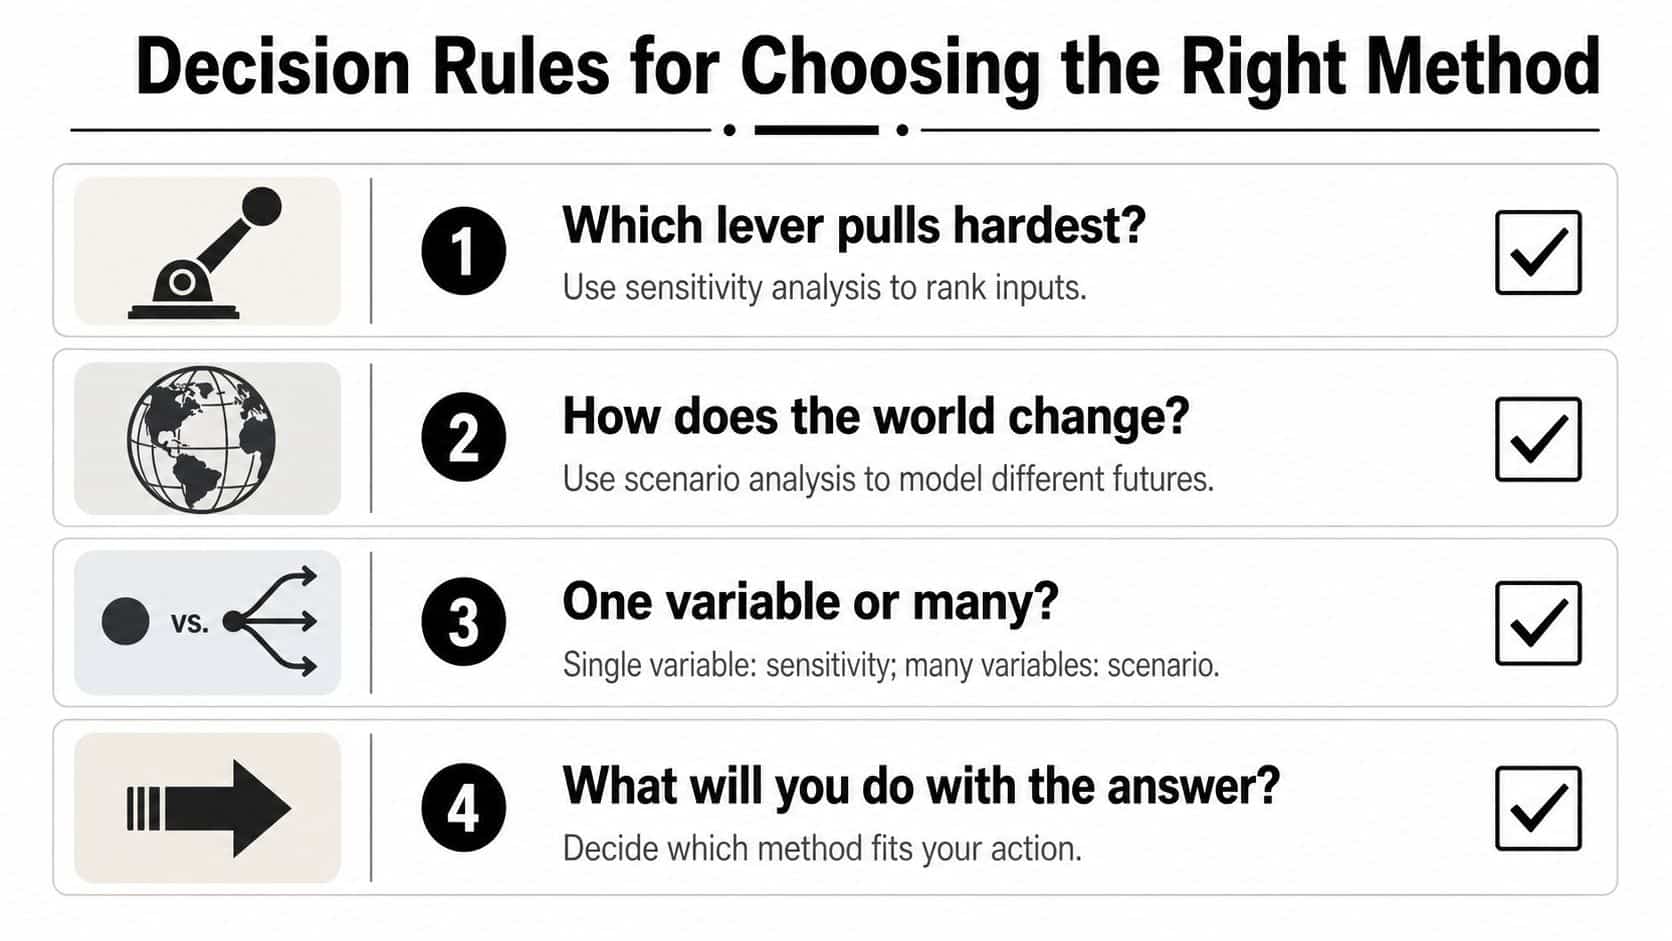
- Which lever pulls hardest? Use sensitivity analysis to rank inputs.
- How does the world change? Use scenario analysis to model different futures.
- One variable or many? If it's one, sensitivity is usually enough. If it's many, scenario is the better fit.
- What will you do with the answer? If the answer changes a pricing decision, sensitivity may be the cleaner read. If it changes whether you buy, hire, or expand, scenario analysis deserves the first pass.
For owner decisions, I usually think about it this way. Hiring a project manager is often a sensitivity question because you want to know which assumption makes the hire pay back. Repricing a multi-year contract is often a scenario question because pricing, volume, and margin can move together. Financing a new truck is usually sensitivity-first, while modeling a sale of the business needs scenarios because the exit outcome depends on several linked conditions.
The trap is overusing scenario analysis when the answer is simple, or overusing sensitivity analysis when the business context is messy. Both mistakes waste time. One hides the biggest lever. The other creates a false sense of precision.
When the question is narrow, keep the model narrow. When the question is strategic, make the model strategic.
When Sensitivity Analysis Is the Better First Move
Some decisions are clean enough that sensitivity analysis should lead. Pricing a single product line, evaluating a piece of equipment, or stress-testing a debt covenant against interest rates are all isolated questions. In those cases, a scenario set can blur the answer by mixing in extra assumptions that don't need to be there.
In construction, this often shows up in job margin modeling. If you want to know whether labor rate or utilization hurts a job more, sensitivity analysis gives you the faster answer. In distribution, freight pricing often works the same way, because one change in route cost or margin pressure can dominate the result. In professional services, utilization and bill rate can be tested separately before you decide whether the staffing plan needs to change.
Where sensitivity earns its keep
- Equipment decisions: The owner needs to know whether usage, price, or financing cost changes the payback enough to matter.
- Pricing checks: A distributor can test whether a small freight surcharge offsets margin pressure.
- Capacity planning: A services firm can see whether utilization or billing rates drive the forecast more aggressively.
The common mistake is trusting the tornado chart when the inputs are linked. If labor, revenue, and overhead all move together, a single-variable result can flatter the plan. Use sensitivity when the question is isolated, not when the business outcome depends on a chain of reactions.
The scenario-versus-sensitivity discussion from Vena Solutions makes that same point in modeling language, and it's the right caution to keep in mind. Sensitivity is strongest when you want clarity, not when you want a full business story.
Embedding Both Methods in Cash Flow and Exit Planning
The models stop being academic in a 13-week cash flow forecast. Using sensitivity analysis in the rate column lets an owner see which week a small AR delay breaks the plan. That tells the leadership team where to watch collections, vendor timing, and payroll coverage without guessing.

For exit planning, scenario analysis belongs in the same model. The owner can compare base, upside, and downside sale outcomes by changing timing, margin, and cash generation together, then see how each path affects the transaction runway. That's also where a risk-management lens matters, and resources like manage business risks with Ivory Mind can help teams think through the non-financial side of the same question.
The video below is useful if you want to see the workflow in a more operational format.
A simple worksheet prompt works well here. List the three cash assumptions that would hurt the most if they moved in the wrong direction. Then build one sensitivity table for the biggest single risk and one three-case scenario set for the broader path to exit. That combination gives the owner both speed and context.
If you want this built into your own model, AmbitionCFO can help you run both methods against your cash flow, capital decisions, and exit timeline, so you're not guessing at the levers that matter most. Book a working session and bring the model, the decision, and the next board date, and we'll turn the uncertainty into a plan you can use.