
You're probably making at least one big decision right now without enough visibility. Hire another salesperson. Add project managers. Order inventory ahead of demand. Buy equipment. Push into a new territory. All of those decisions feel urgent, and all of them can hurt cash if your revenue timing is off.
That's why a projected sales forecast template matters. Not because you need another spreadsheet, but because you need a way to turn uncertainty into a model you can challenge, update, and use. A good forecast replaces “I think we'll be fine” with a measurable view of what sales are likely to happen, when they're likely to happen, and how that affects the rest of the business.
For founder-led companies, this gets even more important as complexity rises. If revenue comes in uneven waves, one delayed project or one missed deal can throw off hiring, vendor payments, and owner distributions. That's exactly why financial forecasting matters during rapid business growth. You need a forecasting process that supports real operating decisions, not a budget file that gets ignored after January.
Table of Contents
- Stop Guessing and Start Forecasting Your Company's Future
- Your Downloadable Sales Forecast Template Explained
- How to Build Your Forecast from the Ground Up
- Customizing the Forecast for Your Business Model
- Connecting Your Sales Forecast to Your Financial Strategy
- Common Forecasting Pitfalls and How to Avoid Them
- Turn Your Forecast into Your Most Powerful Decision Tool
Stop Guessing and Start Forecasting Your Company's Future
A projected sales forecast template answers one question every owner asks, even if they phrase it differently.
What can this business support over the next few months and the next year?
If you're deciding whether to add headcount or commit to a major purchase, “probably” isn't good enough. You need a forecast built from what your business has sold, what's currently in motion, and what assumptions you're making about the near future.
According to Indeed's explanation of sales forecast formulas, a sales forecast template is usually built around historical sales data, using inputs like monthly units sold, revenue by product, average sales cycle length, growth percentage, and pipeline close rate. That same guidance also makes the key point most owners miss. The template isn't just a reporting form. It's a decision tool for staffing, inventory, hiring, and capital planning.
What a sales forecast actually is
A sales forecast is a working estimate of future revenue based on measurable inputs. In plain English, it's your best current view of what customers are likely to buy, when they're likely to buy it, and what that means for the business.
That's different from a sales goal.
A goal is what you want. A forecast is what the evidence supports.
A good projected sales forecast template turns gut feel into a repeatable financial model.
Why owners need this now
When you're still small, you can get away with instinct. Once you have multiple reps, multiple service lines, project billing, backlog, or uneven order timing, instinct starts costing you money.
A strong forecast helps you answer questions like these:
- Hiring timing: Can the business support another salesperson, estimator, or project manager?
- Inventory planning: Should you place larger orders now or protect cash?
- Capacity planning: Do you have enough people to deliver the work you're likely to sell?
- Capital decisions: Can you take on equipment payments without squeezing operating cash?
That's what a projected sales forecast template should do. It should give you a disciplined way to make decisions before cash gets tight.
Your Downloadable Sales Forecast Template Explained
A useful forecast template does one job well. It turns scattered sales activity, backlog, and delivery timing into a view you can use to make decisions.
That matters even more in businesses with lumpy revenue. If you run construction, distribution, manufacturing, or professional services, sales do not arrive in a neat monthly pattern. One large job can carry a quarter. One delayed purchase order can throw off hiring plans and cash. Generic templates miss this because they assume steady volume. Your template needs to reflect how work is sold, scheduled, billed, and recognized.
The four tabs that matter
Use a four-tab structure. Anything less leaves out a key driver. Anything more usually turns into spreadsheet theater.
| Tab | What goes there | Why it matters |
|---|---|---|
| README | instructions, definitions, update rules | keeps the file usable when multiple people touch it |
| Assumptions and Drivers | pricing, headcount changes, sales cycle assumptions, seasonality, backlog logic | centralizes the variables that move the model |
| Monthly Sales Forecast | revenue by month, product, service line, rep, or project type | shows the detail behind the total |
| Summary Dashboard | high-level revenue view, scenarios, forecast vs actuals | gives the owner a decision-ready snapshot |
If your current file has twelve tabs, hidden formulas, and no clear owner, fix that first.
README keeps the process disciplined
The README tab keeps the model from getting corrupted by good intentions.
Write down where each input comes from, who updates it, when it gets updated, and which cells are safe to edit. If sales pulls pipeline from the CRM, finance pulls invoicing from QuickBooks, and operations adjusts project timing based on capacity, that process needs to be documented. Otherwise the template turns into a moving target.
Include clear definitions for terms your team uses loosely:
- Pipeline close rate: the share of opportunities that become closed business
- Sales cycle length: how long it usually takes to move from opportunity to closed sale
- Backlog: committed work not yet recognized as revenue
- Variance: the gap between forecasted results and actual results
Good forecasting depends on clean definitions. If your team argues about what counts as backlog, the problem is not the spreadsheet.
Assumptions and Drivers is the engine
This tab deserves more attention than the dashboard because it controls how the forecast behaves under pressure.
Put every changeable input here. Pricing. Start dates for new reps. Ramp time for delivery staff. Seasonality. Conversion timing. Expected project slippage. For a project-based company, add booking date, start date, billing schedule, and revenue recognition timing. Those are different events. Treating them as one date is how owners get blindsided on cash.
Keep assumptions visible because they should be challenged every month. If collections are stretching, if projects are starting later, or if close rates have softened, update the input. Do not bury that logic inside formulas no one will audit.
Practical rule: If an assumption can change, it belongs in an input cell.
Monthly Sales Forecast is where the model becomes useful
This tab should match the way your business wins and delivers revenue.
A distributor may forecast by customer, SKU category, and reorder pattern. A contractor may forecast by awarded jobs, estimated start month, percent complete, and billing milestones. A professional services firm may need active proposals, signed engagements, utilization, and retainer versus project work. Build the rows around those drivers, not around a generic monthly total.
Basic forecast formulas still have value. The U.S. Small Business Administration explains that many small businesses start with unit sales times average price, then refine the model with real operating assumptions such as timing, market demand, and product mix: SBA guidance on projecting sales. That is the right progression. Start simple, then add the variables that actually move your revenue.
For owners, the goal is decision quality. Your forecast should show whether booked work converts to cash fast enough to support payroll, whether the pipeline supports another hire, and whether growth is coming from repeatable sales or one-off projects. That is why I also recommend tracking the financial metrics every business owner should track alongside the forecast. Revenue without margin, cash timing, and capacity context is incomplete.
Summary Dashboard is for decisions
Keep the dashboard tight. One page is enough.
It should answer four questions fast:
- What do we expect to sell this month, quarter, and year?
- How does that compare to the last forecast and to actual results?
- What changed, specifically, by segment, rep, customer group, or project type?
- What decision needs to be made now?
That last question matters most. If the forecast says backlog is strong but starts are slipping, hold off on hiring field staff. If awarded work is rising and purchase orders are firm, prepare inventory earlier. If revenue is up but billing is back-loaded, protect cash before adding overhead.
A forecast template earns its place when it helps you act sooner, not when it makes your reporting look polished.
How to Build Your Forecast from the Ground Up
The fastest way to wreck a forecast is to start with a top-line growth number and work backward. Owners do this all the time. They decide they want growth, plug a percentage into a spreadsheet, and call it a forecast.
That's not forecasting. That's wishful formatting.
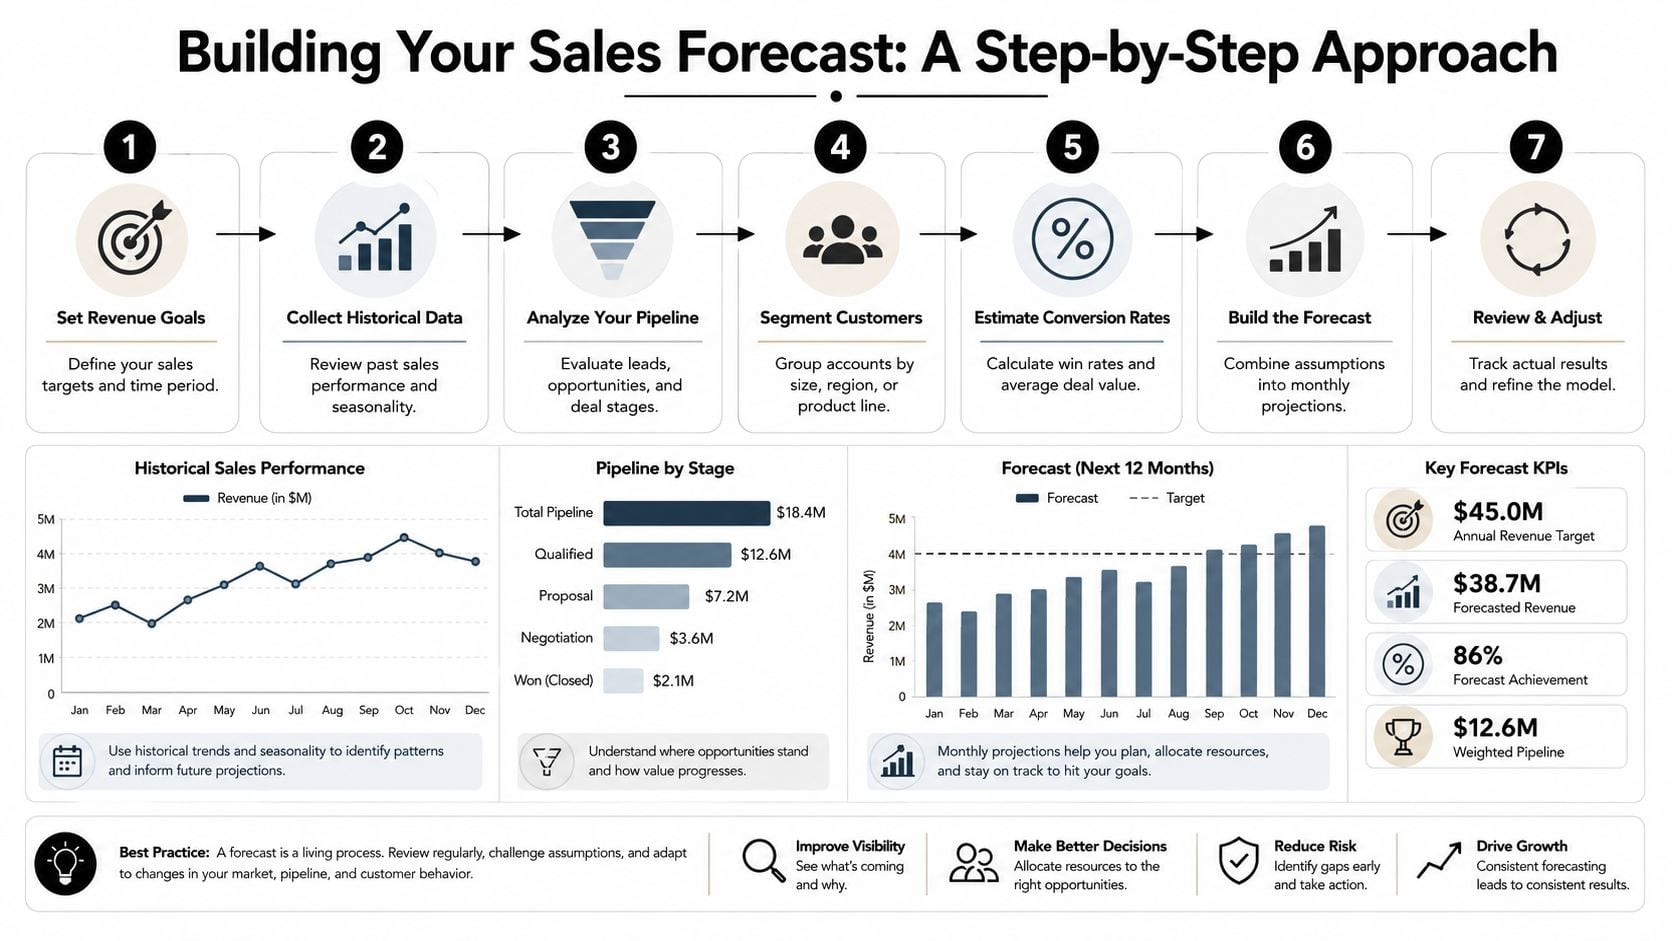
A stronger projected sales forecast template is built from the bottom up. Anaplan's sales forecasting guidance recommends building from historical sales by product or segment, current pipeline, and explicit assumptions about sales cycle length, then adjusting for seasonality, pricing, headcount, and planned initiatives. It also notes forecasts are more accurate when they're itemized at the level of units, price, rep, and period.
Here's the workflow I recommend.
Start with actual history, not memory
Pull real data from your accounting system and CRM. Don't estimate from memory. Don't rely on what the sales team “feels good about.”
You want actual monthly sales by category. Depending on the business, that may include:
- Product revenue: by SKU, line, or category
- Service revenue: by client type, offering, or engagement
- Rep output: what each salesperson closed
- Project revenue: when work was invoiced or recognized
- Sales timing: how long deals usually take to close
If your historical data is messy, clean it before you build the model. That effort pays off in every future cycle.
A useful companion to this work is keeping an eye on the financial metrics every business owner should track, because your forecast gets sharper when it's tied to operating metrics instead of just totals.
Build the forecast from drivers
Now identify what moves revenue in your company.
For a distribution business, that may be units sold, average order value, sales rep coverage, and order timing. For a project-based firm, it may be backlog, proposal volume, win timing, and project start dates. For a services firm, capacity and utilization often matter more than raw lead flow.
Put those drivers into the assumptions tab and let the model calculate the monthly view.
Here's a simple driver checklist:
Units or volume
What are you selling? Products, projects, service packages, billable hours, retainers.Price or value
What is each unit worth, and are price changes planned?Timing
When will that revenue hit? Not when the deal is discussed. When it's likely to close and be recognized.Sales capacity
How many reps, estimators, or partners are producing revenue, and when will new hires become productive?Conversion logic
What portion of pipeline is credible enough to include, and at what stage?
If you can't explain where a monthly revenue number came from, you don't have a forecast. You have a placeholder.
The visual below is worth using as a working checklist while you build your file.
Review the output like an owner
Once the template populates, don't assume the formulas are right just because the spreadsheet calculates.
Interrogate the result.
Ask:
- Does this month make sense based on known deals and backlog?
- Did we accidentally smooth revenue that is lumpy?
- Are pricing changes reflected in the right period?
- Have we included capacity constraints that could limit delivery?
- What assumptions are doing the most work in this model?
I also recommend documenting the assumptions in plain language. If the forecast assumes faster closes, stronger pricing, or quicker ramp time for a new rep, write that down. Otherwise, nobody remembers why the number looked believable three months ago.
What a bottom-up process fixes
A bottom-up forecast won't eliminate uncertainty. It will expose it.
That's exactly what you want. A forecast should show where your confidence is high, where timing is weak, and where one assumption could change the whole picture. Once you see that clearly, you can act earlier.
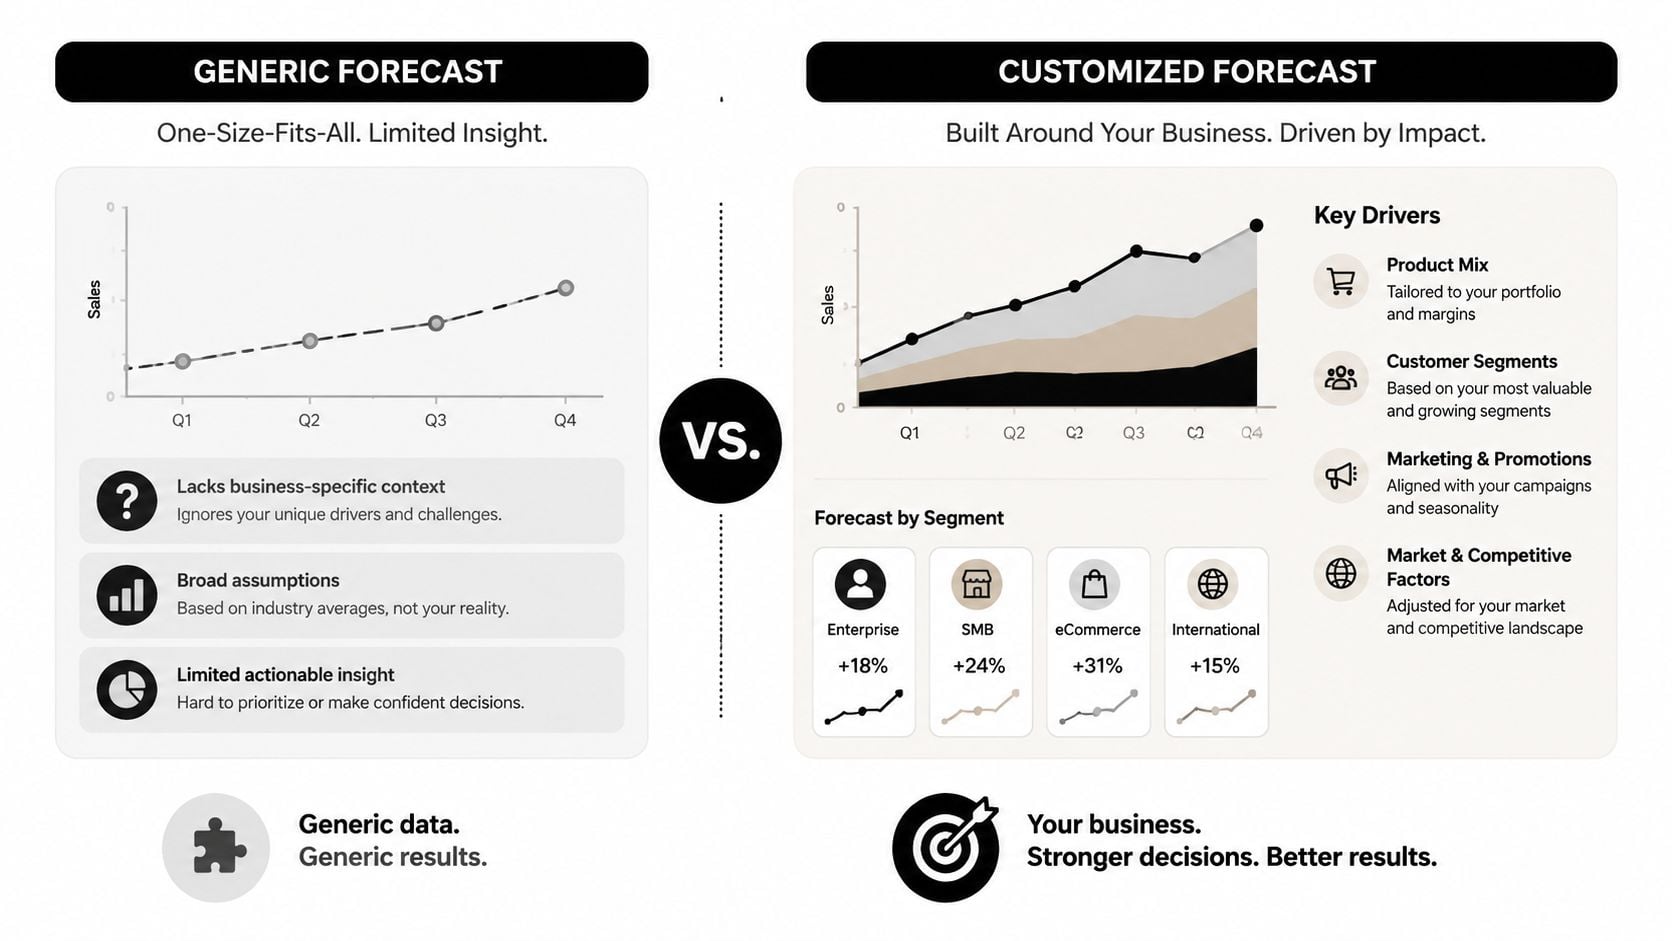
Customizing the Forecast for Your Business Model
Generic templates work best for businesses with smooth, repeatable revenue. That's not most owner-led companies in construction, distribution, or professional services.
If your revenue shows up in chunks, a generic monthly sales sheet can fool you. It gives you a tidy line of projected revenue while hiding the issue, which is timing.
Apollo's discussion of sales forecast templates points directly at this gap. For businesses with lumpy, non-recurring revenue, a more useful template often needs separate layers for committed backlog, renewal probability, change orders, and timing risk. That's the right way to think about it.
Construction and distribution
These businesses often get punished by timing more than volume. One shipment slides. One project start moves. One change order takes longer to approve. Revenue may still happen, but not when you expected it.
Your projected sales forecast template should include separate logic for:
- Committed backlog: signed work or confirmed orders not yet recognized
- Bid pipeline: likely work, but not committed
- Change orders: possible upside, but uncertain timing
- Timing risk: expected month versus realistic month
A simple structure looks like this:
| Revenue Layer | Forecast Treatment | Owner takeaway |
|---|---|---|
| Committed backlog | included with expected delivery or completion timing | supports staffing and purchasing |
| Open bids or quotes | included only with clear probability and timing assumptions | informs growth planning, not fixed spending |
| Change orders | tracked separately from base contract value | prevents overcommitting cash |
| Delayed projects | flagged with alternate timing scenario | protects liquidity planning |
This is one reason owners benefit from a disciplined business budgeting process. Budgeting without project timing logic creates false confidence.
Professional services
For service firms, revenue often depends less on “sales” in the traditional sense and more on delivery capacity.
If you run an agency, consulting firm, engineering practice, or outsourced service business, start with these drivers:
- Team capacity: available hours by role
- Billable mix: what share of that time is client-facing and billable
- Realization: whether pricing and scope hold up in practice
- Client pipeline: new work, renewals, and expansions
- Start dates: when signed work begins
A services forecast should tie the sales view to operational reality. If partners sell more work than the team can deliver, your revenue timing, margins, and client experience all suffer.
Forecast service revenue based on what the team can sell and deliver, not just what's sitting in proposal stage.
SaaS and recurring revenue
SaaS is different because recurring revenue creates a cleaner baseline. That doesn't mean the forecast is easy. It means the model should separate stable recurring revenue from more volatile new business and expansion assumptions.
The key drivers usually include:
- Recurring base: existing customer revenue already under contract
- New customer adds: expected wins from pipeline
- Expansion revenue: upgrades, cross-sells, or added seats
- Customer losses: churn or downgrades
- Sales productivity: time to productivity for new reps
This model usually looks cleaner than a project-based business, but don't let that trick you into overconfidence. If channel mix, buyer behavior, or rep performance is changing, your old conversion assumptions may stop working fast.
One template, different logic
You do not need a separate forecast system for every revenue type. You do need different driver logic inside the same structure.
Here's the practical test. If the model reflects how revenue enters your business, you'll trust it enough to use it. If it smooths over the mess, you'll ignore it when decisions get hard.
Connecting Your Sales Forecast to Your Financial Strategy
A sales forecast by itself is not a strategy. It becomes strategic when you connect it to cash, margin, and capacity.
That means the revenue line from your projected sales forecast template should feed the rest of your financial model. If it doesn't, you're still making major decisions in pieces.
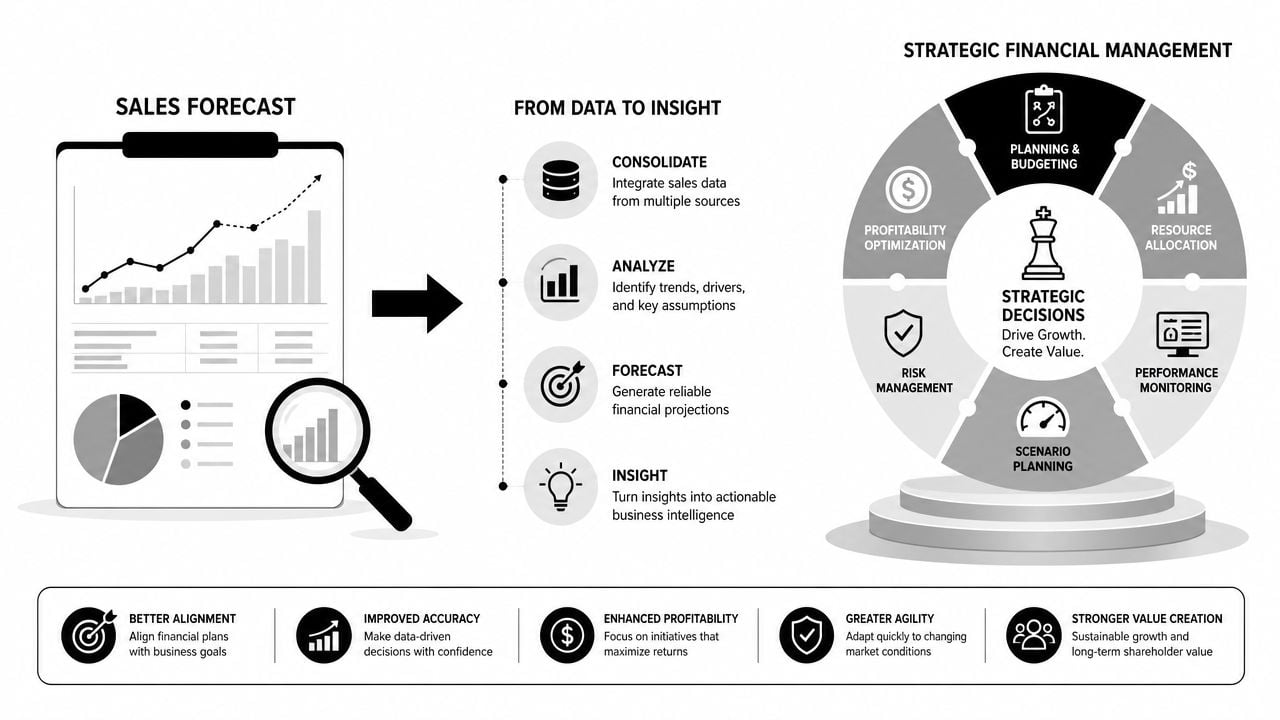
Turn one revenue line into three financial views
Once you have a credible sales forecast, use it to drive:
- Profit and loss planning: expected revenue, gross margin, operating expenses
- Cash flow planning: when cash comes in versus when expenses go out
- Balance sheet impacts: receivables, inventory, payables, debt load
Owners usually realize revenue and cash are not the same thing. A strong sales month can still create a cash squeeze if billing lags, collections drag, or inventory has to be purchased ahead of demand.
That's why your forecast should connect to a longer planning model. If you're building toward expansion, succession, or a future transaction, a long-term financial plan needs this forecast as a core input.
Use ranges when the market gets noisy
When conditions are stable, a single-number forecast can be fine.
When the market is moving quickly, that approach becomes dangerous. Asana's sales forecast template guidance notes that when historical data stops being a reliable guide, leaders should move from a single forecast number to a range-based or scenario-based forecast tied to indicators like pipeline coverage and rep-specific variance.
That's the right move.
Build at least three views:
| Scenario | What it assumes | What you use it for |
|---|---|---|
| Base case | most likely outcome based on current evidence | day-to-day operating plan |
| Conservative case | slower timing, weaker closes, delayed starts | cash protection and spending discipline |
| Upside case | stronger execution, faster timing, better conversion | capacity and hiring readiness |
This matters most when your sales team is very active but signal quality is weaker. More pipeline activity does not automatically mean more collectible revenue.
The moment you stop trusting historical conversion rates, stop pretending one number is precise.
Questions your forecast should answer
A strategic forecast should help you answer questions like:
- Can we hire ahead of demand, or do we need sales to convert first?
- What happens to cash if project timing slips?
- Which growth plan requires outside financing and which one doesn't?
- Can we handle expansion operationally without hurting margin?
Those are CFO questions. They start with a sales forecast, but they don't end there.
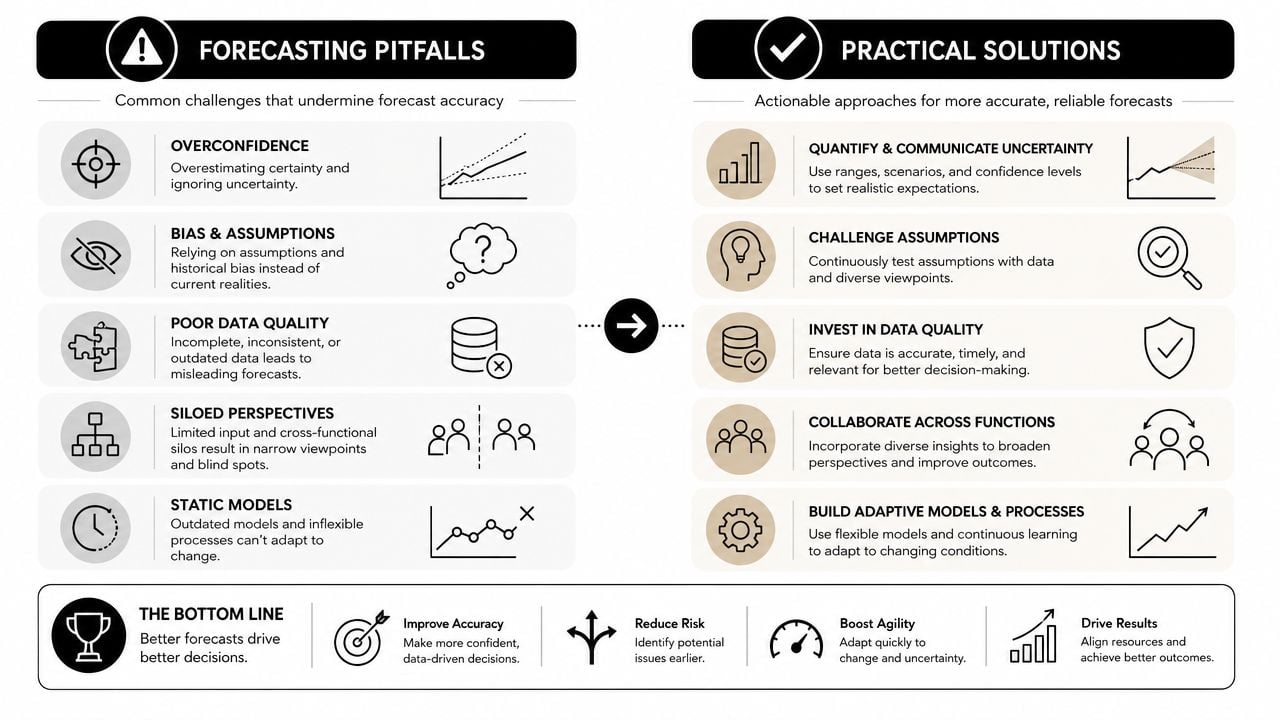
Common Forecasting Pitfalls and How to Avoid Them
I've seen forecasts fail in predictable ways. Not because the owner didn't care, but because the process was loose, the data was weak, or the model was treated like a one-time exercise.
Most forecast misses come from a handful of avoidable mistakes.
The forecast is stale before the quarter ends
If you update the file once a year, the forecast is already obsolete.
Revenue Grid's sales forecasting guidance recommends running the forecast on a regular cadence, weekly, monthly, or quarterly, enforcing CRM data-entry standards, and comparing forecast-to-actuals each cycle. That same guidance notes that monthly forecasting is typically more accurate than annual-only planning.
So do this:
- Set a cadence: monthly works well for most owner-led businesses
- Close the loop: compare forecast versus actual every cycle
- Find the miss: timing, pricing, volume, rep performance, or bad assumptions
- Adjust the model: don't just note the variance and move on
Bad inputs wreck good templates
A clean spreadsheet cannot fix dirty source data.
If your CRM stages are vague, opportunities are stale, and close dates are wishful, your projected sales forecast template will produce polished nonsense. The same goes for accounting data that isn't categorized consistently.
Fix the operating discipline:
- Standardize stages: every salesperson should use the same definitions
- Document assumptions: especially around timing and probability
- Clean historical data: map revenue to the right products, clients, or project types
- Assign ownership: someone has to own data quality, not just spreadsheet upkeep
Owners confuse goals with forecasts
This one causes more pain than people admit.
A sales goal is useful for motivation. A forecast is useful for resource decisions. If you use the goal as the forecast, you'll hire too early, spend too aggressively, or both.
Use both numbers if you want. Just keep them separate.
| Item | Purpose | Standard |
|---|---|---|
| Goal | sets ambition | what you want the team to achieve |
| Forecast | supports decisions | what the evidence currently supports |
Seasonality and cycle length get ignored
Some businesses load revenue into the month they want it, not the month it's likely to happen.
That shortcut creates bad cash planning and unrealistic staffing expectations. If your business has long sales cycles, seasonal demand patterns, or project kickoff delays, the template has to reflect that.
Your business doesn't care when you want revenue to land. It cares when customers actually sign, start, pay, and renew.
The antidote is simple, not easy
A useful forecasting discipline usually comes down to a few habits done consistently:
Update on a real cadence
Put the meeting on the calendar and keep it.Use actuals every cycle
Don't skip the forecast-versus-actual review.Challenge assumptions
Ask what changed, not just whether the number is higher or lower.Separate confidence levels
Treat committed revenue differently from likely revenue and speculative revenue.
Do those four things and your forecast becomes more than a reporting exercise. It becomes operational control.
Turn Your Forecast into Your Most Powerful Decision Tool
A projected sales forecast template should help you run the business with more control. That's its core purpose. It should tell you when to hire, when to wait, when cash gets tight, and when growth is real enough to support bigger bets.
If your revenue is uneven, this matters even more. Generic templates often break when timing risk enters the picture. A forecast built around backlog, pipeline quality, delivery capacity, and scenario planning gives you a much better view of what the business can support.
Use the template. Update it regularly. Compare it to reality. Then make decisions from it.
If you want a stronger operating rhythm around forecasting, budgeting, and financial decision-making, this guide on turning your business into a well-oiled machine without losing your marbles is a good next read.
Download a practical projected sales forecast template and put it to work in your business. If you run a founder-led company and need senior-level financial strategy without the cost of a full-time CFO, contact AmbitionCFO to build a forecasting process that supports better decisions on cash, hiring, profitability, and growth.