

You're probably looking at a decision right now that feels obvious on the surface. Hire the sales leader. Add the project manager. Order more inventory. Sign the lease because revenue looks strong and the bank balance still feels comfortable.
That's exactly when weak forecasting hurts a startup.
Most founders don't get in trouble because they lack ambition. They get in trouble because they make good operating decisions without seeing the cash consequences clearly enough. Revenue can rise while collections slow down. A profitable month on paper can still leave payroll exposed. A growth plan that looks smart in a board deck can become dangerous if hiring, supplier payments, and customer payment timing don't line up.
That's why financial forecasting for startups has to be more than a fundraising artifact. It has to become a working management tool that helps you decide what to do next, what to delay, and what your business can support.
Table of Contents
- Your Forecast Is a Steering Wheel Not Just a Map
- Establish Your Assumptions and Revenue Model
- Construct Your Three-Statement Financial Forecast
- Master the Tactical 13-Week Cash Flow Forecast
- Stress-Test Your Future with Scenario Analysis
- Translate Your Forecast into Actionable KPIs
- Prepare a Forecast That Inspires Confidence
- Take Control of Your Financial Future Today
Your Forecast Is a Steering Wheel Not Just a Map
A lot of startup forecasting advice is written as if the only audience that matters is an investor. That's incomplete, and for many founder-led companies, it's the wrong priority.
Founders often need a forecast to answer operating questions first. Can we afford the next hire? Should we expand now or wait? Is this the right time to commit to equipment, a new facility, or a larger line of credit? Guidance from Core Angels on startup financial forecasting makes that point directly. Forecasts should support operating decisions and exit readiness, with assumptions revisited regularly so the model stays relevant.
That changes how you build the forecast.
A static spreadsheet built once for a lender meeting won't help you much in the middle of a tough month. A living model will. It lets you test a hiring decision before you make it. It shows whether margin pressure is temporary or structural. It tells you whether growth is creating value or creating a bigger working-capital headache.
Practical rule: If your forecast doesn't change what you do this month, it's probably not detailed enough.
The best founders I've worked with don't treat forecasting like an annual compliance exercise. They use it the same way a pilot uses instruments. Not to admire the dashboard, but to make better moves while conditions change.
If you're also thinking beyond the next quarter, this operating forecast should connect to a broader long-term financial plan for the business. Short-term liquidity and long-term value should support each other, not compete.
Establish Your Assumptions and Revenue Model
A useful forecast starts before Excel, Google Sheets, or any FP&A software. It starts with assumptions you can defend.
If a founder tells me revenue will “grow steadily,” that's not an assumption. That's a hope. A forecast becomes usable when you define the mechanics behind growth and the timing behind cash.
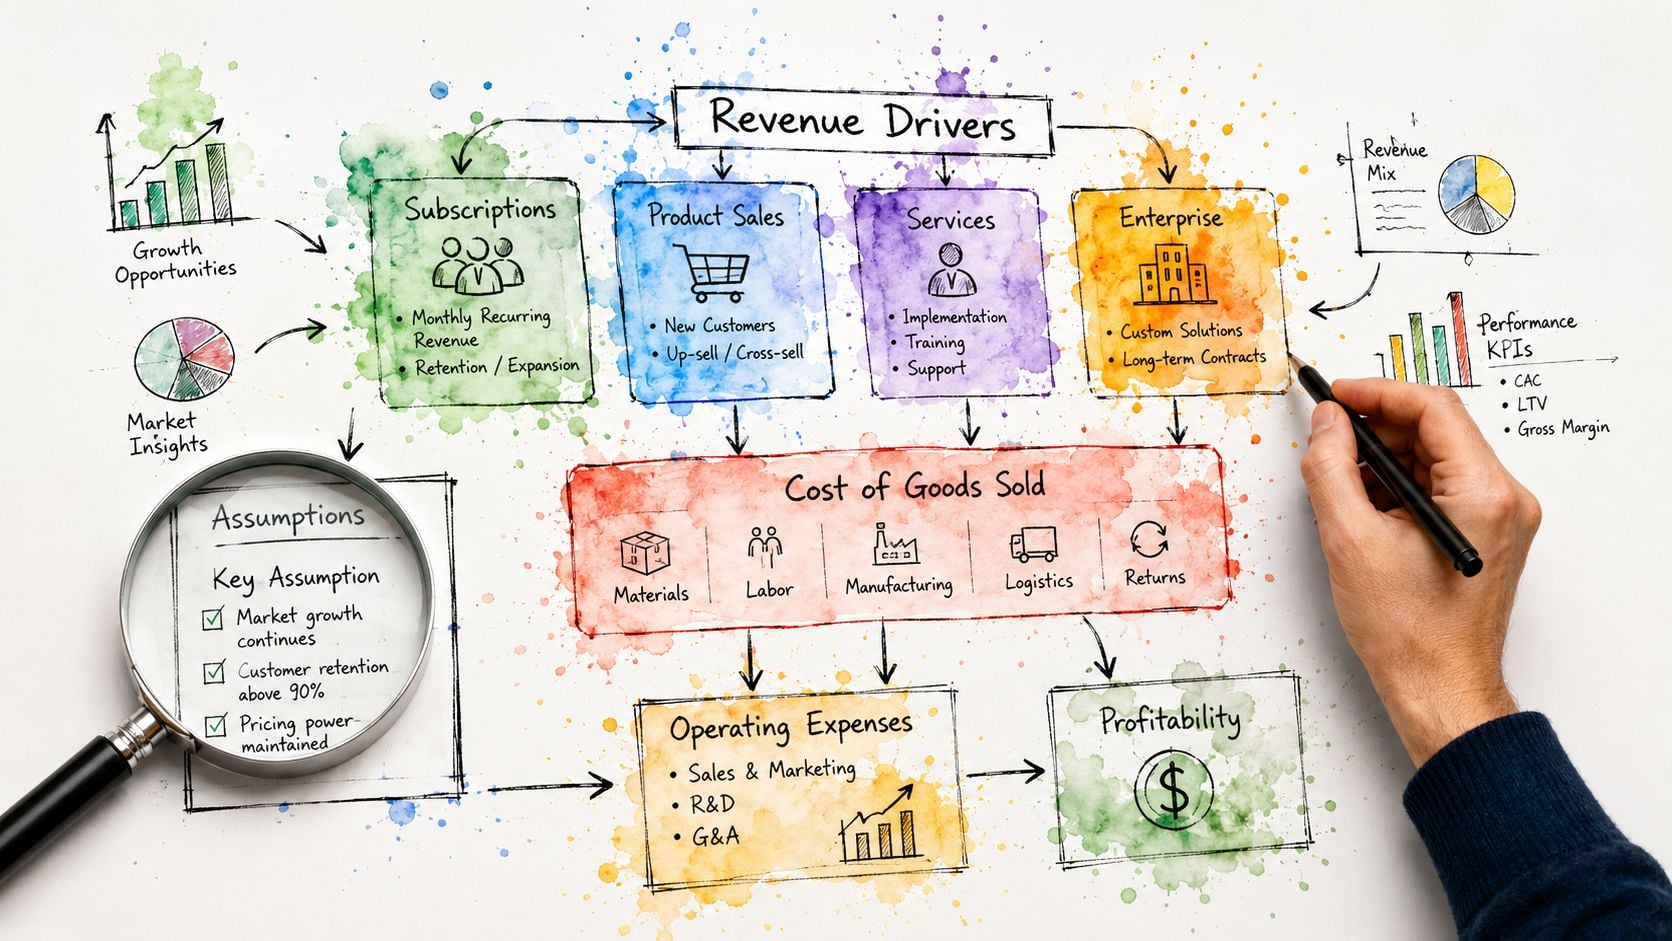
Start with drivers you can explain
A strong startup forecast is built from the bottom up. HireCFO's guidance on startup financial forecasting recommends building from operating drivers like customer acquisition logic, pricing, and unit economics, while warning that ignoring cash timing creates over-optimistic forecasts and liquidity gaps.
That means your first worksheet should answer questions like these:
- Who buys from you: Define customer type, sales channel, and buying pattern.
- How they convert: Spell out the path from lead to signed customer or active project.
- What they pay: Use actual pricing logic, not blended guesses that hide reality.
- How long they stay or repeat: For recurring or repeat-purchase businesses, include churn or reorder behavior.
- When cash arrives: Separate booked revenue from collected cash.
Those drivers differ by business model. A SaaS startup may care about pipeline conversion, price per account, and churn. A construction or services business may care more about signed jobs, average contract value, utilization, billing milestones, retainage, and collections.
Build revenue from business activity
Here's the simplest way to think about revenue forecasting. Don't start with a top-line target. Start with the business activity that produces that target.
A professional services firm might build revenue like this:
| Driver | Example logic |
|---|---|
| Active clients | How many clients can the team serve at current capacity |
| Average monthly billing | Expected fees per client based on service mix |
| Utilization | Whether billable staff can support planned work |
| Collections timing | When invoices are likely to convert to cash |
A distribution company might build revenue differently:
| Driver | Example logic |
|---|---|
| Units sold | Expected monthly unit volume by product line |
| Average selling price | Realistic price by category or customer segment |
| Gross margin profile | Margin differences across products |
| Customer payment terms | Timing between shipment, invoice, and cash receipt |
That's why bottom-up forecasting is so practical. It forces you to tie the model to daily operations. If sales conversion slips, the forecast tells you why. If one product line carries stronger margin, the model shows the effect. If a salesperson ramps slower than expected, you can adjust quickly.
Your forecast should read like your business operates. If the model doesn't resemble the way work gets sold, delivered, billed, and collected, it won't help you make decisions.
Tie costs to how the business actually runs
Most founders spend too much time debating revenue assumptions and too little time mapping cost behavior. That's a mistake.
Start with three cost buckets:
- Direct costs: Costs tied to delivery, production, subcontractors, freight, materials, or service labor.
- Operating expenses: Payroll, rent, software, insurance, marketing, and overhead.
- Capital spending and financing effects: Equipment purchases, debt service, and other non-operating cash needs.
Then split costs by behavior.
Some are fixed for a period. Office rent usually won't change next month. Core executive salaries usually won't either. Others move with activity. Materials, commissions, contractor spend, shipping, and payment processing often move as revenue moves.
Here's where founders often get tripped up:
- They underestimate hiring costs. Salary is only part of the commitment. Onboarding, ramp time, management bandwidth, and timing all matter.
- They treat marketing as smooth. In reality, spend often moves in bursts and results lag.
- They ignore collection timing. The invoice may be issued this month. Cash may land much later.
- They omit awkward costs. Taxes, annual renewals, debt payments, and project overruns have a habit of showing up at the worst time.
A clean worksheet for assumptions usually has three tabs or sections:
- Revenue drivers
- Cost drivers
- Cash timing assumptions
That structure makes later revisions easier. When actual results differ from forecast, you can see whether the issue came from volume, pricing, margin, overhead, or collections.
Construct Your Three-Statement Financial Forecast
Many startup forecasts fail because they stop at revenue and expense lines. That gives you a partial view. It might show whether the business could become profitable, but it won't show whether the business stays liquid while it gets there.
EY notes in its guide to financial modeling for startups that a good financial model includes three outputs: the profit and loss statement, balance sheet, and cash flow statement. EY also recommends bottom-up forecasting for the short term, covering 1–2 years, and top-down forecasting for the longer term, covering 3–5 years.
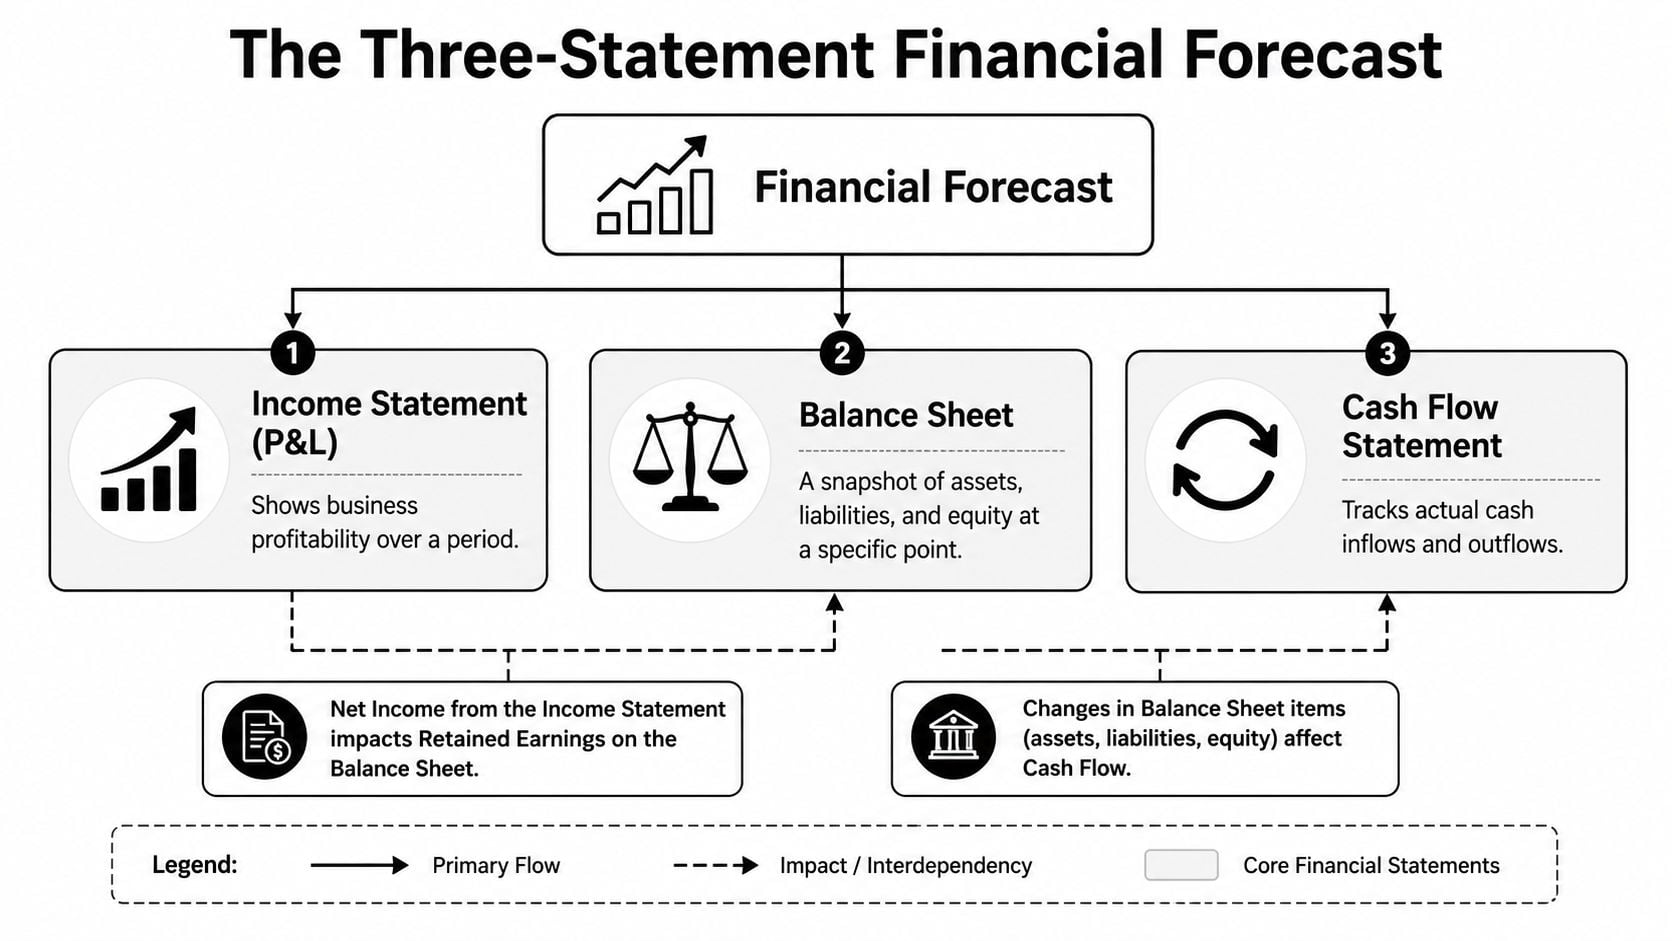
What each statement tells you
Think of the three statements as three different camera angles on the same business.
The income statement, or P&L, shows whether operations are generating profit over a period. It captures revenue, direct costs, operating expenses, and the resulting income or loss.
The balance sheet shows what the company owns and owes at a point in time. Cash, receivables, inventory, debt, payables, and equity all live here. The balance sheet also reveals working capital's true state.
The cash flow statement shows actual cash movement. It bridges accounting profit to real liquidity.
Here's the simplest version:
- P&L asks: Are we profitable?
- Balance sheet asks: What financial position are we carrying?
- Cash flow asks: How much money moved in or out?
How the statements connect
At this juncture, founders often level up. Once you see the statements as connected, forecasting gets sharper.
A company can book revenue on the P&L and still not have the cash. That unpaid invoice sits in accounts receivable on the balance sheet. The cash flow statement then shows the gap between recorded profit and collected money.
The same thing happens on the cost side. You may buy inventory or commit to a project cost before the related revenue shows up. You may have debt service or equipment spending that doesn't show cleanly as an operating expense on the P&L, yet still drains cash.
A forecast that isn't linked across all three statements can tell you the business is “fine” while the bank account says otherwise.
For startups and growth-stage businesses, this matters most in a few areas:
| Area | Why it matters |
|---|---|
| Accounts receivable | Sales don't help much if customers pay slowly |
| Inventory or project costs | Cash can leave well before revenue is recognized |
| Debt and lease obligations | These create real cash demands regardless of reported profit |
| Capital expenditures | Equipment and systems spending can tighten liquidity fast |
A practical build order
When I build a first real forecast with a founder, I usually use this order:
- Revenue schedule first. Start monthly. Tie it to the actual sales engine.
- Direct cost schedule next. Match costs to delivery assumptions, not broad percentages.
- Operating expense schedule. Build payroll, occupancy, software, sales and marketing, and admin costs line by line.
- Working capital assumptions. Add receivables, payables, inventory, retainage, or deferred revenue if relevant.
- Debt and capital spending. Include loan payments, interest logic, and expected purchases.
- Link the statements. Make sure net income, balance sheet accounts, and cash movement reconcile.
If you're doing financial forecasting for startups for the first time, don't start with a fancy template. Start with clean logic. Inputs, calculations, and outputs should be separated so you can change assumptions without breaking the whole model.
Spreadsheet tools like Excel and Google Sheets work well at first. Later, a more formal FP&A system may help. But software won't fix weak thinking. Clear assumptions and correct linkages matter more than the platform.
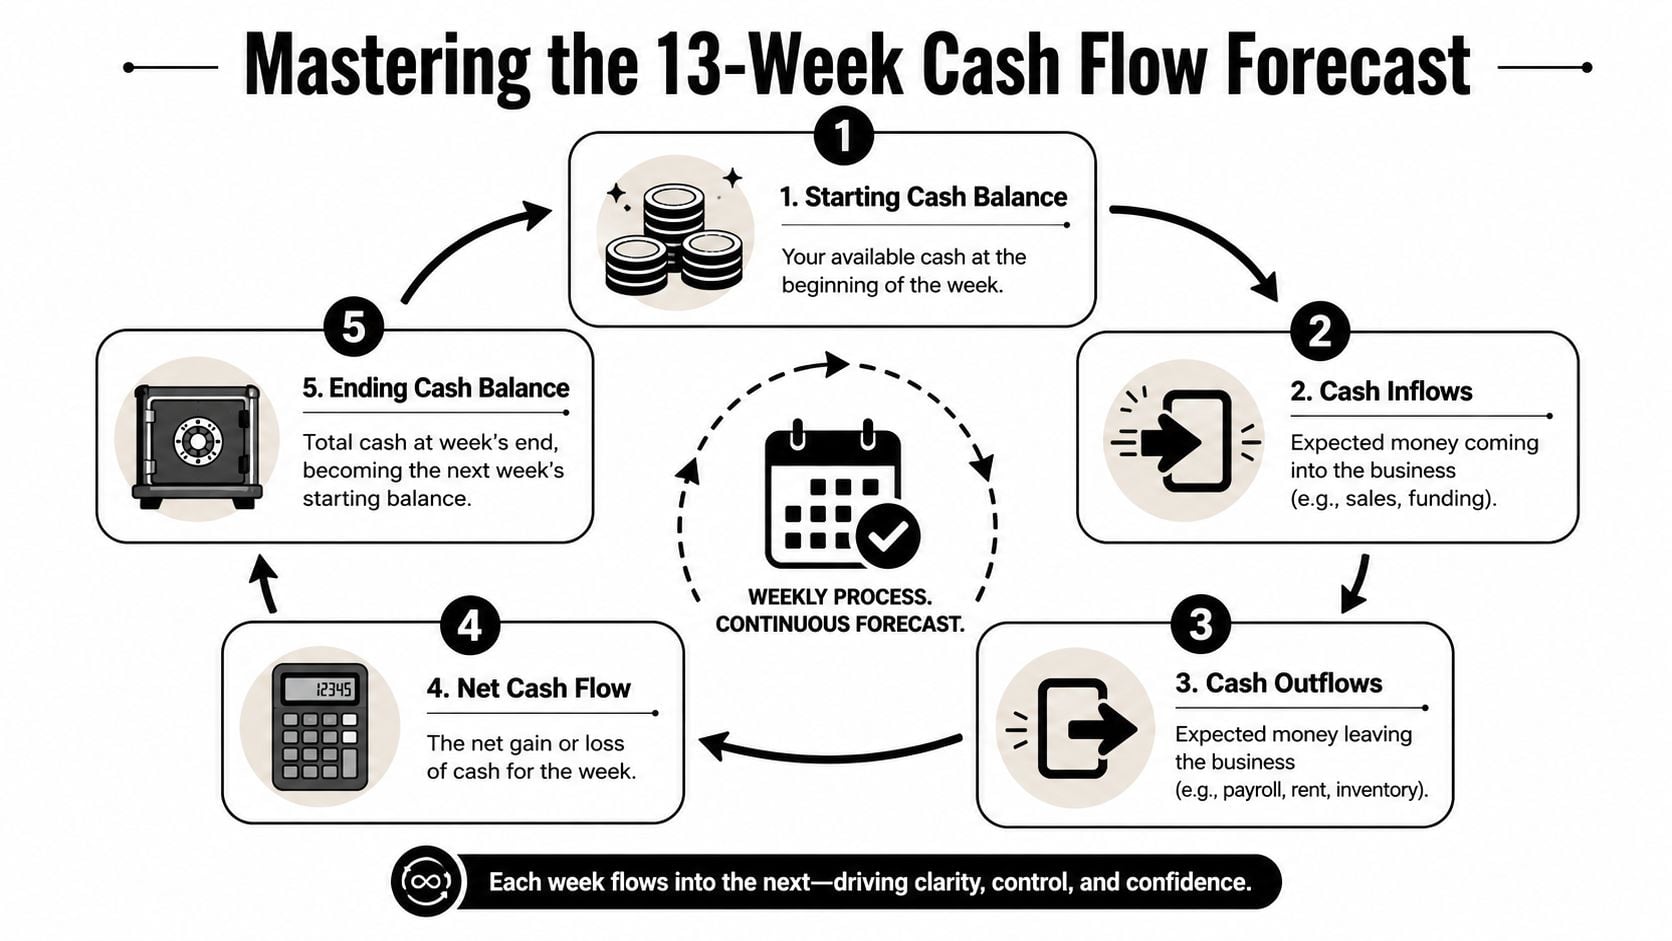
Master the Tactical 13-Week Cash Flow Forecast
The annual or multi-year forecast helps you steer the company. The 13-week cash flow forecast helps you survive the drive.
This is the tool I wish more founders built earlier. It forces weekly discipline. It also answers the most practical question in startup finance: when will cash get tight, and what can we do before that happens?
To ground that process, use a simple weekly framework like this:
A lot of financial forecasting content focuses on revenue growth and broad scenario planning. That misses the main operating risk. As noted in Qubit Capital's discussion of forecasting importance, a major underserved issue is cash-flow timing under uncertainty, especially the founder's question: when do we run out of cash if collections slip by 30–90 days?
Why weekly cash visibility changes decisions
A monthly model is useful, but it can hide a near-term problem.
Say customer cash is expected late in the month, but payroll and vendor drafts hit early. Your monthly model may still show a positive month. Your weekly cash forecast may show a dangerous dip in the middle. That difference drives decisions such as:
- Delay a hire: Not because the role is wrong, but because the timing is wrong.
- Push a purchase: Equipment may still make sense next quarter.
- Accelerate collections: A few customer calls can matter more than a revenue plan.
- Negotiate payment terms: Better vendor timing can reduce pressure quickly.
For project-based businesses, this gets even more important. Construction, implementation-heavy services, and custom manufacturing often experience timing mismatches between labor, materials, billing, and collections. A 13-week model makes those mismatches visible before they become emergencies.
If you also need a more formal planning process around spending, connect this cash view to a business budgeting process that supports operating decisions.
What goes into the model
The structure is simple. The discipline is not.
Start with weekly columns and a beginning cash balance. Then list every expected inflow and outflow by week.
Cash inflows might include
- Customer receipts: Based on actual invoices and expected collection timing
- Deposits or progress billings: Common in project-based work
- Loan proceeds or owner funding: If applicable
- Other cash events: Tax refunds, rebates, or one-time receipts
Cash outflows usually include
- Payroll: Wages, taxes, benefits, and contractor payments
- Occupancy costs: Rent, utilities, and related fixed overhead
- Suppliers: Materials, inventory, subcontractors, and freight
- Debt service: Principal and interest
- Taxes and insurance: Often overlooked until they hit
- Capital spending: Equipment, systems, or implementation costs
A short tutorial can help if your team hasn't built one before:
How to keep it useful
The first version of a 13-week forecast is rarely elegant. That's fine. Accuracy improves as the team builds the habit.
Use these rules:
- Update it every week. A stale cash forecast is almost useless.
- Use real payment dates when you can. Don't round everything to month-end.
- Separate committed cash from expected cash. Payroll is committed. A late customer payment is not.
- Track forecast versus actual weekly. The misses teach you where timing assumptions are weak.
- Roll it forward continuously. When one week ends, add another.
Weekly cash forecasting doesn't replace the strategic model. It protects it.
A founder who knows their 13-week cash position can act early. That means tighter collection follow-up, better hiring timing, cleaner lender conversations, and fewer unpleasant surprises.
Stress-Test Your Future with Scenario Analysis
A base case forecast is only your current best estimate. It is not a promise.
That's why scenario analysis matters. The U.S. Chamber and SVB guidance summarized in this business forecasting resource stresses building base, best, and worst case scenarios in a rolling model, typically covering 3 years, then revising the forecast against actuals to manage burn rate, break-even timing, and working capital.
A realistic scenario story
Consider a distribution company that has solid demand, a healthy customer list, and a plan to expand into a new region. The founder's base case assumes the sales team ramps on schedule, product availability remains stable, and larger customers keep paying roughly in line with recent behavior.
The best case isn't “everything goes right.” That's not a useful forecast. A useful best case assumes a few favorable events that are plausible. A strong sales rep ramps faster. Mix shifts toward better-margin products. Supplier reliability improves enough to reduce rush shipping and backorders.
The worst case also needs to be specific. Not dramatic. Specific.
In that version, a key customer stretches payments. One supplier tightens terms. New region expansion takes longer to convert into repeat orders. None of those events are extreme. Together, they can put real pressure on cash and operating confidence.
Good scenario analysis doesn't ask whether the founder is optimistic or conservative. It asks which assumptions are fragile.
What to change in each scenario
A lot of teams build weak scenarios because they only adjust revenue. That's too shallow.
Change the operating drivers that move outcomes:
- Sales pace: New customer wins, conversion speed, average deal size, repeat volume
- Margin quality: Product mix, discounting, freight, subcontractor use, rework
- Collections timing: Slow-paying accounts can create the biggest short-term damage
- Hiring timing: Delayed hires can protect cash, but they may also limit delivery capacity
- Supplier behavior: Payment terms, lead times, and cost pressure
A simple scenario table can help keep this grounded:
| Scenario | What changes | What decision it informs |
|---|---|---|
| Base case | Current plan with realistic assumptions | Day-to-day operating plan |
| Best case | Faster sales ramp, stronger mix, steadier collections | Whether to accelerate hiring or expansion |
| Worst case | Slower conversion, margin pressure, delayed receipts | Cost controls, borrowing needs, timing changes |
The best use of scenario analysis isn't presentation. It's preparation.
If the downside case shows a cash pinch, you can decide now which costs to pause, which receivables to chase harder, and what conversations to have with lenders or vendors. If the upside case shows strain on fulfillment or staffing, you can prepare capacity before growth outruns operations.
That kind of thinking is what makes financial forecasting for startups operationally valuable. The model doesn't predict the future perfectly. It helps you rehearse it.
Translate Your Forecast into Actionable KPIs
A forecast without KPIs is hard to manage. It may look polished, but it won't tell the leadership team where to focus.
The right KPI set should come directly from the model. It should also stay small enough that your team can review it quickly and act on it. Most companies don't need more metrics. They need fewer metrics tied to decisions.
Use a short KPI set
Start with the handful of measures that connect operating activity to financial results.
For most startups and founder-led growth companies, the core list includes:
- Cash runway: How long current liquidity supports operations under the present plan
- Burn rate: How quickly the business uses cash when outflows exceed inflows
- Gross margin: Not just in total, but by product, client, project, or job where possible
- Sales pipeline conversion: Whether future revenue assumptions still look credible
- Collections performance: How quickly invoices turn into cash
For service, construction, and distribution businesses, I'd add one more priority. Margin by job, client, or product line. A company can hit total revenue targets and still underperform because the mix got worse, pricing slipped, or delivery costs climbed.
If you want a broader benchmark list, use a practical guide to the financial metrics every business owner should track. Keep the dashboard lean and decision-oriented.
Make variance analysis part of the monthly routine
Learning happens when you compare forecast to actuals.
That review should happen every month, and for cash-heavy businesses, parts of it should happen weekly. The purpose isn't to punish the team for misses. The purpose is to find out which assumptions are no longer true.
Use a simple monthly review structure:
| KPI or line item | Forecast | Actual | Variance | What caused it | Action |
|---|---|---|---|---|---|
| Revenue | Planned result | Actual result | Better or worse | Volume, pricing, timing, mix | Adjust sales plan or forecast |
| Gross margin | Planned margin | Actual margin | Better or worse | Cost overruns, discounting, mix | Fix pricing or delivery discipline |
| Operating expense | Planned spend | Actual spend | Better or worse | Hiring, software, one-time costs | Rephase or cut spending |
| Cash balance | Planned ending cash | Actual cash | Better or worse | Collections, timing, vendor payments | Tighten weekly cash actions |
This process often reveals patterns that broad reporting hides.
Maybe revenue missed because one large customer order shifted a few weeks. That may not be a strategy problem. Maybe margin missed because subcontractor usage climbed on lower-quality jobs. That is a strategy problem. Maybe cash missed even though profit looked fine. That usually points back to working capital timing.
The forecast becomes valuable when actual results feed it back into reality.
A founder should leave each review with a short answer to three questions:
- What changed?
- Why did it change?
- What are we doing now because of it?
That is what turns a forecast from a spreadsheet into a management system.
Prepare a Forecast That Inspires Confidence
A forecast says as much about leadership discipline as it does about financial expectations.
Banks, boards, and potential buyers aren't looking for perfection. They're looking for logic, clarity, and evidence that management understands the business drivers underneath the numbers.
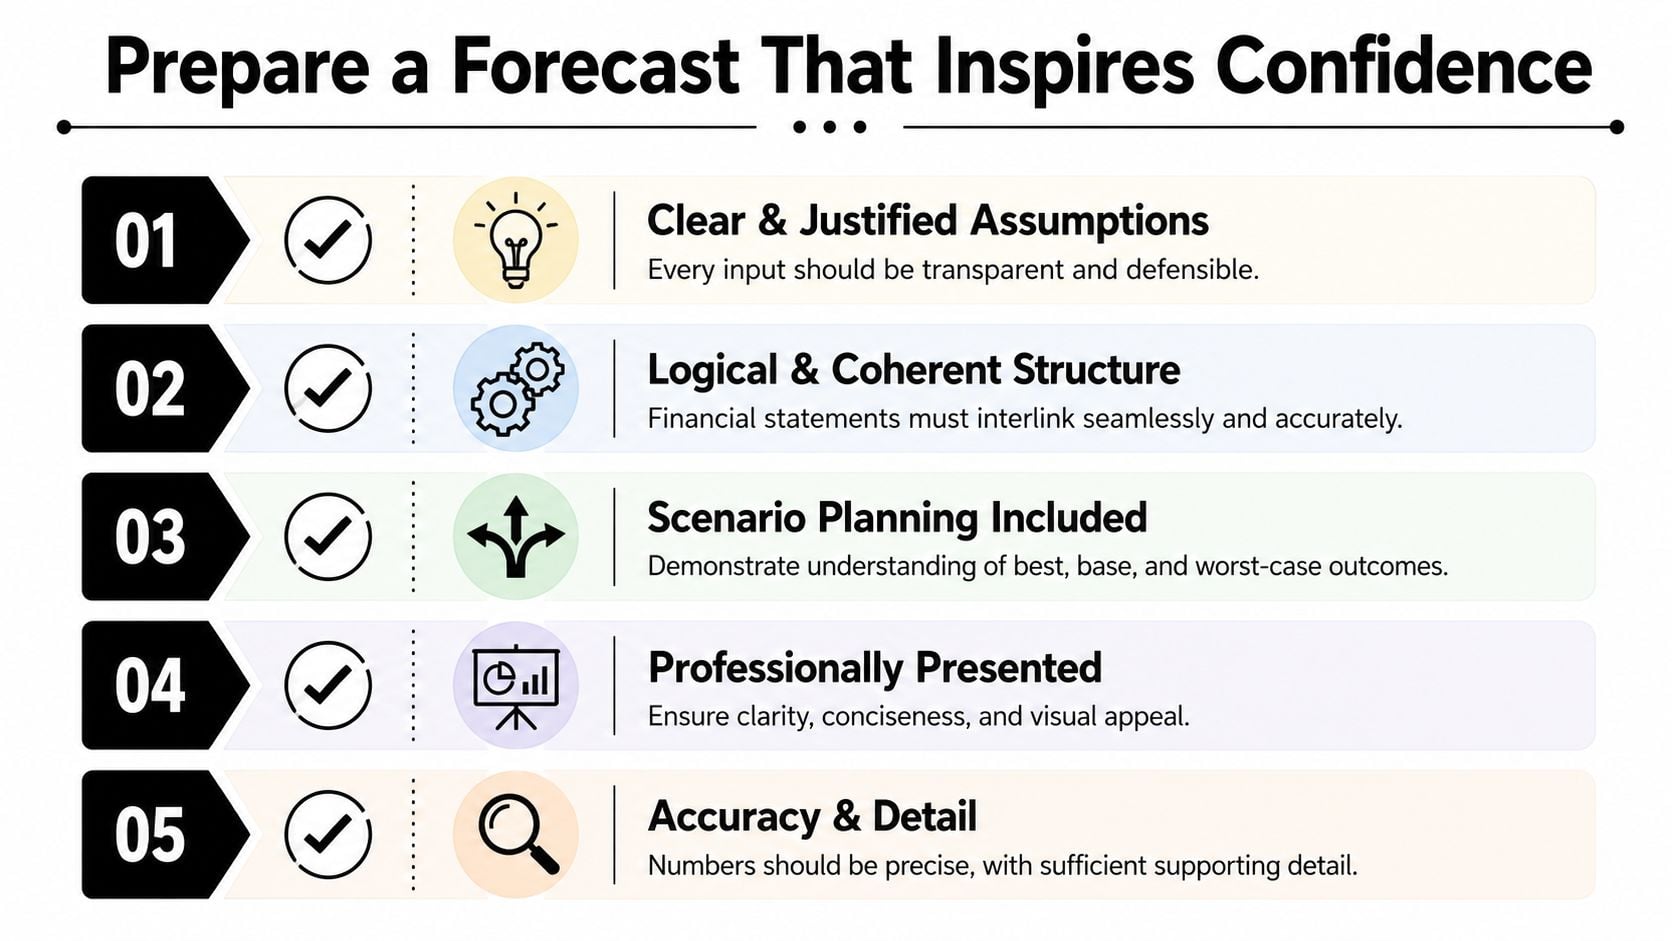
What an external audience needs to see
A credible forecast package usually includes a short assumptions summary, linked financial statements, a cash view, and scenario analysis. It should be easy for another person to follow how the model works.
Keep the presentation clean:
- Lead with assumptions: State the operational drivers behind revenue, margin, hiring, and collections.
- Show the statement summary: Present P&L, balance sheet, and cash flow in a format that ties together cleanly.
- Include cash implications: A stakeholder should be able to see the liquidity effect of the plan.
- Add scenario thinking: Show how the business performs if key assumptions change.
- Explain management actions: If results move off plan, what will leadership do?
When a buyer or lender reviews a forecast, they want to see that management can connect strategy to financial consequences. That matters for expansion decisions. It matters even more for exit readiness.
Red flags that weaken credibility fast
Three problems show up again and again.
First, the model contains aggressive revenue growth with no operating logic behind it. If there's no clear link to sales capacity, pricing, conversion, or delivery capability, the numbers won't hold up.
Second, the forecast ignores working capital. A company can look profitable and still create concern if receivables, inventory, payables, or project timing are handled casually.
Third, the file is hard to follow. Hidden formulas, circular logic, and inconsistent assumptions make even decent forecasts look sloppy.
Here's a simple external-readiness checklist:
| Checkpoint | What good looks like |
|---|---|
| Assumptions | Transparent, specific, tied to business activity |
| Structure | Inputs, calculations, and outputs are clearly separated |
| Linkage | Statements reconcile and cash movement makes sense |
| Scenarios | Not generic. Built from real operating risks |
| Presentation | Short, readable, and defensible in conversation |
A forecast inspires confidence when ambition is paired with discipline. Not when the numbers are big, but when the logic is sound.
Take Control of Your Financial Future Today
A startup forecast should help you decide, not just describe. When you build it from operating drivers, connect it across the full financial picture, and monitor cash weekly, you stop guessing your way through growth.
That's the shift that matters most in financial forecasting for startups. The forecast becomes a living tool for hiring, pricing, expansion, working-capital management, and exit readiness. It gives you a way to test decisions before they hit the bank account.
Start simple. Build from real assumptions. Review actuals against the model. Keep your 13-week cash forecast current. If you do that consistently, the forecast becomes one of the most useful tools in the business.
If you want an experienced CFO partner to help build a forecast that supports cash flow, operational decisions, and exit planning, talk with AmbitionCFO.